C# Jobs in the UK excluding London

C#
UK > UK excluding London

The table below provides summary statistics for permanent job vacancies advertised in the UK excluding London requiring C# skills. It includes a benchmarking guide to the annual salaries offered in vacancies that cited C# over the 6 months leading up to 30 May 2025, comparing them to the same period in the previous two years.

6 months to
30 May 2025
Same period 2024 Same period 2023
Rank 65 19 22
Rank change year-on-year -46 +3 -7
Permanent jobs citing C# 1,622 6,285 5,737
As % of all permanent jobs advertised in the UK excluding London 4.12% 8.43% 9.89%
As % of the Programming Languages category 15.55% 27.49% 25.00%
Number of salaries quoted 1,323 5,298 3,948
10th Percentile £35,000 £35,000 £37,250
25th Percentile £45,125 £42,500 £45,000
Median annual salary (50th Percentile) £57,500 £55,000 £55,000
Median % change year-on-year +4.55% - +4.76%
75th Percentile £67,500 £65,000 £70,000
90th Percentile £83,750 £75,000 £82,500
UK median annual salary £62,500 £57,500 £62,500
% change year-on-year +8.70% -8.00% +8.70%

All Programming Languages
UK excluding London

C# falls under the Programming Languages category. For comparison with the information above, the following table provides summary statistics for all permanent job vacancies requiring coding skills in the UK excluding London.

Permanent vacancies with a requirement for coding skills 10,434 22,861 22,951
As % of all permanent jobs advertised in the UK excluding London 26.50% 30.66% 39.56%
Number of salaries quoted 6,760 16,543 13,080
10th Percentile £32,500 £32,500 £35,000
25th Percentile £45,000 £41,250 £42,500
Median annual salary (50th Percentile) £55,000 £53,635 £55,000
Median % change year-on-year +2.54% -2.48% +4.76%
75th Percentile £66,307 £67,500 £71,194
90th Percentile £80,000 £80,000 £83,750
UK median annual salary £60,000 £60,000 £65,000
% change year-on-year - -7.69% +4.00%

C#
Job Vacancy Trend in the UK excluding London

Job postings citing C# as a proportion of all IT jobs advertised in the UK excluding London.
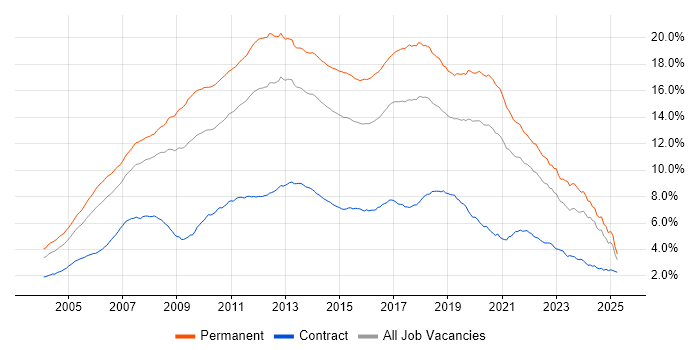
Job vacancy trend for C# in the UK excluding London

C#
Salary Trend in the UK excluding London

3-month moving average salary quoted in jobs citing C# in the UK excluding London.

Salary trend for C# in the UK excluding London

C#
Salary Histogram in the UK excluding London

Salary distribution for jobs citing C# in the UK excluding London over the 6 months to 30 May 2025.

Salary histogram for C# in the UK excluding London

C#
Job Locations in the UK excluding London

The table below looks at the demand and provides a guide to the median salaries quoted in IT jobs citing C# within the UK excluding London region over the 6 months to 30 May 2025. The 'Rank Change' column provides an indication of the change in demand within each location based on the same 6 month period last year.

Location Rank Change
on Same Period
Last Year
Matching
Permanent
IT Job Ads
Median Salary
Past 6 Months
Median Salary
% Change
on Same Period
Last Year
Live
Jobs
South East -41 428 £60,000 +4.35% 1,999
North of England -93 368 £52,500 -4.55% 1,661
Midlands -32 330 £55,000 +10.00% 1,364
East of England -22 262 £66,206 +15.14% 1,048
West Midlands -17 226 £55,000 +4.76% 725
North West -115 213 £50,000 -6.25% 820
South West -55 114 £55,000 +10.00% 809
Yorkshire -49 106 £67,500 +28.57% 617
East Midlands -53 103 £55,000 +10.00% 557
Scotland -29 83 £50,000 -9.09% 316
North East -9 49 £57,500 -4.17% 231
Wales -29 38 £65,000 +30.00% 198
C#
UK

C#
Co-occurring Skills and Capabilities in the UK excluding London by Category

The follow tables expand on the table above by listing co-occurrences grouped by category. The same employment type, locality and period is covered with up to 20 co-occurrences shown in each of the following categories:

Application Platforms
1 71 (4.38%) SharePoint
2 46 (2.84%) CMS
3 45 (2.77%) Confluence
4 35 (2.16%) Umbraco
5 28 (1.73%) Apache
5 28 (1.73%) IIS
6 12 (0.74%) Kinematics
7 6 (0.37%) WordPress
8 5 (0.31%) Apache Spark
9 4 (0.25%) Microsoft Exchange
9 4 (0.25%) Sitecore CMS
9 4 (0.25%) Sitefinity
10 3 (0.18%) Apache Airflow
10 3 (0.18%) Headless CMS
11 2 (0.12%) Apache Solr
11 2 (0.12%) DNN
11 2 (0.12%) Kentico
11 2 (0.12%) NServiceBus
11 2 (0.12%) OpenEdge
12 1 (0.062%) Luigi
Applications
1 129 (7.95%) Chatbot
2 9 (0.55%) Microsoft Excel
3 7 (0.43%) Microsoft Office
3 7 (0.43%) Revit
4 5 (0.31%) Trello
5 3 (0.18%) Productboard
6 2 (0.12%) GNU Octave
6 2 (0.12%) Microsoft Project
6 2 (0.12%) OrCAD
7 1 (0.062%) Adobe Illustrator
7 1 (0.062%) Adobe XD
7 1 (0.062%) AutoCAD
7 1 (0.062%) InVision
7 1 (0.062%) Microsoft PowerPoint
7 1 (0.062%) Photoshop
7 1 (0.062%) Sketch
7 1 (0.062%) S-PLUS
Business Applications
1 67 (4.13%) Dynamics CRM
2 13 (0.80%) Sage 200
2 13 (0.80%) Sage 50
3 12 (0.74%) Payment Gateway
4 9 (0.55%) Shopify
5 8 (0.49%) Magento
6 4 (0.25%) Infor CloudSuite
6 4 (0.25%) Infor CloudSuite Industrial (formerly SyteLine)
6 4 (0.25%) Oracle EBS
7 3 (0.18%) SAP Business One
8 2 (0.12%) Sage 1000
9 1 (0.062%) Endur
9 1 (0.062%) Visualfiles
Cloud Services
1 609 (37.55%) Azure
2 233 (14.36%) AWS
3 193 (11.90%) Azure DevOps
4 142 (8.75%) Power Platform
5 125 (7.71%) SaaS
6 98 (6.04%) Dynamics 365
7 87 (5.36%) Power Automate
8 72 (4.44%) GitHub
8 72 (4.44%) PowerApps
9 66 (4.07%) Azure Service Bus
10 65 (4.01%) Serverless
11 53 (3.27%) Azure Cosmos DB
12 45 (2.77%) Azure Logic Apps
13 41 (2.53%) Microsoft 365
14 33 (2.03%) Azure Synapse Analytics
15 32 (1.97%) AWS Lambda
16 31 (1.91%) GCP
17 30 (1.85%) SonarCloud
18 26 (1.60%) Azure Data Factory
18 26 (1.60%) GitHub Actions
Communications & Networking
1 19 (1.17%) TCP/IP
2 18 (1.11%) Network Security
3 17 (1.05%) Intranet
4 12 (0.74%) Firewall
4 12 (0.74%) MQTT
5 11 (0.68%) Modbus
6 10 (0.62%) Internet
6 10 (0.62%) Intrusion Detection
7 9 (0.55%) HTTP
8 4 (0.25%) Ethernet
9 3 (0.18%) Broadband
9 3 (0.18%) DNS
9 3 (0.18%) SAN
10 2 (0.12%) RS-232
10 2 (0.12%) RS-485
11 1 (0.062%) RS-422
11 1 (0.062%) SSL
11 1 (0.062%) tcpdump
11 1 (0.062%) Wireshark
11 1 (0.062%) ZigBee
Database & Business Intelligence
1 405 (24.97%) SQL Server
2 99 (6.10%) MySQL
3 75 (4.62%) Relational Database
4 66 (4.07%) NoSQL
5 63 (3.88%) MongoDB
5 63 (3.88%) Power BI
6 57 (3.51%) Elasticsearch
7 37 (2.28%) PostgreSQL
7 37 (2.28%) SQL Server Integration Services
8 30 (1.85%) SQL Server Reporting Services
9 29 (1.79%) Big Data
10 26 (1.60%) Azure SQL Database
11 20 (1.23%) RDBMS
12 19 (1.17%) Data Warehouse
12 19 (1.17%) Redis
13 8 (0.49%) DynamoDB
14 7 (0.43%) MS Access
15 6 (0.37%) Microsoft Analysis Services
15 6 (0.37%) SQL Server Analysis Services
16 4 (0.25%) KDB
Development Applications
1 232 (14.30%) Git
2 118 (7.27%) Visual Studio
3 103 (6.35%) JIRA
4 57 (3.51%) Bitbucket
5 56 (3.45%) Octopus Deploy
6 39 (2.40%) Team Foundation Server
7 37 (2.28%) Jenkins
8 32 (1.97%) MSBuild
9 31 (1.91%) Selenium
10 28 (1.73%) NUnit
10 28 (1.73%) TeamCity
11 25 (1.54%) Eclipse
11 25 (1.54%) Eclipse RCP
12 16 (0.99%) Atlassian Bamboo
12 16 (0.99%) SpecFlow
13 15 (0.92%) Rational DOORS
14 14 (0.86%) MagicDraw
14 14 (0.86%) Postman
15 13 (0.80%) GitLab
16 11 (0.68%) Visual Studio Code
General
1 330 (20.35%) Social Skills
2 179 (11.04%) Finance
3 105 (6.47%) Retail
4 83 (5.12%) Law
5 78 (4.81%) Analytical Skills
6 74 (4.56%) Manufacturing
7 49 (3.02%) Electronics
8 40 (2.47%) Banking
9 28 (1.73%) Public Sector
10 27 (1.66%) Automotive
11 25 (1.54%) Marketing
12 22 (1.36%) Inclusion and Diversity
13 17 (1.05%) Games
13 17 (1.05%) Tech for Good
14 16 (0.99%) Organisational Skills
15 14 (0.86%) Back Office
15 14 (0.86%) Legal
15 14 (0.86%) Police
16 13 (0.80%) Aerospace
17 10 (0.62%) Front Office
Job Titles
1 815 (50.25%) Developer
2 349 (21.52%) Senior
3 310 (19.11%) Software Engineer
4 229 (14.12%) .NET Developer
5 202 (12.45%) Lead
6 201 (12.39%) C# Developer
7 181 (11.16%) Senior Developer
7 181 (11.16%) Software Developer
8 126 (7.77%) Full-Stack Developer
9 113 (6.97%) Trainer
10 102 (6.29%) C# .NET Developer
11 94 (5.80%) Senior Software Engineer
12 70 (4.32%) Architect
13 58 (3.58%) Dynamics 365 Developer
14 55 (3.39%) Lead Developer
15 54 (3.33%) Graduate
15 54 (3.33%) Junior
16 53 (3.27%) Lead Software Engineer
17 49 (3.02%) Senior C# Developer
18 47 (2.90%) Full-Stack C# Developer
Libraries, Frameworks & Software Standards
1 953 (58.75%) .NET
2 419 (25.83%) HTML
3 287 (17.69%) CSS
4 276 (17.02%) ASP.NET
5 243 (14.98%) .NET Core
6 230 (14.18%) React
7 189 (11.65%) .NET Framework
8 158 (9.74%) AngularJS
9 117 (7.21%) REST
10 114 (7.03%) RESTful
11 85 (5.24%) XML
12 83 (5.12%) jQuery
13 78 (4.81%) HTML5
14 75 (4.62%) Entity Framework
15 74 (4.56%) JSON
16 68 (4.19%) Blazor
17 61 (3.76%) ASP.NET MVC
18 59 (3.64%) Vue
19 57 (3.51%) Kafka
20 56 (3.45%) Node.js
Miscellaneous
1 55 (3.39%) Cloud Native
2 50 (3.08%) Product Ownership
3 46 (2.84%) Distributed Systems
4 45 (2.77%) Greenfield Project
5 44 (2.71%) Management Information System
6 43 (2.65%) Mobile App
7 40 (2.47%) Algorithms
8 34 (2.10%) Data Structures
9 26 (1.60%) IoT
10 25 (1.54%) Legacy Systems
11 24 (1.48%) Onboarding
12 21 (1.29%) Public Cloud
12 21 (1.29%) Robotics
13 20 (1.23%) Enterprise Software
14 18 (1.11%) NHS
15 17 (1.05%) Virtual Team
16 15 (0.92%) Acoustics
16 15 (0.92%) Private Cloud
16 15 (0.92%) Self-Motivation
17 14 (0.86%) FPGA
Operating Systems
1 134 (8.26%) Windows
2 107 (6.60%) Linux
3 22 (1.36%) Unix
4 20 (1.23%) Apple iOS
5 16 (0.99%) Android
6 12 (0.74%) Windows Server
7 2 (0.12%) Red Hat Enterprise Linux
7 2 (0.12%) VMS
8 1 (0.062%) Embedded Linux
8 1 (0.062%) FreeRTOS
8 1 (0.062%) VxWorks
Processes & Methodologies
1 552 (34.03%) Agile
2 511 (31.50%) Software Engineering
3 391 (24.11%) DevOps
4 380 (23.43%) Problem-Solving
5 330 (20.35%) CI/CD
6 249 (15.35%) Computer Science
7 248 (15.29%) Full-Stack Development
8 234 (14.43%) Artificial Intelligence
9 217 (13.38%) MVC
10 208 (12.82%) Microservices
11 202 (12.45%) Mentoring
12 186 (11.47%) Code Quality
13 181 (11.16%) OO
14 162 (9.99%) SDLC
15 145 (8.94%) Design Patterns
16 136 (8.38%) Continuous Improvement
16 136 (8.38%) Test Automation
17 129 (7.95%) Conversational UI
18 121 (7.46%) Scrum
19 115 (7.09%) OOP
Programming Languages
1 703 (43.34%) SQL
2 592 (36.50%) JavaScript
3 396 (24.41%) Python
4 340 (20.96%) Java
5 286 (17.63%) C++
6 209 (12.89%) TypeScript
7 139 (8.57%) C
8 97 (5.98%) PHP
9 93 (5.73%) Rust
10 57 (3.51%) Ada
11 56 (3.45%) MATLAB
11 56 (3.45%) R
11 56 (3.45%) Ruby
12 49 (3.02%) Dart
13 45 (2.77%) PowerShell
14 42 (2.59%) VB.NET
15 35 (2.16%) T-SQL
16 26 (1.60%) VB
17 18 (1.11%) Bash
18 17 (1.05%) Delphi
Qualifications
1 525 (32.37%) Degree
2 180 (11.10%) Computer Science Degree
3 105 (6.47%) BPSS Clearance
4 38 (2.34%) Security Cleared
5 28 (1.73%) Azure Certification
6 21 (1.29%) Master's Degree
7 18 (1.11%) SC Cleared
8 17 (1.05%) Microsoft Certification
9 10 (0.62%) AWS Certification
10 9 (0.55%) AWS Certified Solutions Architect
11 8 (0.49%) Numerate Degree
12 7 (0.43%) PhD
13 6 (0.37%) Chartered Engineer
13 6 (0.37%) MCP
13 6 (0.37%) MCSE
14 4 (0.25%) ISTQB
15 3 (0.18%) DBS Check
15 3 (0.18%) HND
15 3 (0.18%) ISTQB Foundation Certification
16 2 (0.12%) DV Cleared
Quality Assurance & Compliance
1 113 (6.97%) QA
2 60 (3.70%) GDPR
3 33 (2.03%) Accessibility
4 20 (1.23%) WCAG
5 18 (1.11%) ISO/IEC 27001
6 10 (0.62%) COBIT
6 10 (0.62%) Data Quality
7 7 (0.43%) NIST
7 7 (0.43%) PCI DSS
8 6 (0.37%) HIPAA
9 5 (0.31%) SOC 2
10 2 (0.12%) Actionable Recommendations
10 2 (0.12%) CDISC
10 2 (0.12%) Def Stans
10 2 (0.12%) ISO 13485
10 2 (0.12%) ISO 9001
11 1 (0.062%) HL7
11 1 (0.062%) NIST 800
System Software
1 147 (9.06%) Docker
2 23 (1.42%) Firmware
3 8 (0.49%) Virtual Machines
3 8 (0.49%) VMware Infrastructure
4 3 (0.18%) LXC
5 2 (0.12%) Embedded Firmware
5 2 (0.12%) Squid
5 2 (0.12%) VMware ESXi
5 2 (0.12%) vSphere
6 1 (0.062%) Hyper-V
6 1 (0.062%) Xen
Systems Management
1 123 (7.58%) Kubernetes
2 69 (4.25%) Terraform
3 42 (2.59%) Ansible
4 32 (1.97%) Grafana
5 22 (1.36%) Prometheus
6 6 (0.37%) Kibana
7 4 (0.25%) Docker Swarm
8 2 (0.12%) Control-M
8 2 (0.12%) Functional Safety
8 2 (0.12%) Nmap
9 1 (0.062%) logstash
Vendors
1 334 (20.59%) Microsoft
2 123 (7.58%) PayPal
3 59 (3.64%) Oracle
4 49 (3.02%) Databricks
5 43 (2.65%) Atlassian
6 29 (1.79%) Google
7 20 (1.23%) Salesforce
8 17 (1.05%) HP
9 15 (0.92%) MuleSoft
9 15 (0.92%) Sage
10 14 (0.86%) Informatica
10 14 (0.86%) ServiceNow
11 10 (0.62%) Rollbar
12 9 (0.55%) IBM
12 9 (0.55%) UiPath
12 9 (0.55%) VMware
13 8 (0.49%) Rockwell
13 8 (0.49%) Siemens
13 8 (0.49%) Telerik
13 8 (0.49%) Xamarin