Customer Requirements Jobs in the UK excluding London

Customer Requirements
UK > UK excluding London

The table below provides summary statistics for permanent job vacancies advertised in the UK excluding London requiring Customer Requirements skills. It includes a benchmarking guide to the annual salaries offered in vacancies that cited Customer Requirements over the 6 months leading up to 16 May 2025, comparing them to the same period in the previous two years.

6 months to
16 May 2025
Same period 2024 Same period 2023
Rank 76 208 128
Rank change year-on-year +132 -80 +97
Permanent jobs citing Customer Requirements 1,375 990 1,615
As % of all permanent jobs advertised in the UK excluding London 3.49% 1.40% 2.72%
As % of the Processes & Methodologies category 3.75% 1.66% 2.85%
Number of salaries quoted 481 565 294
10th Percentile £42,500 £27,500 £31,250
25th Percentile £48,869 £34,500 £37,500
Median annual salary (50th Percentile) £54,793 £48,500 £52,500
Median % change year-on-year +12.98% -7.62% +5.00%
75th Percentile £65,000 £62,500 £67,500
90th Percentile £68,750 £72,500 £87,500
UK median annual salary £55,000 £50,000 £57,500
% change year-on-year +10.00% -13.04% -4.17%

All Process and Methodology Skills
UK excluding London

Customer Requirements falls under the Processes and Methodologies category. For comparison with the information above, the following table provides summary statistics for all permanent job vacancies requiring process or methodology skills in the UK excluding London.

Permanent vacancies with a requirement for process or methodology skills 36,661 59,520 56,714
As % of all permanent jobs advertised in the UK excluding London 92.93% 83.89% 95.60%
Number of salaries quoted 17,979 41,130 29,107
10th Percentile £26,929 £27,218 £30,500
25th Percentile £37,574 £36,250 £40,000
Median annual salary (50th Percentile) £52,000 £50,000 £55,000
Median % change year-on-year +4.00% -9.09% +4.76%
75th Percentile £65,000 £65,000 £70,000
90th Percentile £78,750 £77,500 £82,500
UK median annual salary £57,500 £55,000 £61,180
% change year-on-year +4.55% -10.10% +1.97%

Customer Requirements
Job Vacancy Trend in the UK excluding London

Job postings citing Customer Requirements as a proportion of all IT jobs advertised in the UK excluding London.
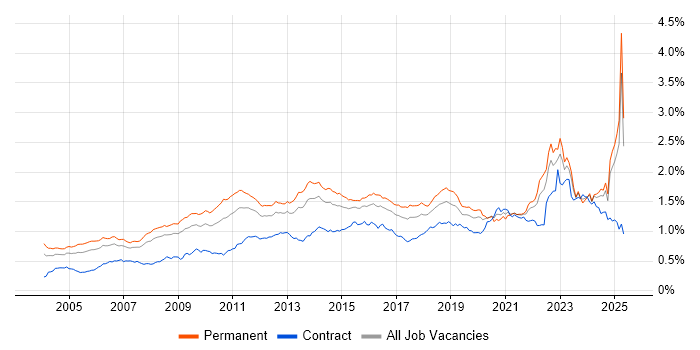
Job vacancy trend for Customer Requirements in the UK excluding London

Customer Requirements
Salary Trend in the UK excluding London

3-month moving average salary quoted in jobs citing Customer Requirements in the UK excluding London.

Salary trend for Customer Requirements in the UK excluding London

Customer Requirements
Salary Histogram in the UK excluding London

Salary distribution for jobs citing Customer Requirements in the UK excluding London over the 6 months to 16 May 2025.

Salary histogram for Customer Requirements in the UK excluding London

Customer Requirements
Job Locations in the UK excluding London

The table below looks at the demand and provides a guide to the median salaries quoted in IT jobs citing Customer Requirements within the UK excluding London region over the 6 months to 16 May 2025. The 'Rank Change' column provides an indication of the change in demand within each location based on the same 6 month period last year.

Location Rank Change
on Same Period
Last Year
Matching
Permanent
IT Job Ads
Median Salary
Past 6 Months
Median Salary
% Change
on Same Period
Last Year
Live
Jobs
South East +88 398 £65,000 +44.44% 169
North of England +129 360 £50,055 +0.11% 122
East of England +125 325 £59,250 +7.73% 65
North West +113 324 £50,055 +0.11% 63
Midlands +6 209 £47,500 -9.52% 99
East Midlands +97 194 £45,000 +55.17% 48
South West +37 47 £56,121 +27.55% 54
Wales +53 30 £65,000 +100.00% 11
Yorkshire +43 27 £51,250 -6.82% 47
West Midlands -102 15 £50,000 -13.04% 46
Scotland +105 9 £46,000 +8.24% 31
North East +43 9 £55,000 +36.65% 13
Northern Ireland +31 1 £60,000 +41.18% 10
Customer Requirements
UK

Customer Requirements
Co-occurring Skills and Capabilities in the UK excluding London by Category

The follow tables expand on the table above by listing co-occurrences grouped by category. The same employment type, locality and period is covered with up to 20 co-occurrences shown in each of the following categories:

Application Platforms
1 19 (1.38%) CMS
1 19 (1.38%) Umbraco
2 4 (0.29%) SharePoint
3 3 (0.22%) Microsoft Exchange
4 1 (0.073%) SharePoint Server
Applications
1 31 (2.25%) Microsoft Office
2 27 (1.96%) Microsoft Excel
3 19 (1.38%) Microsoft PowerPoint
4 13 (0.95%) MS Visio
5 5 (0.36%) Simulink
6 4 (0.29%) Microsoft Project
6 4 (0.29%) Trello
7 3 (0.22%) GNU Octave
8 1 (0.073%) AutoCAD
8 1 (0.073%) OrCAD
Business Applications
1 5 (0.36%) Q-Pulse
2 3 (0.22%) Magento
3 2 (0.15%) Shopify
4 1 (0.073%) Dynamics CRM
4 1 (0.073%) LabWindows
4 1 (0.073%) Maximo
4 1 (0.073%) SAP S/4HANA
Cloud Services
1 24 (1.75%) Azure
2 13 (0.95%) Power Platform
3 12 (0.87%) Serverless
4 9 (0.65%) SaaS
5 8 (0.58%) AWS
5 8 (0.58%) Azure Data Factory
5 8 (0.58%) Cloud Computing
5 8 (0.58%) Figma
6 6 (0.44%) Azure Functions
6 6 (0.44%) Azure Logic Apps
6 6 (0.44%) GitHub
6 6 (0.44%) Smartsheet
7 5 (0.36%) Azure DevOps
7 5 (0.36%) Azure Service Bus
7 5 (0.36%) GitHub Actions
7 5 (0.36%) Power Automate
8 4 (0.29%) Azure Synapse Analytics
8 4 (0.29%) Dynamics 365
8 4 (0.29%) Miro
8 4 (0.29%) Slack
Communications & Networking
1 729 (53.02%) 5G
2 724 (52.65%) GSM
2 724 (52.65%) Wireless
3 722 (52.51%) LTE
3 722 (52.51%) Wi-Fi
4 721 (52.44%) Bluetooth
4 721 (52.44%) UMTS
5 19 (1.38%) Intranet
6 18 (1.31%) WAN
7 12 (0.87%) SD-WAN
8 10 (0.73%) Internet
9 9 (0.65%) OSPF
10 8 (0.58%) EIGRP
11 6 (0.44%) BGP
11 6 (0.44%) Firewall
11 6 (0.44%) Network Security
11 6 (0.44%) RIP
11 6 (0.44%) SNMP
11 6 (0.44%) SSH
11 6 (0.44%) VoIP
Database & Business Intelligence
1 21 (1.53%) SQL Server
2 9 (0.65%) Power BI
3 4 (0.29%) Data Warehouse
3 4 (0.29%) DTS
4 3 (0.22%) Amazon RDS
4 3 (0.22%) Azure SQL Database
4 3 (0.22%) Data Lake
4 3 (0.22%) NoSQL
5 1 (0.073%) MySQL
5 1 (0.073%) PostgreSQL
5 1 (0.073%) SQL Server Integration Services
Development Applications
1 59 (4.29%) Rational DOORS
2 18 (1.31%) JIRA
3 12 (0.87%) Git
4 7 (0.51%) Postman
5 5 (0.36%) Visual Studio Code
6 4 (0.29%) Balsamiq
6 4 (0.29%) Selenium
6 4 (0.29%) Subversion
6 4 (0.29%) Visual Studio
7 2 (0.15%) Maven
7 2 (0.15%) SoapUI
8 1 (0.073%) Atlassian Bamboo
8 1 (0.073%) CMake
8 1 (0.073%) Cucumber
8 1 (0.073%) ERwin
8 1 (0.073%) FitNesse
8 1 (0.073%) Jenkins
8 1 (0.073%) Newman
8 1 (0.073%) Rational Rhapsody
General
1 749 (54.47%) Electronics
2 232 (16.87%) Social Skills
3 194 (14.11%) Avionics
4 147 (10.69%) Aerospace
5 109 (7.93%) Manufacturing
6 65 (4.73%) Influencing Skills
7 60 (4.36%) Finance
8 48 (3.49%) Analytical Skills
9 21 (1.53%) Organisational Skills
10 19 (1.38%) Inclusion and Diversity
11 18 (1.31%) Public Sector
12 17 (1.24%) Presentation Skills
12 17 (1.24%) Retail
13 16 (1.16%) Military
13 16 (1.16%) Telecoms
14 14 (1.02%) Aviation
15 12 (0.87%) Marketing
16 11 (0.80%) Law
17 8 (0.58%) Police
18 6 (0.44%) Pharmaceutical
Job Titles
1 728 (52.95%) Electronics Engineer
2 724 (52.65%) Test Engineer
3 721 (52.44%) Electronics Test Engineer
4 286 (20.80%) Senior
5 246 (17.89%) Systems Engineer
6 233 (16.95%) Senior Systems Engineer
7 137 (9.96%) Architect
8 62 (4.51%) Solutions Architect
9 56 (4.07%) Project Manager
9 56 (4.07%) Systems Architect
10 44 (3.20%) Lead
11 31 (2.25%) Infrastructure Manager
11 31 (2.25%) Infrastructure Project Manager
12 30 (2.18%) Developer
13 28 (2.04%) Software Team Leader
13 28 (2.04%) Team Leader
14 20 (1.45%) Senior Manager
15 19 (1.38%) Umbraco Developer
16 18 (1.31%) Analyst
17 15 (1.09%) Infrastructure Specialist
Libraries, Frameworks & Software Standards
1 26 (1.89%) CSS
1 26 (1.89%) XML
2 25 (1.82%) HTML
3 19 (1.38%) HTML5
3 19 (1.38%) jQuery
4 14 (1.02%) AngularJS
5 9 (0.65%) Vue
6 8 (0.58%) .NET
7 7 (0.51%) React
8 6 (0.44%) .NET Framework
8 6 (0.44%) gRPC
8 6 (0.44%) Tailwind CSS
9 5 (0.36%) ASP.NET Web API
9 5 (0.36%) Bootstrap
9 5 (0.36%) JSON
10 4 (0.29%) NgRx
10 4 (0.29%) RxJS
11 3 (0.22%) Laravel
11 3 (0.22%) OAuth
11 3 (0.22%) Serverless Framework
Miscellaneous
1 737 (53.60%) Driving Licence
2 64 (4.65%) Management Information System
3 22 (1.60%) NHS
4 20 (1.45%) Self-Motivation
5 17 (1.24%) Embedded Systems
6 13 (0.95%) Product Ownership
6 13 (0.95%) Virtual Team
7 10 (0.73%) Algorithms
8 8 (0.58%) Data Structures
8 8 (0.58%) Self-Driving Car
8 8 (0.58%) Social Network
9 6 (0.44%) CPLD
9 6 (0.44%) FPGA
10 5 (0.36%) Client/Server
10 5 (0.36%) e-Learning
10 5 (0.36%) Reference Data
11 4 (0.29%) Data Centre
11 4 (0.29%) Linux Command Line
11 4 (0.29%) Onboarding
12 3 (0.22%) Cloud Native
Operating Systems
1 15 (1.09%) Linux
2 8 (0.58%) Windows
3 6 (0.44%) Red Hat Enterprise Linux
3 6 (0.44%) Windows Server
4 4 (0.29%) Solaris
4 4 (0.29%) Unix
5 3 (0.22%) AIX
6 2 (0.15%) Windows 10
6 2 (0.15%) zOS
7 1 (0.073%) Android
7 1 (0.073%) Apple iOS
7 1 (0.073%) Mac OS
7 1 (0.073%) Windows Server 2012
7 1 (0.073%) Windows Server 2016
7 1 (0.073%) Windows Server 2019
Processes & Methodologies
1 804 (58.47%) Mentoring
2 792 (57.60%) Coaching
3 746 (54.25%) Validation
4 728 (52.95%) Verification and Validation
5 721 (52.44%) Test Strategy
6 280 (20.36%) Systems Engineering
7 240 (17.45%) Requirements Management
8 220 (16.00%) Business Case
9 165 (12.00%) SDLC
10 134 (9.75%) Feasibility Study
11 131 (9.53%) Hazard Analysis
12 105 (7.64%) Collaborative Working
13 86 (6.25%) Problem-Solving
13 86 (6.25%) Project Management
14 79 (5.75%) Systems Thinking
15 72 (5.24%) Configuration Management
16 70 (5.09%) Roadmaps
17 63 (4.58%) Model-Based Systems Engineering
18 61 (4.44%) Cryptography
19 59 (4.29%) CAD
Programming Languages
1 37 (2.69%) SQL
2 32 (2.33%) C#
3 29 (2.11%) C
4 15 (1.09%) JavaScript
5 14 (1.02%) Ada
5 14 (1.02%) TypeScript
6 12 (0.87%) MATLAB
7 10 (0.73%) C++
8 6 (0.44%) Python
9 5 (0.36%) PL/SQL
10 4 (0.29%) Perl
11 3 (0.22%) PHP
11 3 (0.22%) PowerShell
11 3 (0.22%) R
11 3 (0.22%) VB
12 2 (0.15%) Embedded C
12 2 (0.15%) Java
12 2 (0.15%) Scala
12 2 (0.15%) T-SQL
13 1 (0.073%) Pascal
Qualifications
1 1,135 (82.55%) Degree
2 784 (57.02%) HND
3 306 (22.25%) BPSS Clearance
4 93 (6.76%) HNC
5 78 (5.67%) Chartered Engineer
6 43 (3.13%) Security Cleared
7 26 (1.89%) SC Cleared
8 19 (1.38%) Computer Science Degree
9 18 (1.31%) Master's Degree
9 18 (1.31%) PhD
10 9 (0.65%) DV Cleared
11 5 (0.36%) PMI Certification
12 3 (0.22%) APMP
12 3 (0.22%) CCNP
12 3 (0.22%) Cisco Certification
12 3 (0.22%) PRINCE2 Practitioner
13 2 (0.15%) ISTQB
13 2 (0.15%) Microsoft Certification
13 2 (0.15%) PMP
13 2 (0.15%) PRINCE2 Certification
Quality Assurance & Compliance
1 71 (5.16%) ISO/IEC 15288
2 31 (2.25%) QA
3 30 (2.18%) NEBOSH
4 21 (1.53%) Accessibility
5 19 (1.38%) GDPR
5 19 (1.38%) WCAG
6 13 (0.95%) PMO
7 5 (0.36%) Data Quality
7 5 (0.36%) SLA
8 4 (0.29%) Def Stans
9 3 (0.22%) ISO 9001
10 2 (0.15%) ISO 14001
10 2 (0.15%) ISO/IEC 27001
10 2 (0.15%) Sarbanes-Oxley
11 1 (0.073%) Cyber Essentials
11 1 (0.073%) ECSS
11 1 (0.073%) GMP
11 1 (0.073%) ISO 9000
11 1 (0.073%) NIST
11 1 (0.073%) PCI DSS
System Software
1 5 (0.36%) VMware Infrastructure
2 4 (0.29%) Hyper-V
3 3 (0.22%) Active Directory
3 3 (0.22%) Embedded Firmware
3 3 (0.22%) Firmware
4 1 (0.073%) BitLocker
4 1 (0.073%) Microsoft App-V
4 1 (0.073%) Virtual Desktop
Systems Management
1 4 (0.29%) FortiGate
1 4 (0.29%) Terraform
2 2 (0.15%) Microsoft Intune
2 2 (0.15%) NetBackup
2 2 (0.15%) SCCM
3 1 (0.073%) Active Directory Federation Services
3 1 (0.073%) Backup Exec
3 1 (0.073%) Kubernetes
Vendors
1 59 (4.29%) IBM
2 52 (3.78%) Microsoft
3 19 (1.38%) HP
4 16 (1.16%) Cisco
5 9 (0.65%) Google
6 6 (0.44%) ANSYS
6 6 (0.44%) CheckPoint
6 6 (0.44%) SolarWinds
7 5 (0.36%) VMware
8 4 (0.29%) Agilent
8 4 (0.29%) Dell
8 4 (0.29%) Fortinet
8 4 (0.29%) Juniper
8 4 (0.29%) SAP
9 3 (0.22%) Databricks
9 3 (0.22%) EMC
10 2 (0.15%) McAfee
10 2 (0.15%) Red Hat
10 2 (0.15%) Siemens
10 2 (0.15%) Veritas