Atlassian Bamboo
UK

The following table provides summary statistics for permanent job vacancies with a requirement for Atlassian Bamboo skills. Included is a benchmarking guide to the salaries offered in vacancies that have cited Atlassian Bamboo over the 6 months to 27 April 2024 with a comparison to the same period in the previous 2 years.

6 months to
27 Apr 2024
Same period 2023 Same period 2022
Rank 851 627 741
Rank change year-on-year -224 +114 -209
Permanent jobs citing Atlassian Bamboo 45 372 534
As % of all permanent jobs advertised in the UK 0.046% 0.36% 0.35%
As % of the Development Applications category 0.47% 2.44% 1.56%
Number of salaries quoted 33 180 248
10th Percentile £49,000 £52,500 £48,750
25th Percentile £70,000 £62,188 £56,250
Median annual salary (50th Percentile) £80,000 £80,000 £70,000
Median % change year-on-year - +14.29% +3.70%
75th Percentile £87,500 £96,250 £97,500
90th Percentile £96,750 £107,500 £110,000
UK excluding London median annual salary £80,000 £62,500 £60,000
% change year-on-year +28.00% +4.17% +4.35%

All Development Application Skills
UK

Atlassian Bamboo is in the Development Applications category. The following table is for comparison with the above and provides summary statistics for all permanent job vacancies with a requirement for development application skills.

Permanent vacancies with a requirement for development application skills 9,547 15,237 34,312
As % of all permanent jobs advertised in the UK 9.74% 14.56% 22.26%
Number of salaries quoted 6,733 9,275 15,885
10th Percentile £36,250 £41,250 £37,500
25th Percentile £45,000 £50,000 £46,250
Median annual salary (50th Percentile) £60,000 £65,000 £62,500
Median % change year-on-year -7.69% +4.00% +9.65%
75th Percentile £77,500 £83,750 £80,000
90th Percentile £95,000 £100,000 £95,000
UK excluding London median annual salary £55,000 £57,500 £55,000
% change year-on-year -4.35% +4.55% +10.00%

Atlassian Bamboo
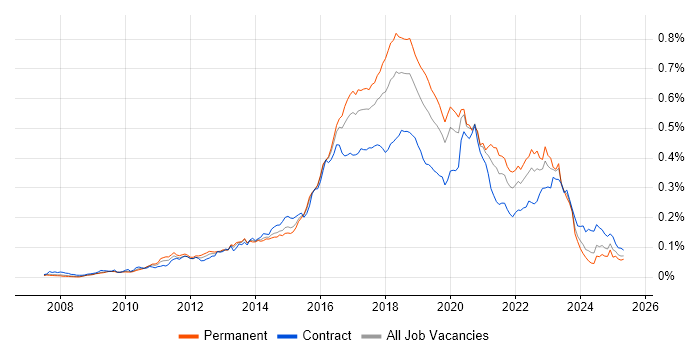
Job Vacancy Trend

Job postings citing Atlassian Bamboo as a proportion of all IT jobs advertised.

Job vacancy trend for Atlassian Bamboo in the UK

Atlassian Bamboo
Salary Trend

3-month moving average salary quoted in jobs citing Atlassian Bamboo.

Salary trend for Atlassian Bamboo in the UK

Atlassian Bamboo
Salary Histogram

Salary distribution for jobs citing Atlassian Bamboo over the 6 months to 27 April 2024.

Salary histogram for Atlassian Bamboo in the UK

Atlassian Bamboo
Top 9 Job Locations

The table below looks at the demand and provides a guide to the median salaries quoted in IT jobs citing Atlassian Bamboo within the UK over the 6 months to 27 April 2024. The 'Rank Change' column provides an indication of the change in demand within each location based on the same 6 month period last year.

Location Rank Change
on Same Period
Last Year
Matching
Permanent
IT Job Ads
Median Salary
Past 6 Months
Median Salary
% Change
on Same Period
Last Year
Live
Jobs
England -185 45 £80,000 - 26
London -88 23 £75,000 -11.76% 11
UK excluding London -40 22 £80,000 +28.00% 18
South West -13 18 £80,000 +6.67% 2
Work from Home -16 8 £85,000 +13.33% 18
North of England +43 4 £85,000 +21.43% 6
Yorkshire +92 3 £85,000 +38.78% 1
East of England - 3 £85,000 -
North West +7 1 £70,000 -3.45% 4

Atlassian Bamboo
Co-occurring Skills and Capabilities by Category

The follow tables expand on the table above by listing co-occurrences grouped by category. The same employment type, locality and period is covered with up to 20 co-occurrences shown in each of the following categories:

Application Platforms
1 17 (37.78%) Apache
1 17 (37.78%) Apache Spark
1 17 (37.78%) Jupyter
1 17 (37.78%) nginx
2 4 (8.89%) Confluence
3 1 (2.22%) IIS
3 1 (2.22%) Microsoft Exchange
3 1 (2.22%) Tornado
Business Applications
1 1 (2.22%) iTrent
1 1 (2.22%) SAP ERP
1 1 (2.22%) SAP S/4HANA
Cloud Services
1 18 (40.00%) OpenShift
2 17 (37.78%) Amazon S3
2 17 (37.78%) MinIO
3 8 (17.78%) AWS
3 8 (17.78%) Azure
4 4 (8.89%) Azure DevOps
5 2 (4.44%) Cloud Computing
5 2 (4.44%) GitHub
6 1 (2.22%) Azure Machine Learning
6 1 (2.22%) Microsoft 365
6 1 (2.22%) Power Platform
6 1 (2.22%) WhatsApp
Communications & Networking
1 2 (4.44%) DNS
2 1 (2.22%) DHCP
2 1 (2.22%) Firewall
2 1 (2.22%) FTP
2 1 (2.22%) SSL
2 1 (2.22%) TCP/IP
2 1 (2.22%) WAN
2 1 (2.22%) Wireless
Database & Business Intelligence
1 17 (37.78%) Big Data
1 17 (37.78%) Hadoop
1 17 (37.78%) Presto
2 1 (2.22%) Elasticsearch
2 1 (2.22%) Power BI
2 1 (2.22%) SAP Data Services
2 1 (2.22%) SQL Server
Development Applications
1 37 (82.22%) Jenkins
2 8 (17.78%) Bitbucket
2 8 (17.78%) Cypress.io
2 8 (17.78%) Selenium
2 8 (17.78%) WebDriver
3 5 (11.11%) TeamCity
4 4 (8.89%) JIRA
5 3 (6.67%) CircleCI
5 3 (6.67%) Git
5 3 (6.67%) Travis CI
6 1 (2.22%) Artifactory
6 1 (2.22%) Cucumber
6 1 (2.22%) GitLab
6 1 (2.22%) Maven
6 1 (2.22%) Mercurial
6 1 (2.22%) Octopus Deploy
6 1 (2.22%) SonarQube
6 1 (2.22%) Zephyr
General
1 12 (26.67%) Finance
2 8 (17.78%) Financial Institution
3 4 (8.89%) Public Sector
3 4 (8.89%) Social Skills
4 3 (6.67%) Organisational Skills
5 1 (2.22%) Banking
5 1 (2.22%) Inclusion and Diversity
5 1 (2.22%) Legal
Job Titles
1 20 (44.44%) DevOps Engineer
2 17 (37.78%) Big Data Engineer
2 17 (37.78%) Data Engineer
3 11 (24.44%) Lead
4 5 (11.11%) Software Engineer
5 4 (8.89%) Developer
5 4 (8.89%) Senior
6 3 (6.67%) Azure Engineer
6 3 (6.67%) Linux Engineer
6 3 (6.67%) Operations Engineer
6 3 (6.67%) Senior DevOps
6 3 (6.67%) Senior DevOps Engineer
7 2 (4.44%) Analyst
7 2 (4.44%) Java Developer
7 2 (4.44%) Java Engineer
7 2 (4.44%) Java Software Engineer
8 1 (2.22%) Analyst Developer
8 1 (2.22%) IT Support Engineer
8 1 (2.22%) Senior Analyst
8 1 (2.22%) Senior Analyst Developer
Libraries, Frameworks & Software Standards
1 18 (40.00%) Elastic Stack
1 18 (40.00%) YAML
2 17 (37.78%) ActiveMQ
2 17 (37.78%) Apache NiFi
2 17 (37.78%) RabbitMQ
3 10 (22.22%) REST
4 9 (20.00%) React
5 8 (17.78%) Apache Thrift
5 8 (17.78%) JSON
5 8 (17.78%) Web Services
6 6 (13.33%) Spring
7 5 (11.11%) .NET
8 4 (8.89%) HTML
8 4 (8.89%) Spring Boot
9 3 (6.67%) ADO
9 3 (6.67%) AngularJS
9 3 (6.67%) CSS
9 3 (6.67%) HTML5
10 2 (4.44%) Hibernate
10 2 (4.44%) RESTful
Miscellaneous
1 17 (37.78%) Hybrid Cloud
2 4 (8.89%) Public Cloud
3 3 (6.67%) Foreign Exchange (FX)
3 3 (6.67%) Linux Command Line
4 1 (2.22%) Client/Server
4 1 (2.22%) Cloud Native
4 1 (2.22%) Cyber Defence
4 1 (2.22%) Legacy Applications
4 1 (2.22%) Self-Motivation
Operating Systems
1 25 (55.56%) Linux
2 5 (11.11%) Windows
3 2 (4.44%) Windows Server
3 2 (4.44%) Windows Server 2016
3 2 (4.44%) Windows Server 2019
4 1 (2.22%) CentOS
4 1 (2.22%) Red Hat Enterprise Linux
4 1 (2.22%) Windows 10
4 1 (2.22%) Windows Server 2012
Processes & Methodologies
1 30 (66.67%) CI/CD
2 29 (64.44%) DevOps
3 20 (44.44%) Site Reliability Engineering
4 19 (42.22%) Infrastructure as Code
5 18 (40.00%) Containerisation
6 17 (37.78%) Agile
6 17 (37.78%) Data Engineering
6 17 (37.78%) Observability
6 17 (37.78%) Requirements Engineering
6 17 (37.78%) Service Delivery
6 17 (37.78%) Thought Leadership
7 12 (26.67%) Continuous Integration
8 9 (20.00%) Test Automation
9 8 (17.78%) E-Discovery
9 8 (17.78%) Information Governance
9 8 (17.78%) Mentoring
9 8 (17.78%) SDET
9 8 (17.78%) Software Engineering
9 8 (17.78%) Software Testing
9 8 (17.78%) Test Planning
Programming Languages
1 24 (53.33%) Python
2 20 (44.44%) Shell Script
3 19 (42.22%) Java
4 18 (40.00%) Bash
5 14 (31.11%) JavaScript
6 5 (11.11%) PowerShell
7 4 (8.89%) SQL
8 3 (6.67%) C#
8 3 (6.67%) Ruby
8 3 (6.67%) TypeScript
9 1 (2.22%) ABAP
9 1 (2.22%) C++
9 1 (2.22%) Perl
9 1 (2.22%) T-SQL
Qualifications
1 21 (46.67%) Security Cleared
2 20 (44.44%) DV Cleared
3 3 (6.67%) SC Cleared
4 2 (4.44%) Degree
5 1 (2.22%) MCSA
5 1 (2.22%) MCSE
5 1 (2.22%) Microsoft Certification
System Software
1 22 (48.89%) Docker
2 2 (4.44%) Active Directory
3 1 (2.22%) Hyper-V
3 1 (2.22%) Virtual Machines
3 1 (2.22%) VMware Infrastructure
Systems Management
1 25 (55.56%) Kubernetes
2 20 (44.44%) Ansible
2 20 (44.44%) Terraform
3 18 (40.00%) Grafana
4 17 (37.78%) HAProxy
4 17 (37.78%) Prometheus
5 5 (11.11%) Puppet
6 2 (4.44%) Progress Chef
7 1 (2.22%) Kibana
7 1 (2.22%) logstash
7 1 (2.22%) Salt
7 1 (2.22%) SCCM
Vendors
1 5 (11.11%) Microsoft
2 3 (6.67%) Atlassian
3 2 (4.44%) Red Hat
3 2 (4.44%) SAP
3 2 (4.44%) Splunk
4 1 (2.22%) Google
4 1 (2.22%) Oracle
4 1 (2.22%) Perforce
4 1 (2.22%) Sage
4 1 (2.22%) Salesforce
4 1 (2.22%) VMware
4 1 (2.22%) webMethods
4 1 (2.22%) Workday