Microsoft Internet Information Services (IIS)
UK

The table below provides summary statistics for permanent job vacancies requiring IIS skills. It includes a benchmarking guide to the annual salaries offered in vacancies that cited IIS over the 6 months leading up to 15 June 2025, comparing them to the same period in the previous two years.

6 months to
15 Jun 2025
Same period 2024 Same period 2023
Rank 573 515 521
Rank change year-on-year -58 +6 -28
Permanent jobs citing IIS 142 462 468
As % of all permanent jobs advertised in the UK 0.25% 0.42% 0.51%
As % of the Application Platforms category 3.11% 4.33% 4.59%
Number of salaries quoted 123 384 372
10th Percentile £33,750 £32,575 £32,500
25th Percentile £37,875 £40,000 £43,750
Median annual salary (50th Percentile) £49,000 £52,500 £55,000
Median % change year-on-year -6.67% -4.55% +18.28%
75th Percentile £62,063 £64,750 £67,125
90th Percentile £73,500 £75,000 £83,975
UK excluding London median annual salary £45,000 £52,500 £55,000
% change year-on-year -14.29% -4.55% +22.22%

All Application Platform Skills
UK

IIS falls under the Application Platforms category. For comparison with the information above, the following table provides summary statistics for all permanent job vacancies requiring application platform skills.

Permanent vacancies with a requirement for application platform skills 4,559 10,661 10,200
As % of all permanent jobs advertised in the UK 8.14% 9.65% 11.11%
Number of salaries quoted 2,868 7,121 7,214
10th Percentile £29,750 £27,500 £31,250
25th Percentile £37,250 £35,000 £40,000
Median annual salary (50th Percentile) £54,660 £50,000 £55,043
Median % change year-on-year +9.32% -9.16% +0.08%
75th Percentile £75,000 £70,500 £77,472
90th Percentile £109,125 £100,000 £95,000
UK excluding London median annual salary £45,000 £42,500 £49,000
% change year-on-year +5.88% -13.27% +6.52%

IIS
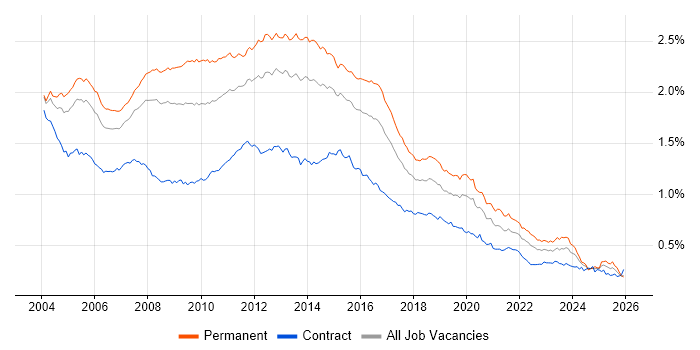
Job Vacancy Trend

Job postings citing IIS as a proportion of all IT jobs advertised.

Job vacancy trend for IIS in the UK

IIS
Salary Trend

3-month moving average salary quoted in jobs citing IIS.

Salary trend for IIS in the UK

IIS
Salary Histogram

Salary distribution for jobs citing IIS over the 6 months to 15 June 2025.

Salary histogram for IIS in the UK

IIS
Top 16 Job Locations

The table below looks at the demand and provides a guide to the median salaries quoted in IT jobs citing IIS within the UK over the 6 months to 15 June 2025. The 'Rank Change' column provides an indication of the change in demand within each location based on the same 6 month period last year.

Location Rank Change
on Same Period
Last Year
Matching
Permanent
IT Job Ads
Median Salary
Past 6 Months
Median Salary
% Change
on Same Period
Last Year
Live
Jobs
England -49 135 £49,000 -6.67% 151
UK excluding London +11 121 £45,000 -14.29% 108
Work from Home -35 80 £50,000 -16.67% 70
East of England +52 29 £42,000 +31.25% 8
South East +40 29 £60,000 +14.29% 41
North of England +31 28 £55,043 -8.26% 36
London +39 20 £49,000 -10.91% 59
North West -7 19 £55,043 -8.26% 25
Midlands -12 15 £50,000 - 13
South West +87 14 £40,000 -34.96% 4
East Midlands +24 9 £50,000 - 10
Yorkshire +50 8 £62,500 +19.05% 8
West Midlands +14 6 £27,500 -47.62% 2
Wales +46 4 £53,750 +8.59% 2
Scotland +98 2 £41,250 -14.95% 5
North East +50 1 £55,000 +57.14% 3

IIS
Co-occurring Skills and Capabilities by Category

The follow tables expand on the table above by listing co-occurrences grouped by category. The same employment type, locality and period is covered with up to 20 co-occurrences shown in each of the following categories:

Application Platforms
1 29 (20.42%) Microsoft Exchange
2 19 (13.38%) SharePoint
3 13 (9.15%) Apache
3 13 (9.15%) Tomcat
4 6 (4.23%) CMS
5 5 (3.52%) Umbraco
6 2 (1.41%) BizTalk Server
7 1 (0.70%) Apache Airflow
7 1 (0.70%) nginx
7 1 (0.70%) Office Communications Server
7 1 (0.70%) Oracle HTTP Server
7 1 (0.70%) WebLogic
Applications
1 14 (9.86%) Microsoft Office
2 1 (0.70%) Adobe Illustrator
2 1 (0.70%) Photoshop
Business Applications
1 2 (1.41%) Dynamics CRM
2 1 (0.70%) iTrent
2 1 (0.70%) Magento
2 1 (0.70%) Oracle Payables
Cloud Services
1 67 (47.18%) Azure
2 48 (33.80%) Microsoft 365
3 39 (27.46%) AWS
4 22 (15.49%) SaaS
5 19 (13.38%) GitHub
6 18 (12.68%) Entra ID
7 12 (8.45%) Cloudflare
8 9 (6.34%) Microsoft Copilot
8 9 (6.34%) Power Automate
9 7 (4.93%) Power Platform
10 5 (3.52%) Azure DevOps
10 5 (3.52%) IaaS
10 5 (3.52%) Nutanix
10 5 (3.52%) PaaS
11 4 (2.82%) Firebase
11 4 (2.82%) Mimecast
12 3 (2.11%) Google Workspace
12 3 (2.11%) npm
12 3 (2.11%) OpenShift
12 3 (2.11%) Sage Pay
Communications & Networking
1 56 (39.44%) DNS
2 40 (28.17%) DHCP
3 39 (27.46%) Firewall
4 16 (11.27%) TCP/IP
5 15 (10.56%) VPN
6 12 (8.45%) VLAN
7 11 (7.75%) VoIP
8 10 (7.04%) ADSL
8 10 (7.04%) SSL
9 9 (6.34%) DMARC
10 8 (5.63%) FTP
11 7 (4.93%) SAN
12 6 (4.23%) Remote Desktop
13 4 (2.82%) SMTP
14 3 (2.11%) Cisco ASA
15 2 (1.41%) DMZ
15 2 (1.41%) HTTP
15 2 (1.41%) Internet
15 2 (1.41%) NAS
15 2 (1.41%) Wi-Fi
Database & Business Intelligence
1 104 (73.24%) SQL Server
2 13 (9.15%) Data Hub
2 13 (9.15%) SQL CLR
3 11 (7.75%) Elasticsearch
3 11 (7.75%) MySQL
3 11 (7.75%) PostgreSQL
4 10 (7.04%) Amazon RDS
5 8 (5.63%) GIS
6 7 (4.93%) Power BI
7 6 (4.23%) Relational Database
8 3 (2.11%) NoSQL
9 2 (1.41%) Azure SQL Database
10 1 (0.70%) DB2
10 1 (0.70%) Oracle Database
10 1 (0.70%) Redis
Development Applications
1 24 (16.90%) Git
2 11 (7.75%) Jasmine
2 11 (7.75%) TeamCity
3 10 (7.04%) NUnit
4 9 (6.34%) SQL Server Management Studio (SSMS)
5 5 (3.52%) JIRA
5 5 (3.52%) Octopus Deploy
6 3 (2.11%) Bitbucket
6 3 (2.11%) JMeter
6 3 (2.11%) Visual Studio
6 3 (2.11%) Visual Studio Code
6 3 (2.11%) Vite
7 1 (0.70%) Karma Test Runner
7 1 (0.70%) Log4Net
7 1 (0.70%) Team Foundation Server
General
1 60 (42.25%) Social Skills
2 26 (18.31%) Finance
3 24 (16.90%) Back Office
4 15 (10.56%) Local Government
5 10 (7.04%) Advertising
6 9 (6.34%) Czech Language
6 9 (6.34%) Games
6 9 (6.34%) Organisational Skills
6 9 (6.34%) Presentation Skills
7 8 (5.63%) Retail
8 5 (3.52%) Analytical Skills
8 5 (3.52%) Public Sector
9 3 (2.11%) Inclusion and Diversity
10 2 (1.41%) Influencing Skills
10 2 (1.41%) Marketing
11 1 (0.70%) Documentation Skills
11 1 (0.70%) Fire and Rescue
11 1 (0.70%) Law
11 1 (0.70%) Legal
11 1 (0.70%) Telecoms
Job Titles
1 29 (20.42%) Developer
2 27 (19.01%) Senior
3 24 (16.90%) Analyst
4 20 (14.08%) IT Support
5 19 (13.38%) Full-Stack Developer
5 19 (13.38%) Infrastructure Engineer
6 18 (12.68%) Support Analyst
7 17 (11.97%) 3rd Line Support
7 17 (11.97%) Applications Support
7 17 (11.97%) Support Engineer
8 15 (10.56%) .NET Developer
9 13 (9.15%) Head of Development
10 11 (7.75%) Administrator
10 11 (7.75%) Full-Stack .NET Developer
11 10 (7.04%) 3rd Line Support Analyst
11 10 (7.04%) IT Analyst
11 10 (7.04%) IT Support Analyst
11 10 (7.04%) Senior Developer
11 10 (7.04%) Senior Full-Stack Developer
12 9 (6.34%) IT Administrator
Libraries, Frameworks & Software Standards
1 55 (38.73%) .NET
2 27 (19.01%) .NET Core
2 27 (19.01%) HTML
3 26 (18.31%) CSS
4 24 (16.90%) ASP.NET
5 21 (14.79%) .NET Framework
6 18 (12.68%) JSON
7 17 (11.97%) XML
8 14 (9.86%) AngularJS
8 14 (9.86%) HTML5
9 13 (9.15%) Dapper ORM
9 13 (9.15%) Entity Framework
10 12 (8.45%) React
10 12 (8.45%) REST
11 11 (7.75%) ASP.NET Core
11 11 (7.75%) CSS3
11 11 (7.75%) Vue
12 10 (7.04%) Jest
12 10 (7.04%) RESTful
12 10 (7.04%) SOAP
Miscellaneous
1 17 (11.97%) Private Cloud
2 15 (10.56%) Self-Motivation
3 14 (9.86%) Management Information System
4 13 (9.15%) Enterprise Software
4 13 (9.15%) Team-Oriented Environment
5 9 (6.34%) Client/Server
5 9 (6.34%) Mobile App
6 7 (4.93%) Data Centre
7 6 (4.23%) Onboarding
8 5 (3.52%) Clustering
8 5 (3.52%) Public Cloud
9 4 (2.82%) Online Games
9 4 (2.82%) PKI
10 3 (2.11%) Enterprise Cloud
11 2 (1.41%) 3D Graphics
11 2 (1.41%) Analytical Mindset
11 2 (1.41%) N-Tier
11 2 (1.41%) Robotics
12 1 (0.70%) Hedge funds
12 1 (0.70%) W3C
Operating Systems
1 95 (66.90%) Windows
2 72 (50.70%) Windows Server
3 38 (26.76%) Linux
4 13 (9.15%) Unix
5 10 (7.04%) Windows 10
6 5 (3.52%) Windows Server 2016
7 4 (2.82%) CentOS
8 3 (2.11%) Windows Server 2012
9 2 (1.41%) Mac OS
9 2 (1.41%) Solaris
10 1 (0.70%) Android
10 1 (0.70%) Debian
10 1 (0.70%) Ubuntu
10 1 (0.70%) VMS
10 1 (0.70%) Windows 7
10 1 (0.70%) Windows Server 2008
10 1 (0.70%) Windows Server 2019
Processes & Methodologies
1 50 (35.21%) Problem-Solving
2 44 (30.99%) Agile
3 41 (28.87%) ITIL
4 34 (23.94%) Full-Stack Development
4 34 (23.94%) Infrastructure Engineering
5 23 (16.20%) High Availability
5 23 (16.20%) Project Management
6 22 (15.49%) Data Privacy
7 20 (14.08%) MVC
8 19 (13.38%) CI/CD
8 19 (13.38%) Collaborative Culture
8 19 (13.38%) Customer Service
8 19 (13.38%) Project Delivery
9 18 (12.68%) Continuous Improvement
9 18 (12.68%) DevOps
9 18 (12.68%) Software Engineering
10 17 (11.97%) Cybersecurity
11 15 (10.56%) Disaster Recovery
11 15 (10.56%) Roadmaps
12 14 (9.86%) Clean Code
Programming Languages
1 74 (52.11%) SQL
2 47 (33.10%) PowerShell
3 43 (30.28%) C#
4 38 (26.76%) JavaScript
5 12 (8.45%) Java
5 12 (8.45%) TypeScript
6 9 (6.34%) Python
6 9 (6.34%) VBA
7 8 (5.63%) T-SQL
8 6 (4.23%) Bash
9 4 (2.82%) Bicep
9 4 (2.82%) PHP
10 3 (2.11%) VB.NET
11 2 (1.41%) VB
12 1 (0.70%) VB6
Qualifications
1 21 (14.79%) Degree
2 9 (6.34%) Computer Science Degree
3 6 (4.23%) A+ Certification
3 6 (4.23%) ITIL Certification
3 6 (4.23%) Network+ Certification
4 5 (3.52%) Microsoft Certification
5 4 (2.82%) Azure Certification
6 3 (2.11%) DV Cleared
6 3 (2.11%) Security Cleared
7 2 (1.41%) CISM
7 2 (1.41%) CISSP
7 2 (1.41%) CompTIA Security+
7 2 (1.41%) PMP
7 2 (1.41%) TOGAF Certification
8 1 (0.70%) DBS Check
Quality Assurance & Compliance
1 14 (9.86%) ISO/IEC 27001
2 7 (4.93%) SLA
3 4 (2.82%) Accessibility
4 3 (2.11%) Cyber Essentials
4 3 (2.11%) NIST
5 2 (1.41%) NCSC
5 2 (1.41%) PCI DSS
6 1 (0.70%) Cyber Essentials PLUS
6 1 (0.70%) GDPR
6 1 (0.70%) QA
System Software
1 63 (44.37%) Active Directory
2 33 (23.24%) VMware Infrastructure
3 16 (11.27%) Hyper-V
4 10 (7.04%) vSphere
5 7 (4.93%) Docker
6 6 (4.23%) Terminal Services
7 3 (2.11%) Virtual Machines
7 3 (2.11%) VMware ESXi
8 2 (1.41%) VMware NSX
9 1 (0.70%) BitLocker
9 1 (0.70%) Forefront TMG
9 1 (0.70%) ISA Server
9 1 (0.70%) LXC
9 1 (0.70%) Samba
Systems Management
1 31 (21.83%) Microsoft Intune
2 20 (14.08%) Terraform
3 15 (10.56%) Ansible
4 10 (7.04%) Single Sign-On
5 9 (6.34%) Active Directory Federation Services
5 9 (6.34%) SCCM
6 8 (5.63%) Kubernetes
7 5 (3.52%) ZABBIX
8 2 (1.41%) Microsoft Clustering
8 2 (1.41%) SCOM
9 1 (0.70%) Failover Clustering
9 1 (0.70%) Grafana
9 1 (0.70%) HAProxy
9 1 (0.70%) Progress Chef
9 1 (0.70%) Prometheus
9 1 (0.70%) Proxmox
9 1 (0.70%) WMI
Vendors
1 93 (65.49%) Microsoft
2 44 (30.99%) VMware
3 23 (16.20%) Oracle
4 16 (11.27%) Cisco
5 10 (7.04%) Dell
5 10 (7.04%) Rollbar
6 8 (5.63%) HP
6 8 (5.63%) NetApp
7 7 (4.93%) SolarWinds
8 4 (2.82%) Red Hat
8 4 (2.82%) Veeam
9 3 (2.11%) CheckPoint
9 3 (2.11%) Okta
9 3 (2.11%) Palo Alto
9 3 (2.11%) Salesforce
10 2 (1.41%) Adobe
10 2 (1.41%) Fortinet
10 2 (1.41%) Guidewire
11 1 (0.70%) IBM
11 1 (0.70%) Sophos