DevSecOps
UK

The following table provides summary statistics for permanent job vacancies with a requirement for DevSecOps skills. Included is a benchmarking guide to the salaries offered in vacancies that have cited DevSecOps over the 6 months to 4 December 2023 with a comparison to the same period in the previous 2 years.

6 months to
4 Dec 2023
Same period 2022 Same period 2021
Rank 280 340 428
Rank change year-on-year +60 +88 +60
Permanent jobs citing DevSecOps 628 1,225 1,007
As % of all permanent jobs advertised in the UK 1.18% 0.99% 0.79%
As % of the Processes & Methodologies category 1.25% 1.03% 0.82%
Number of salaries quoted 357 562 614
10th Percentile £55,000 £50,000 £55,000
25th Percentile £63,750 £61,250 £62,500
Median annual salary (50th Percentile) £80,000 £80,000 £77,500
Median % change year-on-year - +3.23% -1.90%
75th Percentile £97,500 £103,438 £93,750
90th Percentile £115,000 £120,000 £107,850
UK excluding London median annual salary £70,000 £70,000 £70,000
% change year-on-year - - +3.70%

All Process and Methodology Skills
UK

DevSecOps is in the Processes and Methodologies category. The following table is for comparison with the above and provides summary statistics for all permanent job vacancies with a requirement for process or methodology skills.

Permanent vacancies with a requirement for process or methodology skills 50,088 118,671 122,416
As % of all permanent jobs advertised in the UK 94.09% 95.74% 95.45%
Number of salaries quoted 36,209 72,079 81,851
10th Percentile £32,500 £34,492 £32,500
25th Percentile £43,750 £45,000 £42,500
Median annual salary (50th Percentile) £60,000 £60,000 £60,000
Median % change year-on-year - - +9.09%
75th Percentile £80,000 £82,000 £77,500
90th Percentile £99,025 £100,000 £95,000
UK excluding London median annual salary £52,500 £53,219 £50,000
% change year-on-year -1.35% +6.44% +4.17%

DevSecOps
Job Vacancy Trend

Job postings citing DevSecOps as a proportion of all IT jobs advertised.
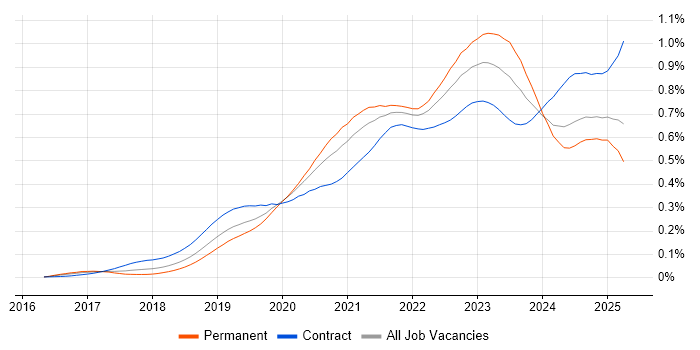
Job vacancy trend for DevSecOps in the UK

DevSecOps
Salary Trend

3-month moving average salary quoted in jobs citing DevSecOps.

Salary trend for DevSecOps in the UK

DevSecOps
Salary Histogram

Salary distribution for jobs citing DevSecOps over the 6 months to 4 December 2023.

Salary histogram for DevSecOps in the UK

DevSecOps
Top 17 Job Locations

The table below looks at the demand and provides a guide to the median salaries quoted in IT jobs citing DevSecOps within the UK over the 6 months to 4 December 2023. The 'Rank Change' column provides an indication of the change in demand within each location based on the same 6 month period last year.

Location Rank Change
on Same Period
Last Year
Matching
Permanent
IT Job Ads
Median Salary
Past 6 Months
Median Salary
% Change
on Same Period
Last Year
Live
Jobs
England +64 563 £82,500 +3.13% 140
Work from Home +127 348 £82,500 +6.45% 72
UK excluding London +107 306 £70,000 - 70
London +39 258 £90,000 +2.86% 79
South West +110 86 £60,000 -20.00% 10
South East +117 73 £78,750 +16.67% 26
North of England +69 71 £73,900 +23.17% 19
Midlands +97 42 £62,500 -7.41% 1
North West +44 42 £72,500 +28.32% 15
Yorkshire +69 28 £85,000 +21.43% 4
West Midlands +107 21 £95,000 +40.74% 1
East Midlands +41 21 £60,000 -15.79%
Scotland +39 18 £96,627 +13.68% 4
East of England +106 11 £85,000 +3.03% 13
Northern Ireland +35 8 £70,000 -17.65%
Wales +19 3 £85,000 -17.07%
North East +48 1 £70,000 -31.71%

DevSecOps
Co-occurring Skills and Capabilities by Category

The follow tables expand on the table above by listing co-occurrences grouped by category. The same employment type, locality and period is covered with up to 20 co-occurrences shown in each of the following categories:

Application Platforms
1 64 (10.19%) Confluence
2 16 (2.55%) SharePoint
3 6 (0.96%) CMS
4 2 (0.32%) Adobe Experience Manager
4 2 (0.32%) Appian
4 2 (0.32%) ArcGIS
4 2 (0.32%) Liferay
4 2 (0.32%) nginx
4 2 (0.32%) Oracle SOA Suite
4 2 (0.32%) Oracle Workflow
5 1 (0.16%) Anypoint
5 1 (0.16%) Apache
5 1 (0.16%) Apache Airflow
5 1 (0.16%) Apache Spark
5 1 (0.16%) BizTalk Server
5 1 (0.16%) Ethereum
5 1 (0.16%) IBM Domino
5 1 (0.16%) JBoss
5 1 (0.16%) Tomcat
Applications
1 1 (0.16%) Chatbot
1 1 (0.16%) MS Visio
Business Applications
1 1 (0.16%) Teamcenter
Cloud Services
1 334 (53.18%) AWS
2 315 (50.16%) Azure
3 111 (17.68%) GCP
4 89 (14.17%) PaaS
5 85 (13.54%) SaaS
6 77 (12.26%) IaaS
6 77 (12.26%) Serverless
7 76 (12.10%) Azure DevOps
8 64 (10.19%) AWS CloudFormation
9 63 (10.03%) GitHub
10 47 (7.48%) AWS Lambda
11 29 (4.62%) Cloud Computing
12 23 (3.66%) OpenShift
13 20 (3.18%) Azure Monitor
14 15 (2.39%) Amazon CloudWatch
15 13 (2.07%) Amazon Cognito
15 13 (2.07%) GitHub Actions
16 12 (1.91%) AWS CodeBuild
16 12 (1.91%) Azure Sentinel
16 12 (1.91%) Entra ID
Communications & Networking
1 69 (10.99%) Firewall
2 54 (8.60%) TCP/IP
3 47 (7.48%) HTTP
4 42 (6.69%) DNS
5 40 (6.37%) VPN
6 30 (4.78%) IPv4
7 29 (4.62%) DHCP
8 28 (4.46%) F5 BIG-IP GTM
8 28 (4.46%) F5 BIG-IP LTM
9 20 (3.18%) VLAN
10 19 (3.03%) Internet
11 18 (2.87%) Network Security
12 17 (2.71%) LAN
12 17 (2.71%) WAN
13 16 (2.55%) OSPF
14 15 (2.39%) Intrusion Detection
15 8 (1.27%) SSL
16 6 (0.96%) NGFW
17 5 (0.80%) HTTPS
17 5 (0.80%) Kerberos
Database & Business Intelligence
1 35 (5.57%) MongoDB
2 33 (5.25%) Metadata
3 31 (4.94%) Elasticsearch
3 31 (4.94%) Hadoop
4 27 (4.30%) DynamoDB
5 13 (2.07%) Big Data
5 13 (2.07%) Redis
5 13 (2.07%) SQL Server
6 12 (1.91%) Amazon Athena
6 12 (1.91%) Data Lake
7 11 (1.75%) NoSQL
8 8 (1.27%) Apache Accumulo
9 6 (0.96%) MySQL
9 6 (0.96%) PostgreSQL
10 5 (0.80%) BigQuery
10 5 (0.80%) Data Warehouse
11 2 (0.32%) Geospatial Data
11 2 (0.32%) GIS
12 1 (0.16%) Amazon RDS
12 1 (0.16%) InterSystems Cache
Development Applications
1 82 (13.06%) Jenkins
2 79 (12.58%) JIRA
3 57 (9.08%) Git
4 37 (5.89%) GitLab
5 18 (2.87%) CircleCI
5 18 (2.87%) TeamCity
6 17 (2.71%) git-flow
7 14 (2.23%) Bitbucket
8 13 (2.07%) Selenium
9 12 (1.91%) Octopus Deploy
10 10 (1.59%) SonarQube
11 8 (1.27%) JMeter
11 8 (1.27%) SoapUI
11 8 (1.27%) TestLink
12 5 (0.80%) Atlassian Bamboo
12 5 (0.80%) InstallShield
12 5 (0.80%) Sonatype Nexus
13 2 (0.32%) Artifactory
13 2 (0.32%) Burp Suite
13 2 (0.32%) Gradle
General
1 224 (35.67%) Finance
2 176 (28.03%) Social Skills
3 115 (18.31%) Inclusion and Diversity
4 64 (10.19%) Retail
5 51 (8.12%) Analytical Skills
5 51 (8.12%) Banking
6 23 (3.66%) Public Sector
7 14 (2.23%) Aerospace
7 14 (2.23%) Law
8 12 (1.91%) Publishing
9 11 (1.75%) Influencing Skills
10 9 (1.43%) Legal
11 7 (1.11%) Health Technology
12 4 (0.64%) Aviation
12 4 (0.64%) Games
12 4 (0.64%) Organisational Skills
12 4 (0.64%) Telecoms
13 3 (0.48%) Tech for Good
14 2 (0.32%) Documentation Skills
14 2 (0.32%) Presentation Skills
Job Titles
1 152 (24.20%) DevOps Engineer
2 136 (21.66%) Architect
3 128 (20.38%) Senior
4 79 (12.58%) Lead
5 70 (11.15%) DevSecOps Engineer
6 56 (8.92%) Cloud Engineer
7 53 (8.44%) Solutions Architect
8 50 (7.96%) Security Engineer
9 41 (6.53%) Cloud Architect
10 36 (5.73%) Senior DevOps
10 36 (5.73%) Senior DevOps Engineer
11 31 (4.94%) Developer
12 29 (4.62%) Infrastructure Architect
13 28 (4.46%) Cisco Engineer
13 28 (4.46%) Senior Cisco Engineer
14 22 (3.50%) Software Engineer
15 18 (2.87%) Security Manager
16 17 (2.71%) Senior Manager
17 16 (2.55%) Azure Engineer
18 15 (2.39%) Azure Architect
Libraries, Frameworks & Software Standards
1 62 (9.87%) HTML
2 48 (7.64%) .NET
2 48 (7.64%) React
3 43 (6.85%) REST
4 31 (4.94%) OpenID
4 31 (4.94%) SAML
5 28 (4.46%) Spine.js
6 26 (4.14%) Kafka
7 25 (3.98%) JSON
8 24 (3.82%) YAML
9 23 (3.66%) GraphQL
10 17 (2.71%) Node.js
11 13 (2.07%) Flutter
12 12 (1.91%) RESTful
12 12 (1.91%) Spring Boot
13 11 (1.75%) Spring
14 10 (1.59%) CSS
14 10 (1.59%) Spring Integration
15 9 (1.43%) Spring Cloud
15 9 (1.43%) Spring Security
Miscellaneous
1 115 (18.31%) Cloud Native
2 84 (13.38%) Public Cloud
3 59 (9.39%) Cyberattack
4 51 (8.12%) Data Centre
5 46 (7.32%) Product Ownership
6 30 (4.78%) Mobile App
7 22 (3.50%) Hybrid Cloud
8 19 (3.03%) Management Information System
9 17 (2.71%) PKI
10 16 (2.55%) Virtual Team
11 12 (1.91%) Enterprise Software
11 12 (1.91%) Security Posture
12 11 (1.75%) Distributed Systems
12 11 (1.75%) Mainframe
12 11 (1.75%) Replication
13 10 (1.59%) Blog
13 10 (1.59%) Legacy Systems
14 9 (1.43%) Data Structures
15 7 (1.11%) Data Protection Act
16 6 (0.96%) Distributed Architecture
Operating Systems
1 173 (27.55%) Linux
2 103 (16.40%) Windows
3 29 (4.62%) Ubuntu
3 29 (4.62%) VMS
4 21 (3.34%) Unix
5 17 (2.71%) Red Hat Enterprise Linux
5 17 (2.71%) Solaris
6 11 (1.75%) HPUX
7 10 (1.59%) Android
7 10 (1.59%) Apple iOS
8 8 (1.27%) Windows Server
9 3 (0.48%) Mac OS
Processes & Methodologies
1 367 (58.44%) Agile
2 349 (55.57%) DevOps
3 252 (40.13%) Infrastructure as Code
4 245 (39.01%) CI/CD
5 126 (20.06%) Cloud Security
6 108 (17.20%) Containerisation
7 98 (15.61%) Roadmaps
8 84 (13.38%) Software Engineering
9 82 (13.06%) Continuous Integration
10 81 (12.90%) Configuration Management
11 79 (12.58%) Mentoring
12 77 (12.26%) Cybersecurity
13 75 (11.94%) Actionable Insight
13 75 (11.94%) SDLC
14 73 (11.62%) Microservices
15 72 (11.46%) Scrum
16 60 (9.55%) Test Automation
17 59 (9.39%) Scaled Agile Framework
18 57 (9.08%) Design Patterns
18 57 (9.08%) Kanban
Programming Languages
1 238 (37.90%) Python
2 149 (23.73%) Bash
3 123 (19.59%) PowerShell
4 77 (12.26%) Java
5 67 (10.67%) C#
6 40 (6.37%) JavaScript
7 26 (4.14%) Go
8 21 (3.34%) Ruby
9 17 (2.71%) Shell Script
10 16 (2.55%) Kusto Query Language
11 13 (2.07%) C++
12 12 (1.91%) SQL
13 11 (1.75%) TypeScript
14 9 (1.43%) Search Processing Language
15 7 (1.11%) Bicep
15 7 (1.11%) PHP
16 4 (0.64%) C
17 3 (0.48%) Rust
18 1 (0.16%) Groovy
18 1 (0.16%) Kotlin
Qualifications
1 157 (25.00%) Security Cleared
2 86 (13.69%) DV Cleared
3 56 (8.92%) Degree
4 55 (8.76%) AWS Certification
5 35 (5.57%) SC Cleared
6 31 (4.94%) AWS Certified Solutions Architect
7 30 (4.78%) CISSP
8 26 (4.14%) Computer Science Degree
9 18 (2.87%) Azure Certification
10 16 (2.55%) BPSS Clearance
11 12 (1.91%) (ISC)2 CCSP
11 12 (1.91%) Cisco Certification
12 10 (1.59%) CCSP
12 10 (1.59%) Master's Degree
13 8 (1.27%) GIAC
13 8 (1.27%) GSEC
13 8 (1.27%) RHCE
14 7 (1.11%) CEH
14 7 (1.11%) OSCP
15 6 (0.96%) CISM
Quality Assurance & Compliance
1 33 (5.25%) ISO/IEC 27001
2 21 (3.34%) PCI DSS
3 20 (3.18%) QA
4 18 (2.87%) NIST
5 13 (2.07%) GDPR
6 12 (1.91%) Data Quality
7 10 (1.59%) NCSC
8 7 (1.11%) Accessibility
9 6 (0.96%) ISO 9000
10 3 (0.48%) California Consumer Privacy Act
10 3 (0.48%) ISO 20022
11 2 (0.32%) HIPAA
11 2 (0.32%) Sarbanes-Oxley
11 2 (0.32%) SOC 2
12 1 (0.16%) GLBA
12 1 (0.16%) ISO 31000
12 1 (0.16%) ISO/IEC 27002 (supersedes ISO/IEC 17799)
12 1 (0.16%) ISO/IEC 27005
12 1 (0.16%) NIST 800
12 1 (0.16%) RMADS
System Software
1 152 (24.20%) Docker
2 69 (10.99%) Active Directory
3 12 (1.91%) Virtual Machines
4 7 (1.11%) VMware Infrastructure
5 3 (0.48%) IAG
6 2 (0.32%) Ceph
6 2 (0.32%) NFS
6 2 (0.32%) Virtual Servers
7 1 (0.16%) HDFS
7 1 (0.16%) Hyper-V
Systems Management
1 284 (45.22%) Terraform
2 215 (34.24%) Kubernetes
3 187 (29.78%) Ansible
4 48 (7.64%) Puppet
5 14 (2.23%) Progress Chef
6 10 (1.59%) Single Sign-On
7 6 (0.96%) CSIRT
8 5 (0.80%) Grafana
9 4 (0.64%) HP Fortify
10 3 (0.48%) Hadoop YARN
10 3 (0.48%) Istio
10 3 (0.48%) Prometheus
11 2 (0.32%) linkerd
11 2 (0.32%) Mesos
11 2 (0.32%) Podman
12 1 (0.16%) Apache Ranger
12 1 (0.16%) Argo
12 1 (0.16%) Nessus
12 1 (0.16%) Packer
12 1 (0.16%) Rancher
Vendors
1 103 (16.40%) Microsoft
2 77 (12.26%) Oracle
3 43 (6.85%) Google
4 31 (4.94%) F5
5 29 (4.62%) Cisco
5 29 (4.62%) Fortinet
6 28 (4.46%) CheckPoint
6 28 (4.46%) ServiceNow
7 19 (3.03%) Red Hat
8 15 (2.39%) New Relic
9 14 (2.23%) Splunk
10 13 (2.07%) IBM
11 12 (1.91%) AppDynamics
11 12 (1.91%) Atlassian
12 11 (1.75%) Confluent
12 11 (1.75%) HP
12 11 (1.75%) Sun
12 11 (1.75%) Unisys
13 10 (1.59%) Okta
13 10 (1.59%) Palo Alto