Public Sector Contracts in London

Public Sector
England > London

The table below looks at the prevalence of the term Public Sector in contract job vacancies in London. Included is a benchmarking guide to the contractor rates offered in vacancies that cited Public Sector over the 6 months leading up to 20 May 2025, comparing them to the same period in the previous two years.

6 months to
20 May 2025
Same period 2024 Same period 2023
Rank 26 19 27
Rank change year-on-year -7 +8 +18
Contract jobs citing Public Sector 953 1,490 1,790
As % of all contract jobs advertised in London 7.69% 8.53% 6.88%
As % of the General category 11.37% 13.53% 10.87%
Number of daily rates quoted 690 1,053 1,307
10th Percentile £400 £371 £363
25th Percentile £451 £443 £463
Median daily rate (50th Percentile) £525 £525 £563
Median % change year-on-year - -6.67% +7.14%
75th Percentile £612 £650 £675
90th Percentile £738 £743 £743
England median daily rate £525 £525 £538
% change year-on-year - -2.33% +5.39%
Number of hourly rates quoted 19 14 16
10th Percentile £21.60 £15.00 £18.58
25th Percentile £22.14 £15.66 £20.32
Median hourly rate £25.08 £18.13 £25.00
Median % change year-on-year +38.31% -27.48% -2.65%
75th Percentile £56.25 £25.73 £43.86
90th Percentile £72.25 £65.90 £63.38
England median hourly rate £24.50 £21.50 £20.64
% change year-on-year +13.95% +4.17% +3.20%

All General Skills
London

Public Sector falls under the General Skills category. For comparison with the information above, the following table provides summary statistics for all contract job vacancies requiring common skills in London.

Contract vacancies with a requirement for common skills 8,385 11,011 16,464
As % of all contract IT jobs advertised in London 67.67% 63.02% 63.26%
Number of daily rates quoted 5,619 7,859 11,938
10th Percentile £349 £336 £380
25th Percentile £440 £450 £481
Median daily rate (50th Percentile) £565 £575 £600
Median % change year-on-year -1.74% -4.17% +4.35%
75th Percentile £713 £700 £725
90th Percentile £825 £825 £825
England median daily rate £525 £538 £550
% change year-on-year -2.33% -2.27% -
Number of hourly rates quoted 145 233 211
10th Percentile £15.84 £15.60 £16.61
25th Percentile £23.80 £18.13 £21.00
Median hourly rate £34.00 £28.00 £30.00
Median % change year-on-year +21.43% -6.67% -20.00%
75th Percentile £50.75 £44.75 £53.36
90th Percentile £65.00 £65.00 £70.00
England median hourly rate £27.50 £30.14 £32.15
% change year-on-year -8.76% -6.25% +47.38%

Public Sector
Job Vacancy Trend in London

Job postings citing Public Sector as a proportion of all IT jobs advertised in London.
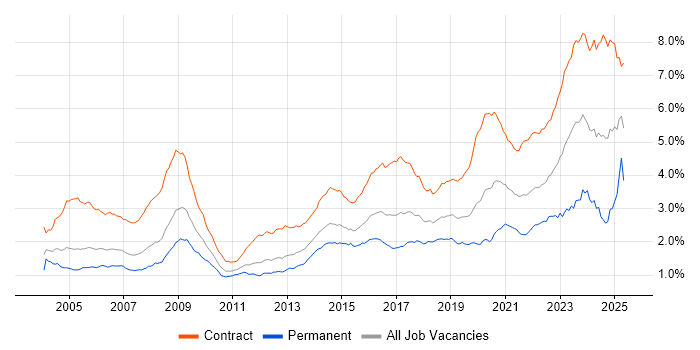
Job vacancy trend for Public Sector in London

Public Sector
Contractor Daily Rate Trend in London

3-month moving average daily rate quoted in jobs citing Public Sector in London.

Daily rate trend for Public Sector in London

Public Sector
Daily Rate Histogram in London

Daily rate distribution for jobs citing Public Sector in London over the 6 months to 20 May 2025.

Daily rate histogram for Public Sector in London

Public Sector
Contractor Hourly Rate Trend in London

3-month moving average hourly rates quoted in jobs citing Public Sector in London.

Hourly rate trend for Public Sector in London

Public Sector
Hourly Rate Histogram in London

Hourly rate distribution of jobs citing Public Sector in London over the 6 months to 20 May 2025.

Hourly rate histogram for Public Sector in London

Public Sector
Contract Job Locations in London

The table below looks at the demand and provides a guide to the median contractor rates quoted in IT jobs citing Public Sector within the London region over the 6 months to 20 May 2025. The 'Rank Change' column provides an indication of the change in demand within each location based on the same 6 month period last year.

Location Rank Change
on Same Period
Last Year
Matching
Contract
IT Job Ads
Median
Daily Rate
Past 6 Months
Median Daily Rate
% Change
on Same Period
Last Year
Live
Jobs
Central London -2 138 £525 +5.00% 59
South London +2 38 £495 +1.54% 14
West London +7 14 £400 +14.29% 18
East London +10 10 £588 +6.82% 4
North London +2 6 £500 +63.93% 3
Public Sector
England

Public Sector
Co-occurring Skills and Capabilities in London by Category

The follow tables expand on the table above by listing co-occurrences grouped by category. The same employment type, locality and period is covered with up to 20 co-occurrences shown in each of the following categories:

Application Platforms
1 22 (2.31%) Confluence
2 20 (2.10%) SharePoint
3 19 (1.99%) Microsoft Exchange
4 10 (1.05%) Apache
5 8 (0.84%) Apache Airflow
6 7 (0.73%) Apache Spark
6 7 (0.73%) ArcGIS
6 7 (0.73%) Jupyter
7 6 (0.63%) CMS
8 3 (0.31%) Anypoint
8 3 (0.31%) Camunda
8 3 (0.31%) Drupal
8 3 (0.31%) nginx
9 2 (0.21%) Oracle Workflow
9 2 (0.21%) Umbraco
10 1 (0.10%) Alfresco
10 1 (0.10%) JBoss
10 1 (0.10%) Tomcat
10 1 (0.10%) WebLogic
10 1 (0.10%) WebSphere
Applications
1 21 (2.20%) Microsoft Office
2 10 (1.05%) Microsoft Excel
3 6 (0.63%) Microsoft PowerPoint
3 6 (0.63%) Sketch
4 5 (0.52%) Oracle Smart View
5 4 (0.42%) Microsoft Project
6 3 (0.31%) MS Visio
6 3 (0.31%) Trello
7 2 (0.21%) Adobe Illustrator
7 2 (0.21%) Adobe XD
7 2 (0.21%) InVision
7 2 (0.21%) Photoshop
8 1 (0.10%) Adobe After Effects
8 1 (0.10%) Adobe Premiere
8 1 (0.10%) AutoCAD
8 1 (0.10%) CINEMA 4D
8 1 (0.10%) Fusion 360
8 1 (0.10%) Revit
8 1 (0.10%) SOLIDWORKS
8 1 (0.10%) UXPin
Business Applications
1 20 (2.10%) Dynamics CRM
2 10 (1.05%) Oracle EBS
3 6 (0.63%) SAP S/4HANA
4 4 (0.42%) Oracle ERP
4 4 (0.42%) Oracle Financials
5 3 (0.31%) SAP GRC
6 2 (0.21%) Exchequer
6 2 (0.21%) Infor CloudSuite
6 2 (0.21%) Oracle Payables
6 2 (0.21%) Oracle Receivables
6 2 (0.21%) SAP ERP
6 2 (0.21%) Sparx Enterprise Architect
6 2 (0.21%) Unit4 Business World
7 1 (0.10%) Loan IQ
7 1 (0.10%) Oracle Assets
7 1 (0.10%) Oracle General Ledger
7 1 (0.10%) Oracle Procure-to-Pay
7 1 (0.10%) SAP CCM
7 1 (0.10%) SAP PS
7 1 (0.10%) Workday HCM
Cloud Services
1 231 (24.24%) AWS
2 174 (18.26%) Azure
3 77 (8.08%) Power Platform
4 61 (6.40%) Serverless
5 51 (5.35%) Amazon S3
6 47 (4.93%) AWS Lambda
7 39 (4.09%) GitHub
8 34 (3.57%) Microsoft 365
9 28 (2.94%) Amazon EKS
9 28 (2.94%) Dynamics 365
9 28 (2.94%) Power Automate
10 27 (2.83%) PowerApps
11 26 (2.73%) AWS CloudFormation
12 25 (2.62%) GitHub Actions
13 23 (2.41%) Azure Data Factory
13 23 (2.41%) GCP
14 22 (2.31%) Azure DevOps
15 20 (2.10%) dbt
16 19 (1.99%) OCI
16 19 (1.99%) SaaS
Communications & Networking
1 34 (3.57%) Firewall
2 15 (1.57%) VPN
3 13 (1.36%) Network Security
4 11 (1.15%) DNS
5 7 (0.73%) DHCP
6 5 (0.52%) LAN
6 5 (0.52%) WAN
6 5 (0.52%) Wireless
7 4 (0.42%) HTTP
7 4 (0.42%) TCP/IP
7 4 (0.42%) Wi-Fi
8 3 (0.31%) BGP
8 3 (0.31%) Internet
8 3 (0.31%) IPsec
8 3 (0.31%) SSH
9 2 (0.21%) EIGRP
9 2 (0.21%) Ethernet
9 2 (0.21%) MPLS
9 2 (0.21%) OSPF
9 2 (0.21%) VLAN
Database & Business Intelligence
1 51 (5.35%) PostgreSQL
2 49 (5.14%) Power BI
3 30 (3.15%) Amazon RDS
4 26 (2.73%) MongoDB
5 23 (2.41%) Data Lake
5 23 (2.41%) Data Warehouse
5 23 (2.41%) NoSQL
5 23 (2.41%) Relational Database
6 22 (2.31%) Tableau
7 20 (2.10%) Metadata
8 15 (1.57%) MySQL
9 14 (1.47%) Amazon Athena
9 14 (1.47%) SQL Server
10 11 (1.15%) Neo4j
10 11 (1.15%) Redis
11 10 (1.05%) Amazon Redshift
11 10 (1.05%) Oracle Database
12 8 (0.84%) GIS
13 7 (0.73%) Azure SQL Database
13 7 (0.73%) Big Data
Development Applications
1 40 (4.20%) JIRA
2 34 (3.57%) Git
3 28 (2.94%) Jenkins
4 25 (2.62%) GitLab
5 21 (2.20%) JUnit
6 16 (1.68%) Mockito
7 11 (1.15%) Cucumber
7 11 (1.15%) Gradle
7 11 (1.15%) Liquibase
8 10 (1.05%) SonarQube
9 9 (0.94%) Cypress.io
10 7 (0.73%) Selenium
11 6 (0.63%) Postman
12 5 (0.52%) CircleCI
12 5 (0.52%) Maven
12 5 (0.52%) MLflow
13 4 (0.42%) Jasmine
14 3 (0.31%) Axure RP
14 3 (0.31%) RStudio
14 3 (0.31%) SoapUI
General
1 229 (24.03%) Social Skills
2 127 (13.33%) Analytical Skills
3 114 (11.96%) Finance
4 59 (6.19%) Marketing
5 56 (5.88%) Local Government
6 52 (5.46%) Telecoms
7 47 (4.93%) Manufacturing
8 46 (4.83%) Electronics
9 39 (4.09%) Military
10 25 (2.62%) Law
11 22 (2.31%) Police
12 21 (2.20%) Inclusion and Diversity
13 19 (1.99%) Documentation Skills
14 17 (1.78%) Influencing Skills
15 15 (1.57%) Presentation Skills
16 14 (1.47%) Legal
17 9 (0.94%) Banking
18 8 (0.84%) Organisational Skills
19 4 (0.42%) Back Office
19 4 (0.42%) Brand Awareness
Job Titles
1 184 (19.31%) Architect
2 136 (14.27%) Developer
3 101 (10.60%) Senior
4 71 (7.45%) Analyst
4 71 (7.45%) Lead
5 55 (5.77%) Data Engineer
6 42 (4.41%) Business Analyst
6 42 (4.41%) Consultant
6 42 (4.41%) Java Developer
7 34 (3.57%) DevOps Engineer
8 33 (3.46%) Project Manager
8 33 (3.46%) Security Architect
9 29 (3.04%) Designer
10 28 (2.94%) AWS Architect
11 26 (2.73%) AWS Engineer
11 26 (2.73%) SC Cleared Java Developer
11 26 (2.73%) Solutions Architect
11 26 (2.73%) Technical Architect
12 25 (2.62%) Data Architect
13 24 (2.52%) Senior Developer
Libraries, Frameworks & Software Standards
1 64 (6.72%) React
2 56 (5.88%) Kafka
3 47 (4.93%) Spring
4 44 (4.62%) Spring Boot
5 28 (2.94%) HTML
6 26 (2.73%) .NET
7 23 (2.41%) Node.js
8 22 (2.31%) Oracle Fusion
8 22 (2.31%) REST
9 19 (1.99%) CSS
10 18 (1.89%) Jinja
10 18 (1.89%) Swagger
11 17 (1.78%) JSON
11 17 (1.78%) OpenAPI
12 15 (1.57%) OAuth
12 15 (1.57%) RESTful
13 14 (1.47%) TensorFlow
14 13 (1.36%) Plotly
15 12 (1.26%) pydantic
15 12 (1.26%) PySpark
Miscellaneous
1 54 (5.67%) Onboarding
2 26 (2.73%) Management Information System
3 16 (1.68%) Legacy Systems
4 14 (1.47%) NHS
5 12 (1.26%) Security Posture
6 11 (1.15%) Product Ownership
7 10 (1.05%) PKI
8 8 (0.84%) Distributed Systems
8 8 (0.84%) Driving Licence
8 8 (0.84%) Public Cloud
9 7 (0.73%) CMDB
9 7 (0.73%) Data Structures
9 7 (0.73%) Greenfield Project
9 7 (0.73%) Security Operations Centre
10 6 (0.63%) CSOC
10 6 (0.63%) Cyber Threat
10 6 (0.63%) Data Centre
10 6 (0.63%) Virtual Team
11 5 (0.52%) Cloud Native
11 5 (0.52%) Self-Motivation
Operating Systems
1 45 (4.72%) Windows
2 36 (3.78%) Linux
3 15 (1.57%) Windows Server
4 11 (1.15%) Red Hat Enterprise Linux
4 11 (1.15%) Windows 10
5 8 (0.84%) Mac OS
6 6 (0.63%) Apple iOS
7 5 (0.52%) Unix
8 3 (0.31%) Android
9 2 (0.21%) Mac OS X
9 2 (0.21%) Windows 8
9 2 (0.21%) Windows Server 2003
9 2 (0.21%) Windows XP
10 1 (0.10%) Amazon Linux
10 1 (0.10%) CentOS
10 1 (0.10%) Oracle Linux
10 1 (0.10%) VMS
10 1 (0.10%) Windows Server 2016
10 1 (0.10%) Windows Server 2019
10 1 (0.10%) zOS
Processes & Methodologies
1 210 (22.04%) Agile
2 135 (14.17%) Problem-Solving
3 131 (13.75%) DevOps
4 120 (12.59%) Stakeholder Management
5 105 (11.02%) CI/CD
6 91 (9.55%) Business Intelligence
7 88 (9.23%) Stakeholder Engagement
8 85 (8.92%) Microservices
9 70 (7.35%) Containerisation
9 70 (7.35%) Data Modelling
9 70 (7.35%) Migration
10 60 (6.30%) Programme Management
11 56 (5.88%) Decision-Making
11 56 (5.88%) Mentoring
12 55 (5.77%) Analytics
13 52 (5.46%) Project Management
14 49 (5.14%) ITIL
15 47 (4.93%) Digital Marketing
16 44 (4.62%) TDD
17 42 (4.41%) Cybersecurity
Programming Languages
1 152 (15.95%) SQL
2 123 (12.91%) Python
3 96 (10.07%) Java
4 85 (8.92%) JavaScript
5 34 (3.57%) PowerShell
5 34 (3.57%) TypeScript
6 27 (2.83%) C#
7 20 (2.10%) Bash
8 15 (1.57%) Ruby
9 11 (1.15%) R
10 10 (1.05%) Bicep
11 7 (0.73%) Shell Script
12 6 (0.63%) PL/SQL
13 5 (0.52%) C++
13 5 (0.52%) Kotlin
13 5 (0.52%) Perl
13 5 (0.52%) Scala
14 3 (0.31%) Groovy
14 3 (0.31%) T-SQL
15 2 (0.21%) VB
Qualifications
1 555 (58.24%) Security Cleared
2 450 (47.22%) SC Cleared
3 51 (5.35%) Degree
4 28 (2.94%) AWS Certification
5 27 (2.83%) DV Cleared
6 20 (2.10%) AWS Certified Solutions Architect
7 14 (1.47%) CISSP
8 13 (1.36%) AWS Certified Developer
8 13 (1.36%) Computer Science Degree
9 10 (1.05%) BPSS Clearance
10 8 (0.84%) Cisco Certification
11 7 (0.73%) Microsoft Certification
11 7 (0.73%) OCP
11 7 (0.73%) Oracle Certification
12 6 (0.63%) MRICS
12 6 (0.63%) RIBA
13 5 (0.52%) CCNP
13 5 (0.52%) CESG Certified Professional
13 5 (0.52%) ISO 27001 Lead Implementer
13 5 (0.52%) ITIL Certification
Quality Assurance & Compliance
1 38 (3.99%) Accessibility
2 29 (3.04%) QA
3 22 (2.31%) GDPR
4 21 (2.20%) ISO/IEC 27001
5 19 (1.99%) NIST
6 17 (1.78%) Data Quality
7 12 (1.26%) WCAG
8 11 (1.15%) GRC
9 9 (0.94%) NCSC
9 9 (0.94%) SLA
10 7 (0.73%) ISO/IEC 27002 (supersedes ISO/IEC 17799)
10 7 (0.73%) Sarbanes-Oxley
11 6 (0.63%) PMO
12 5 (0.52%) ISO/IEC 20000
13 4 (0.42%) HIPAA
13 4 (0.42%) PCI DSS
14 3 (0.31%) Actionable Recommendations
14 3 (0.31%) ISO/IEC 17025
15 2 (0.21%) Cyber Essentials
15 2 (0.21%) SOC 2
System Software
1 63 (6.61%) Docker
2 35 (3.67%) Active Directory
3 10 (1.05%) VMware Infrastructure
4 5 (0.52%) Firmware
4 5 (0.52%) Virtual Machines
4 5 (0.52%) vSphere
5 4 (0.42%) Virtual Desktop
6 3 (0.31%) Apache ZooKeeper
6 3 (0.31%) Hyper-V
6 3 (0.31%) IAG
6 3 (0.31%) VMware ESXi
7 2 (0.21%) BitLocker
7 2 (0.21%) Microsoft App-V
7 2 (0.21%) Terminal Services
7 2 (0.21%) VMware Workstation
7 2 (0.21%) XenApp
8 1 (0.10%) Oracle RAC
Systems Management
1 88 (9.23%) Kubernetes
2 75 (7.87%) Terraform
3 25 (2.62%) Ansible
4 24 (2.52%) Microsoft Intune
5 11 (1.15%) Prometheus
6 7 (0.73%) Grafana
7 6 (0.63%) SCCM
8 5 (0.52%) Puppet
9 3 (0.31%) Istio
9 3 (0.31%) Kibana
10 2 (0.21%) Argo
10 2 (0.21%) FortiGate
10 2 (0.21%) HAProxy
10 2 (0.21%) McAfee ePO
10 2 (0.21%) Nagios
10 2 (0.21%) Norton AntiVirus
10 2 (0.21%) Progress Chef
10 2 (0.21%) Single Sign-On
10 2 (0.21%) vCenter Server
10 2 (0.21%) vMotion
Vendors
1 136 (14.27%) Microsoft
2 77 (8.08%) Oracle
3 65 (6.82%) SAP
4 39 (4.09%) ServiceNow
5 29 (3.04%) Virgin Media
6 25 (2.62%) Cisco
7 22 (2.31%) Google
8 19 (1.99%) Databricks
8 19 (1.99%) Salesforce
9 17 (1.78%) Splunk
10 16 (1.68%) VMware
11 10 (1.05%) Adobe
12 9 (0.94%) Dynatrace
13 6 (0.63%) Juniper
13 6 (0.63%) Palantir
14 5 (0.52%) IBM
14 5 (0.52%) Palo Alto
15 4 (0.42%) Sparx
15 4 (0.42%) Workday
15 4 (0.42%) Zscaler