SaaS Contracts in London

Software as a Service (SaaS)
England > London

The following table provides summary statistics for contract job vacancies advertised in London with a requirement for SaaS skills. Included is a benchmarking guide to the contractor rates offered in vacancies that have cited SaaS over the 6 months to 30 April 2024 with a comparison to the same period in the previous 2 years.

6 months to
30 Apr 2024
Same period 2023 Same period 2022
Rank 122 123 111
Rank change year-on-year +1 -12 +29
Contract jobs citing SaaS 347 554 985
As % of all contract jobs advertised in London 1.95% 2.05% 2.53%
As % of the Cloud Services category 5.15% 5.25% 6.09%
Number of daily rates quoted 227 391 760
10th Percentile £405 £400 £413
25th Percentile £450 £458 £500
Median daily rate (50th Percentile) £550 £565 £575
Median % change year-on-year -2.65% -1.74% +9.52%
75th Percentile £706 £721 £675
90th Percentile £777 £800 £763
England median daily rate £550 £550 £575
% change year-on-year - -4.35% +9.52%
Number of hourly rates quoted 14 5 5
10th Percentile £22.65 £41.95 -
25th Percentile £25.00 £66.25 -
Median hourly rate £26.00 £80.00 £35.00
Median % change year-on-year -67.50% +128.57% -4.76%
75th Percentile £31.75 £82.50 £43.75
90th Percentile £38.13 £82.80 £55.75
England median hourly rate £26.00 £76.71 £46.25
% change year-on-year -66.10% +65.85% +131.25%

All Cloud Skills
London

SaaS is in the Cloud Services category. The following table is for comparison with the above and provides summary statistics for all contract job vacancies advertised in London with a requirement for cloud computing skills.

Contract vacancies with a requirement for cloud computing skills 6,744 10,546 16,161
As % of all contract IT jobs advertised in London 37.83% 39.02% 41.53%
Number of daily rates quoted 4,977 7,700 12,103
10th Percentile £350 £375 £400
25th Percentile £445 £475 £478
Median daily rate (50th Percentile) £550 £588 £575
Median % change year-on-year -6.38% +2.17% +9.52%
75th Percentile £675 £695 £688
90th Percentile £775 £782 £763
England median daily rate £525 £550 £550
% change year-on-year -4.55% - +10.00%
Number of hourly rates quoted 71 90 87
10th Percentile £17.78 £20.00 £16.18
25th Percentile £21.25 £24.63 £21.89
Median hourly rate £25.00 £40.00 £39.50
Median % change year-on-year -37.50% +1.27% +17.91%
75th Percentile £38.44 £70.00 £61.19
90th Percentile £58.75 £88.30 £79.05
England median hourly rate £20.77 £32.30 £21.00
% change year-on-year -35.70% +53.81% -2.33%

SaaS
Job Vacancy Trend in London

Job postings citing SaaS as a proportion of all IT jobs advertised in London.
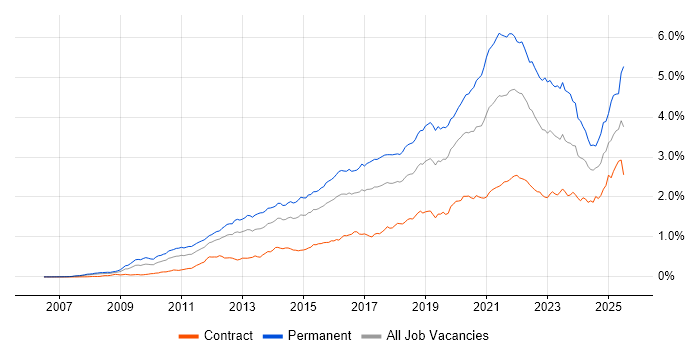
Job vacancy trend for SaaS in London

SaaS
Contractor Daily Rate Trend in London

3-month moving average daily rate quoted in jobs citing SaaS in London.

Daily rate trend for SaaS in London

SaaS
Daily Rate Histogram in London

Daily rate distribution for jobs citing SaaS in London over the 6 months to 30 April 2024.

Daily rate histogram for SaaS in London

SaaS
Contractor Hourly Rate Trend in London

3-month moving average hourly rates quoted in jobs citing SaaS in London.

Hourly rate trend for SaaS in London

SaaS
Hourly Rate Histogram in London

Hourly rate distribution of jobs citing SaaS in London over the 6 months to 30 April 2024.

Hourly rate histogram for SaaS in London

SaaS
Contract Job Locations in London

The table below looks at the demand and provides a guide to the median contractor rates quoted in IT jobs citing SaaS within the London region over the 6 months to 30 April 2024. The 'Rank Change' column provides an indication of the change in demand within each location based on the same 6 month period last year.

Location Rank Change
on Same Period
Last Year
Matching
Contract
IT Job Ads
Median
Daily Rate
Past 6 Months
Median Daily Rate
% Change
on Same Period
Last Year
Live
Jobs
Central London -10 38 £525 -12.50% 44
West London +16 5 £525 +7.69% 23
East London -10 5 £775 +3.33% 8
South London +13 3 £303 -38.42% 8
North London +3 2 £425 +6.25% 1
SaaS
England

SaaS
Co-occurring Skills and Capabilities in London by Category

The follow tables expand on the table above by listing co-occurrences grouped by category. The same employment type, locality and period is covered with up to 20 co-occurrences shown in each of the following categories:

Application Platforms
1 17 (4.90%) Confluence
2 9 (2.59%) CMS
3 7 (2.02%) SharePoint
4 6 (1.73%) Adobe Experience Manager
5 5 (1.44%) Anypoint
6 4 (1.15%) Microsoft Exchange
6 4 (1.15%) OpenStack
7 3 (0.86%) WordPress
8 2 (0.58%) Apache
8 2 (0.58%) Apache Solr
8 2 (0.58%) Headless CMS
8 2 (0.58%) Oracle Self-Service HR
8 2 (0.58%) WebSphere
9 1 (0.29%) BizTalk Server
9 1 (0.29%) IBM Notes
9 1 (0.29%) IIS
9 1 (0.29%) Mule
9 1 (0.29%) SAS
9 1 (0.29%) Tomcat
Applications
1 13 (3.75%) Microsoft Office
2 9 (2.59%) Microsoft Excel
3 7 (2.02%) Microsoft PowerPoint
4 4 (1.15%) Spreadsheet
5 2 (0.58%) Chatbot
6 1 (0.29%) Adobe Creative Suite
6 1 (0.29%) Microsoft Project
6 1 (0.29%) MS Visio
6 1 (0.29%) Sketch
6 1 (0.29%) Trello
Business Applications
1 4 (1.15%) Oracle Receivables
1 4 (1.15%) Workfront
2 3 (0.86%) Oracle EBS
3 2 (0.58%) Adobe Campaign
3 2 (0.58%) Oracle EBS R12
3 2 (0.58%) Oracle Financials
3 2 (0.58%) Oracle Procure-to-Pay
3 2 (0.58%) SAP Hybris
3 2 (0.58%) SAP S/4HANA
3 2 (0.58%) Shopify
4 1 (0.29%) Dynamics CRM
4 1 (0.29%) IBM Planning Analytics
4 1 (0.29%) Infor SunSystems
4 1 (0.29%) Oracle ERP
4 1 (0.29%) Oracle FAH
4 1 (0.29%) Oracle General Ledger
4 1 (0.29%) Oracle Payroll
4 1 (0.29%) SAP HCM
Cloud Services
1 93 (26.80%) PaaS
2 91 (26.22%) Azure
3 85 (24.50%) IaaS
4 74 (21.33%) AWS
5 33 (9.51%) Serverless
6 19 (5.48%) Cloud Computing
7 18 (5.19%) Entra ID
8 17 (4.90%) Microsoft 365
9 16 (4.61%) GCP
10 14 (4.03%) AWS CloudFormation
11 13 (3.75%) Azure DevOps
12 10 (2.88%) AWS Lambda
13 8 (2.31%) Google Workspace
13 8 (2.31%) Nutanix
13 8 (2.31%) Power Platform
13 8 (2.31%) Rubrik
14 7 (2.02%) Amazon EventBridge
14 7 (2.02%) GitHub
15 6 (1.73%) Azure Functions
15 6 (1.73%) Dynamics 365
Communications & Networking
1 39 (11.24%) Firewall
2 24 (6.92%) DNS
3 14 (4.03%) DHCP
4 13 (3.75%) HTTP
5 11 (3.17%) SAN
6 10 (2.88%) NAS
6 10 (2.88%) TCP/IP
7 8 (2.31%) Kerberos
7 8 (2.31%) VLAN
8 6 (1.73%) IPsec
9 5 (1.44%) HTTPS
9 5 (1.44%) Internet
10 4 (1.15%) LAN
10 4 (1.15%) VoIP
10 4 (1.15%) VPN
10 4 (1.15%) Wi-Fi
11 3 (0.86%) MPLS
11 3 (0.86%) SMS
11 3 (0.86%) SSL
12 2 (0.58%) WAN
Database & Business Intelligence
1 16 (4.61%) NoSQL
1 16 (4.61%) SQL Server
2 8 (2.31%) Data Warehouse
2 8 (2.31%) Relational Database
3 7 (2.02%) MySQL
4 5 (1.44%) Data Lake
4 5 (1.44%) Power BI
5 4 (1.15%) PostgreSQL
6 3 (0.86%) Apache Cassandra
6 3 (0.86%) Azure SQL Database
6 3 (0.86%) Big Data
6 3 (0.86%) OLAP
6 3 (0.86%) OLTP
6 3 (0.86%) RDBMS
6 3 (0.86%) Redis
7 2 (0.58%) DynamoDB
7 2 (0.58%) Hadoop
8 1 (0.29%) MongoDB
8 1 (0.29%) Oracle Reports
8 1 (0.29%) QlikView
Development Applications
1 24 (6.92%) JIRA
2 22 (6.34%) Git
3 17 (4.90%) Jenkins
4 13 (3.75%) TeamCity
5 5 (1.44%) webpack
6 4 (1.15%) Visual Studio
7 3 (0.86%) GitLab
7 3 (0.86%) Oracle APEX
8 2 (0.58%) Cypress.io
8 2 (0.58%) gulp
8 2 (0.58%) Postman
8 2 (0.58%) Selenium
8 2 (0.58%) SoapUI
8 2 (0.58%) Visual Studio Team System
9 1 (0.29%) Atlassian Bamboo
9 1 (0.29%) Bitbucket
9 1 (0.29%) JUnit
9 1 (0.29%) Maven
9 1 (0.29%) Spinnaker
9 1 (0.29%) TestNG
General
1 92 (26.51%) Finance
2 78 (22.48%) Social Skills
3 31 (8.93%) Marketing
4 21 (6.05%) Analytical Skills
5 19 (5.48%) Banking
6 16 (4.61%) Public Sector
7 11 (3.17%) Influencing Skills
8 10 (2.88%) Presentation Skills
9 9 (2.59%) Legal
10 8 (2.31%) Law
10 8 (2.31%) Manufacturing
10 8 (2.31%) Telecoms
11 7 (2.02%) Billing
12 6 (1.73%) German Language
12 6 (1.73%) Retail
13 5 (1.44%) Back Office
13 5 (1.44%) Games
13 5 (1.44%) Police
14 4 (1.15%) Health Technology
15 3 (0.86%) French Language
Job Titles
1 101 (29.11%) Architect
2 50 (14.41%) Senior
3 34 (9.80%) Solutions Architect
4 33 (9.51%) Analyst
5 32 (9.22%) Security Architect
6 29 (8.36%) Cloud Architect
7 24 (6.92%) Developer
8 23 (6.63%) Business Analyst
9 21 (6.05%) Project Manager
9 21 (6.05%) Senior Architect
10 20 (5.76%) Senior Security Architect
11 17 (4.90%) Lead
12 13 (3.75%) Consultant
13 11 (3.17%) Azure Architect
13 11 (3.17%) Enterprise Architect
14 10 (2.88%) Cloud Security Architect
14 10 (2.88%) DevOps Engineer
14 10 (2.88%) Senior Manager
14 10 (2.88%) Technical Manager
15 9 (2.59%) Delivery Manager
Libraries, Frameworks & Software Standards
1 23 (6.63%) Node.js
2 22 (6.34%) REST
3 15 (4.32%) SAML
4 14 (4.03%) LDAP
5 13 (3.75%) CSS
5 13 (3.75%) HTML
5 13 (3.75%) OpenID
5 13 (3.75%) React
6 10 (2.88%) OAuth
7 9 (2.59%) SOAP
8 8 (2.31%) Oracle Fusion
9 7 (2.02%) Middleware
9 7 (2.02%) OAuth2
9 7 (2.02%) XML
10 6 (1.73%) .NET
10 6 (1.73%) JSON
10 6 (1.73%) RabbitMQ
10 6 (1.73%) Spring
10 6 (1.73%) Swagger
11 5 (1.44%) HTML5
Miscellaneous
1 17 (4.90%) Cloud Native
1 17 (4.90%) Data Centre
2 16 (4.61%) IoT
2 16 (4.61%) Mobile App
2 16 (4.61%) Product Ownership
3 13 (3.75%) Hybrid Cloud
4 12 (3.46%) Clustering
4 12 (3.46%) Management Information System
4 12 (3.46%) Public Cloud
5 11 (3.17%) Enterprise Software
6 10 (2.88%) Enterprise Cloud
6 10 (2.88%) Onboarding
7 9 (2.59%) Replication
8 7 (2.02%) Client/Server
8 7 (2.02%) Self-Motivation
9 6 (1.73%) Augmented Reality
9 6 (1.73%) Data Protection Act
9 6 (1.73%) Greenfield Project
9 6 (1.73%) Virtual Reality
10 5 (1.44%) Virtual Team
Operating Systems
1 29 (8.36%) Linux
2 28 (8.07%) Windows
3 11 (3.17%) Solaris
3 11 (3.17%) Windows Server
4 10 (2.88%) Red Hat Enterprise Linux
5 8 (2.31%) Oracle Linux
6 6 (1.73%) Unix
7 3 (0.86%) Windows Server 2012
8 2 (0.58%) VMS
9 1 (0.29%) Windows 10
Processes & Methodologies
1 81 (23.34%) Agile
2 46 (13.26%) DevOps
2 46 (13.26%) Migration
3 41 (11.82%) Infrastructure as Code
4 40 (11.53%) Roadmaps
5 37 (10.66%) Security Architecture
6 36 (10.37%) Cloud Security
7 34 (9.80%) Project Management
8 32 (9.22%) CI/CD
9 31 (8.93%) Stakeholder Management
10 30 (8.65%) ERP
10 30 (8.65%) Information Security
11 29 (8.36%) Problem-Solving
12 26 (7.49%) Microservices
13 25 (7.20%) SDLC
14 23 (6.63%) B2B
15 22 (6.34%) Change Management
15 22 (6.34%) Cybersecurity
15 22 (6.34%) Decision-Making
15 22 (6.34%) Disaster Recovery
Programming Languages
1 41 (11.82%) Python
2 33 (9.51%) SQL
3 24 (6.92%) PowerShell
4 15 (4.32%) Bash
5 14 (4.03%) Java
6 11 (3.17%) C#
6 11 (3.17%) JavaScript
7 8 (2.31%) TypeScript
8 7 (2.02%) Ruby
9 6 (1.73%) Go
10 4 (1.15%) C
11 3 (0.86%) Google Apps Script
11 3 (0.86%) PHP
11 3 (0.86%) Rust
12 2 (0.58%) Apex Code
13 1 (0.29%) Bicep
13 1 (0.29%) C++
13 1 (0.29%) PL/SQL
13 1 (0.29%) Search Processing Language
13 1 (0.29%) XPath
Qualifications
1 43 (12.39%) Degree
2 24 (6.92%) Security Cleared
3 18 (5.19%) SC Cleared
4 9 (2.59%) Computer Science Degree
5 7 (2.02%) CISSP
5 7 (2.02%) Master's Degree
5 7 (2.02%) PMP
6 5 (1.44%) Cisco Certification
6 5 (1.44%) CTC Cleared
6 5 (1.44%) PMI Certification
7 4 (1.15%) APMP
7 4 (1.15%) DV Cleared
8 3 (0.86%) Azure Certification
8 3 (0.86%) CCIE
8 3 (0.86%) CCNP
8 3 (0.86%) CISM
8 3 (0.86%) CRISC
8 3 (0.86%) GIAC
9 2 (0.58%) FFIEC
9 2 (0.58%) TOGAF Certification
Quality Assurance & Compliance
1 27 (7.78%) QA
2 22 (6.34%) GDPR
3 21 (6.05%) NIST
4 9 (2.59%) Sarbanes-Oxley
5 7 (2.02%) ISO/IEC 27001
6 5 (1.44%) Data Quality
6 5 (1.44%) PMO
6 5 (1.44%) SLA
7 3 (0.86%) Cyber Essentials
7 3 (0.86%) ISO/IEC 27002 (supersedes ISO/IEC 17799)
8 2 (0.58%) Accessibility
8 2 (0.58%) GRC
8 2 (0.58%) NIST 800
8 2 (0.58%) Software Quality Assurance
9 1 (0.29%) Actionable Recommendations
9 1 (0.29%) COPPA
9 1 (0.29%) GLBA
9 1 (0.29%) IFRS
9 1 (0.29%) IFRS 17
9 1 (0.29%) IFRS 9
System Software
1 31 (8.93%) Active Directory
2 19 (5.48%) Docker
3 10 (2.88%) VMware Infrastructure
4 4 (1.15%) Firmware
5 1 (0.29%) Terminal Server
5 1 (0.29%) Virtual Machines
5 1 (0.29%) VMware ESXi
Systems Management
1 38 (10.95%) Terraform
2 22 (6.34%) Kubernetes
3 18 (5.19%) Ansible
4 9 (2.59%) Single Sign-On
5 8 (2.31%) EMC NetWorker
5 8 (2.31%) Netcool
5 8 (2.31%) Tivoli
5 8 (2.31%) Tivoli Storage Manager
6 5 (1.44%) FortiGate
6 5 (1.44%) Grafana
7 3 (0.86%) Microsoft Intune
8 2 (0.58%) Progress Chef
8 2 (0.58%) Puppet
9 1 (0.29%) CASB
9 1 (0.29%) HP ALM
9 1 (0.29%) McAfee ePO
9 1 (0.29%) Prometheus
9 1 (0.29%) SCCM
Vendors
1 73 (21.04%) Microsoft
2 48 (13.83%) Oracle
3 20 (5.76%) Salesforce
4 19 (5.48%) SAP
5 18 (5.19%) ServiceNow
6 17 (4.90%) Cisco
7 16 (4.61%) Google
8 12 (3.46%) IBM
8 12 (3.46%) Splunk
8 12 (3.46%) VMware
9 11 (3.17%) Adobe
9 11 (3.17%) Dell
10 10 (2.88%) CyberArk
10 10 (2.88%) HP
10 10 (2.88%) Okta
11 8 (2.31%) EMC
11 8 (2.31%) Isilon
11 8 (2.31%) Qualys
11 8 (2.31%) Serena
12 7 (2.02%) MuleSoft