Integration Testing Jobs in England

Integration Testing
UK > England

The table below provides summary statistics for permanent job vacancies advertised in England requiring Integration Testing skills. It includes a benchmarking guide to the annual salaries offered in vacancies that cited Integration Testing over the 6 months leading up to 19 June 2024, comparing them to the same period in the previous two years.

6 months to
19 Jun 2024
Same period 2023 Same period 2022
Rank 569 512 350
Rank change year-on-year -57 -162 +10
Permanent jobs citing Integration Testing 309 435 1,580
As % of all permanent jobs advertised in England 0.32% 0.53% 1.09%
As % of the Processes & Methodologies category 0.39% 0.56% 1.14%
Number of salaries quoted 205 263 496
10th Percentile £40,000 £38,433 £36,250
25th Percentile £47,500 £48,750 £45,000
Median annual salary (50th Percentile) £60,000 £69,447 £62,500
Median % change year-on-year -13.60% +11.12% +9.65%
75th Percentile £73,883 £89,375 £80,000
90th Percentile £90,000 £104,500 £100,000
UK median annual salary £60,000 £70,000 £60,000
% change year-on-year -14.29% +16.67% +5.71%

All Process and Methodology Skills
England

Integration Testing falls under the Processes and Methodologies category. For comparison with the information above, the following table provides summary statistics for all permanent job vacancies requiring process or methodology skills in England.

Permanent vacancies with a requirement for process or methodology skills 78,968 78,333 138,622
As % of all permanent jobs advertised in England 82.62% 95.44% 95.96%
Number of salaries quoted 56,258 48,146 73,664
10th Percentile £29,383 £34,308 £33,349
25th Percentile £40,000 £45,775 £44,178
Median annual salary (50th Percentile) £55,000 £62,500 £60,000
Median % change year-on-year -12.00% +4.17% +9.09%
75th Percentile £72,500 £82,500 £80,000
90th Percentile £92,500 £102,500 £97,500
UK median annual salary £55,000 £60,899 £60,000
% change year-on-year -9.69% +1.50% +9.09%

Integration Testing
Job Vacancy Trend in England

Job postings citing Integration Testing as a proportion of all IT jobs advertised in England.
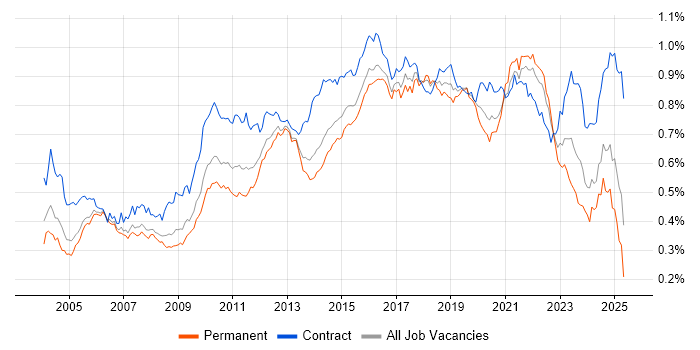
Job vacancy trend for Integration Testing in England

Integration Testing
Salary Trend in England

3-month moving average salary quoted in jobs citing Integration Testing in England.

Salary trend for Integration Testing in England

Integration Testing
Salary Histogram in England

Salary distribution for jobs citing Integration Testing in England over the 6 months to 19 June 2024.

Salary histogram for Integration Testing in England

Integration Testing
Job Locations in England

The table below looks at the demand and provides a guide to the median salaries quoted in IT jobs citing Integration Testing within the England region over the 6 months to 19 June 2024. The 'Rank Change' column provides an indication of the change in demand within each location based on the same 6 month period last year.

Location Rank Change
on Same Period
Last Year
Matching
Permanent
IT Job Ads
Median Salary
Past 6 Months
Median Salary
% Change
on Same Period
Last Year
Live
Jobs
London +19 103 £72,500 -14.71% 48
North of England -11 66 £57,500 +4.55% 21
North West -2 59 £57,500 -17.20% 13
South East -48 57 £56,000 -6.67% 28
East of England -22 34 £55,000 +37.50% 12
Midlands -34 27 £45,000 -18.18% 11
South West -36 22 £75,000 +34.53% 11
West Midlands -16 15 £58,700 +6.73% 8
East Midlands -20 12 £45,000 -34.55% 3
Yorkshire +24 6 £62,500 +19.05% 8
North East -18 1 £55,000 +12.82% 2
Integration Testing
UK

Integration Testing
Co-occurring Skills and Capabilities in England by Category

The follow tables expand on the table above by listing co-occurrences grouped by category. The same employment type, locality and period is covered with up to 20 co-occurrences shown in each of the following categories:

Application Platforms
1 8 (2.59%) Confluence
2 2 (0.65%) Apache
2 2 (0.65%) Apache Solr
2 2 (0.65%) Apache Spark
3 1 (0.32%) IIS
3 1 (0.32%) SharePoint
3 1 (0.32%) Tornado
Applications
1 9 (2.91%) Microsoft Excel
2 7 (2.27%) Microsoft Office
3 3 (0.97%) MS Visio
3 3 (0.97%) S-PLUS
4 2 (0.65%) Microsoft PowerPoint
Business Applications
1 9 (2.91%) Dynamics CRM
2 2 (0.65%) SAP S/4HANA
3 1 (0.32%) Oracle EBS
3 1 (0.32%) SAP ERP
3 1 (0.32%) SAP MM
3 1 (0.32%) SAP PP
Cloud Services
1 111 (35.92%) AWS
2 91 (29.45%) Azure
3 47 (15.21%) Azure DevOps
4 37 (11.97%) Amazon Kinesis
5 35 (11.33%) SaaS
6 29 (9.39%) Dynamics 365
7 20 (6.47%) Microsoft 365
8 16 (5.18%) Serverless
9 10 (3.24%) Azure Service Bus
9 10 (3.24%) PaaS
9 10 (3.24%) Power Platform
10 9 (2.91%) Azure Functions
10 9 (2.91%) PowerApps
11 7 (2.27%) Azure Logic Apps
12 6 (1.94%) Amazon ECS
13 5 (1.62%) IaaS
14 4 (1.29%) Azure API Management
14 4 (1.29%) GCP
14 4 (1.29%) Power Automate
15 3 (0.97%) GitHub
Communications & Networking
1 6 (1.94%) Ethernet
1 6 (1.94%) Wireless
2 5 (1.62%) Internet
3 4 (1.29%) TCP/IP
4 2 (0.65%) HTTP
5 1 (0.32%) DHCP
5 1 (0.32%) Diameter Protocol
5 1 (0.32%) DNS
5 1 (0.32%) GSM
5 1 (0.32%) LAN
5 1 (0.32%) Radio Access Network
5 1 (0.32%) SIGTRAN
5 1 (0.32%) SNMP
5 1 (0.32%) SS7
5 1 (0.32%) tcpdump
5 1 (0.32%) Value-Added Service
5 1 (0.32%) Wi-Fi
5 1 (0.32%) Wireshark
Database & Business Intelligence
1 49 (15.86%) PostgreSQL
2 41 (13.27%) DynamoDB
3 40 (12.94%) NoSQL
4 39 (12.62%) Amazon Aurora
5 34 (11.00%) SQL Server
6 25 (8.09%) Redis
7 16 (5.18%) Relational Database
8 12 (3.88%) MySQL
9 10 (3.24%) Power BI
9 10 (3.24%) SQL Server Integration Services
10 8 (2.59%) Data Lake
11 6 (1.94%) SQL Server Reporting Services
12 5 (1.62%) Azure SQL Database
12 5 (1.62%) Power Query
13 4 (1.29%) Big Data
13 4 (1.29%) Oracle Database
14 3 (0.97%) Amazon RDS
14 3 (0.97%) RDBMS
14 3 (0.97%) SQLite
15 2 (0.65%) Hadoop
Development Applications
1 63 (20.39%) Git
2 25 (8.09%) Gatling
3 23 (7.44%) JIRA
4 20 (6.47%) Visual Studio
5 19 (6.15%) JUnit
6 14 (4.53%) Selenium
7 12 (3.88%) NUnit
8 10 (3.24%) MSTest
8 10 (3.24%) Postman
9 9 (2.91%) Cypress.io
9 9 (2.91%) WebDriver
10 8 (2.59%) Moq
11 7 (2.27%) GitLab
11 7 (2.27%) Jenkins
12 6 (1.94%) SonarQube
12 6 (1.94%) Zephyr
13 5 (1.62%) JMeter
14 4 (1.29%) IntelliJ
14 4 (1.29%) webpack
15 3 (0.97%) Team Foundation Server
General
1 119 (38.51%) Social Skills
2 53 (17.15%) Finance
3 41 (13.27%) Electronics
4 31 (10.03%) Billing
5 28 (9.06%) Law
6 21 (6.80%) Retail
7 20 (6.47%) Analytical Skills
8 14 (4.53%) Inclusion and Diversity
9 13 (4.21%) Games
10 12 (3.88%) Marketing
11 10 (3.24%) Banking
11 10 (3.24%) Health Technology
12 7 (2.27%) Back Office
12 7 (2.27%) Tech for Good
13 6 (1.94%) Financial Institution
13 6 (1.94%) Investment Banking
13 6 (1.94%) Public Sector
14 5 (1.62%) Legal
14 5 (1.62%) Manufacturing
14 5 (1.62%) Retail Finance
Job Titles
1 120 (38.83%) Developer
2 106 (34.30%) Senior
3 59 (19.09%) Software Engineer
4 46 (14.89%) Senior Developer
5 33 (10.68%) Analyst
6 28 (9.06%) Lead
7 26 (8.41%) Senior Software Engineer
8 24 (7.77%) Full Stack Developer
9 22 (7.12%) Java Developer
9 22 (7.12%) Test Analyst
10 21 (6.80%) Senior Java Developer
11 19 (6.15%) C# Developer
12 16 (5.18%) Software Developer
13 13 (4.21%) Full Stack PHP Developer
13 13 (4.21%) PHP Developer
14 12 (3.88%) .NET Developer
15 11 (3.56%) Consultant
15 11 (3.56%) Lead Software Engineer
15 11 (3.56%) Technical Engineer
15 11 (3.56%) Technical Leader
Libraries, Frameworks & Software Standards
1 78 (25.24%) .NET
2 59 (19.09%) CSS
3 57 (18.45%) HTML
3 57 (18.45%) Web Services
4 52 (16.83%) React
5 50 (16.18%) REST
6 45 (14.56%) GraphQL
7 44 (14.24%) AngularJS
8 38 (12.30%) RESTful
9 35 (11.33%) http4s
9 35 (11.33%) Scalaz
10 30 (9.71%) jQuery
11 29 (9.39%) Lambda Expressions
12 27 (8.74%) .NET Core
13 26 (8.41%) JSON
14 24 (7.77%) .NET Framework
14 24 (7.77%) ASP.NET
15 23 (7.44%) Entity Framework
15 23 (7.44%) Spring
16 22 (7.12%) XML
Miscellaneous
1 37 (11.97%) Blog
1 37 (11.97%) Media Streaming
2 33 (10.68%) Greenfield Project
3 29 (9.39%) Product Ownership
4 26 (8.41%) Distributed Systems
4 26 (8.41%) Enterprise Software
5 22 (7.12%) Self-Motivation
6 12 (3.88%) Fixed Income
6 12 (3.88%) Hedge funds
7 10 (3.24%) Algorithms
8 9 (2.91%) Legacy Systems
9 8 (2.59%) Cloud Native
10 7 (2.27%) Robotics
11 6 (1.94%) Equities
11 6 (1.94%) Foreign Exchange (FX)
11 6 (1.94%) IoT
11 6 (1.94%) Legacy Applications
11 6 (1.94%) Management Information System
12 5 (1.62%) Analogue Electronics
12 5 (1.62%) BBC
Operating Systems
1 14 (4.53%) Linux
2 10 (3.24%) Windows
3 4 (1.29%) Android
4 3 (0.97%) VxWorks
4 3 (0.97%) Windows Server
5 2 (0.65%) Apple iOS
5 2 (0.65%) CentOS
5 2 (0.65%) Debian
5 2 (0.65%) Red Hat Enterprise Linux
5 2 (0.65%) Ubuntu
5 2 (0.65%) Unix
6 1 (0.32%) Solaris
Processes & Methodologies
1 165 (53.40%) Agile
2 128 (41.42%) DevOps
3 105 (33.98%) Unit Testing
4 103 (33.33%) Software Engineering
5 75 (24.27%) Computer Science
6 69 (22.33%) Continuous Integration
7 66 (21.36%) Test Automation
8 58 (18.77%) Microservices
9 54 (17.48%) CI/CD
10 46 (14.89%) User Acceptance Testing
11 45 (14.56%) Open Source
12 44 (14.24%) Mentoring
12 44 (14.24%) Problem-Solving
13 42 (13.59%) Full Stack Development
14 41 (13.27%) Design Patterns
15 39 (12.62%) Functional Programming
15 39 (12.62%) Software Testing
16 35 (11.33%) End-to-End Testing
16 35 (11.33%) Scrum
17 34 (11.00%) SDLC
Programming Languages
1 80 (25.89%) C#
2 64 (20.71%) JavaScript
3 63 (20.39%) SQL
4 53 (17.15%) Java
5 41 (13.27%) Scala
6 34 (11.00%) TypeScript
7 32 (10.36%) Python
8 21 (6.80%) C++
9 17 (5.50%) C
10 15 (4.85%) PHP
11 9 (2.91%) VB
12 8 (2.59%) Assembly Language
13 7 (2.27%) T-SQL
14 6 (1.94%) Go
15 5 (1.62%) Bicep
16 4 (1.29%) Embedded C
17 3 (0.97%) Kotlin
17 3 (0.97%) PL/SQL
17 3 (0.97%) VB.NET
18 1 (0.32%) Perl
Qualifications
1 94 (30.42%) Degree
2 52 (16.83%) Computer Science Degree
3 25 (8.09%) Security Cleared
4 21 (6.80%) SC Cleared
5 12 (3.88%) ISTQB
6 8 (2.59%) ITIL Certification
7 7 (2.27%) ISEB
8 6 (1.94%) CSPO
8 6 (1.94%) IIBA
9 5 (1.62%) Azure Certification
10 2 (0.65%) DV Cleared
10 2 (0.65%) HNC
11 1 (0.32%) BC Cleared
11 1 (0.32%) CCNA
11 1 (0.32%) Cisco Certification
11 1 (0.32%) ISTQB Advanced Certification
11 1 (0.32%) ISTQB Foundation Certification
11 1 (0.32%) Numerate Degree
11 1 (0.32%) PMI Certification
11 1 (0.32%) PMP
Quality Assurance & Compliance
1 39 (12.62%) QA
2 2 (0.65%) Accessibility
2 2 (0.65%) ISO 9001
2 2 (0.65%) ISO/IEC 27001
3 1 (0.32%) Data Quality
3 1 (0.32%) GxP
3 1 (0.32%) IEC 62304
3 1 (0.32%) Software Quality Assurance
3 1 (0.32%) WCAG
System Software
1 30 (9.71%) Docker
2 5 (1.62%) Active Directory
3 4 (1.29%) Firmware
4 3 (0.97%) VirtualBox
4 3 (0.97%) VMware Infrastructure
5 1 (0.32%) Embedded Firmware
Systems Management
1 36 (11.65%) Kubernetes
2 19 (6.15%) Terraform
3 4 (1.29%) Ansible
4 2 (0.65%) Kustomize
5 1 (0.32%) Grafana
5 1 (0.32%) Nmap
5 1 (0.32%) OpenNMS
5 1 (0.32%) Progress Chef
5 1 (0.32%) Prometheus
Vendors
1 40 (12.94%) Microsoft
2 15 (4.85%) ServiceNow
3 10 (3.24%) Salesforce
4 9 (2.91%) Oracle
5 8 (2.59%) SAP
6 6 (1.94%) Charles River
7 4 (1.29%) MuleSoft
7 4 (1.29%) Sybase
8 3 (0.97%) Cisco
8 3 (0.97%) Databricks
8 3 (0.97%) Google
8 3 (0.97%) VMware
9 2 (0.65%) F5
10 1 (0.32%) Denodo
10 1 (0.32%) Infor
10 1 (0.32%) Splunk
10 1 (0.32%) Talend