Site Reliability Engineering Jobs in England

Site Reliability Engineering (SRE)
UK > England

The following table provides summary statistics for permanent job vacancies advertised in England with a requirement for Site Reliability Engineering skills. Included is a benchmarking guide to the salaries offered in vacancies that have cited Site Reliability Engineering over the 6 months to 25 April 2024 with a comparison to the same period in the previous 2 years.

6 months to
25 Apr 2024
Same period 2023 Same period 2022
Rank 469 337 311
Rank change year-on-year -132 -26 -49
Permanent jobs citing Site Reliability Engineering 401 947 1,688
As % of all permanent jobs advertised in England 0.47% 1.01% 1.29%
As % of the Processes & Methodologies category 0.55% 1.06% 1.35%
Number of salaries quoted 301 660 1,079
10th Percentile £55,000 £52,375 £55,000
25th Percentile £60,000 £61,250 £62,500
Median annual salary (50th Percentile) £80,000 £85,000 £75,000
Median % change year-on-year -5.88% +13.33% -
75th Percentile £112,500 £100,000 £95,000
90th Percentile £138,750 £115,000 £118,750
UK median annual salary £80,000 £81,000 £75,000
% change year-on-year -1.23% +8.00% -

All Process and Methodology Skills
England

Site Reliability Engineering is in the Processes and Methodologies category. The following table is for comparison with the above and provides summary statistics for all permanent job vacancies advertised in England with a requirement for process or methodology skills.

Permanent vacancies with a requirement for process or methodology skills 72,981 89,600 124,867
As % of all permanent jobs advertised in England 85.92% 95.65% 95.66%
Number of salaries quoted 53,915 52,820 73,594
10th Percentile £29,000 £34,250 £33,306
25th Percentile £39,750 £46,000 £44,186
Median annual salary (50th Percentile) £55,000 £62,500 £60,000
Median % change year-on-year -12.00% +4.17% +9.09%
75th Percentile £73,750 £82,500 £80,000
90th Percentile £93,750 £101,250 £97,500
UK median annual salary £55,000 £61,700 £60,000
% change year-on-year -10.86% +2.83% +9.09%

Site Reliability Engineering
Job Vacancy Trend in England

Job postings citing Site Reliability Engineering as a proportion of all IT jobs advertised in England.
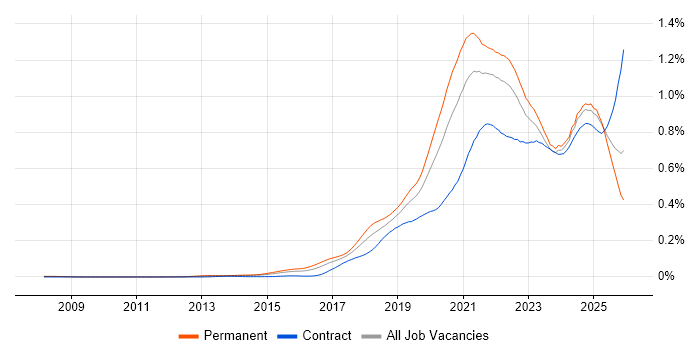
Job vacancy trend for Site Reliability Engineering in England

Site Reliability Engineering
Salary Trend in England

3-month moving average salary quoted in jobs citing Site Reliability Engineering in England.

Salary trend for Site Reliability Engineering in England

Site Reliability Engineering
Salary Histogram in England

Salary distribution for jobs citing Site Reliability Engineering in England over the 6 months to 25 April 2024.

Salary histogram for Site Reliability Engineering in England

Site Reliability Engineering
Job Locations in England

The table below looks at the demand and provides a guide to the median salaries quoted in IT jobs citing Site Reliability Engineering within the England region over the 6 months to 25 April 2024. The 'Rank Change' column provides an indication of the change in demand within each location based on the same 6 month period last year.

Location Rank Change
on Same Period
Last Year
Matching
Permanent
IT Job Ads
Median Salary
Past 6 Months
Median Salary
% Change
on Same Period
Last Year
Live
Jobs
London -56 192 £105,000 +13.51% 100
North of England -51 67 £62,783 +4.64% 26
South East -62 53 £65,000 -13.04% 23
Midlands +26 38 £60,000 -17.24% 8
North West -15 38 £62,783 +5.05% 19
South West -31 38 £80,000 +23.08% 20
West Midlands +27 23 £82,500 +13.79% 3
Yorkshire +13 22 £60,000 -3.23% 7
East Midlands -5 15 £60,000 - 5
East of England +24 10 £65,620 +0.95% 2
North East - 7 £62,783 -
Site Reliability Engineering
UK

Site Reliability Engineering
Co-occurring Skills and Capabilities in England by Category

The follow tables expand on the table above by listing co-occurrences grouped by category. The same employment type, locality and period is covered with up to 20 co-occurrences shown in each of the following categories:

Application Platforms
1 30 (7.48%) Apache Airflow
2 21 (5.24%) nginx
3 19 (4.74%) Apache
4 17 (4.24%) Apache Spark
4 17 (4.24%) Jupyter
5 12 (2.99%) Confluence
6 10 (2.49%) Microsoft Exchange
7 8 (2.00%) IIS
8 2 (0.50%) SharePoint
Applications
1 2 (0.50%) Microsoft Excel
1 2 (0.50%) Microsoft Office
1 2 (0.50%) Microsoft PowerPoint
Business Applications
1 2 (0.50%) Remedy ITSM
Cloud Services
1 228 (56.86%) AWS
2 167 (41.65%) Azure
3 61 (15.21%) OpenShift
4 59 (14.71%) Amazon S3
5 58 (14.46%) Serverless
6 57 (14.21%) AWS CloudFormation
7 48 (11.97%) GCP
8 47 (11.72%) AWS Lambda
9 46 (11.47%) Amazon EC2
9 46 (11.47%) Azure DevOps
10 39 (9.73%) Amazon ECS
11 38 (9.48%) Amazon SQS
12 33 (8.23%) SaaS
13 30 (7.48%) dbt
13 30 (7.48%) Snowflake
14 23 (5.74%) IaaS
15 22 (5.49%) Azure AKS
15 22 (5.49%) PaaS
16 19 (4.74%) GitHub
17 17 (4.24%) MinIO
Communications & Networking
1 27 (6.73%) Firewall
2 18 (4.49%) DNS
3 15 (3.74%) Network Security
4 8 (2.00%) VPN
5 6 (1.50%) DHCP
5 6 (1.50%) SAN
6 5 (1.25%) BGP
6 5 (1.25%) TCP/IP
7 4 (1.00%) Internet
7 4 (1.00%) Intrusion Detection
7 4 (1.00%) OpenLDAP
8 3 (0.75%) HTTPS
8 3 (0.75%) SSL
9 2 (0.50%) DKIM
9 2 (0.50%) DMARC
9 2 (0.50%) Ethernet
9 2 (0.50%) HTTP
9 2 (0.50%) SMTP
10 1 (0.25%) Broadband
10 1 (0.25%) Unified Communications
Database & Business Intelligence
1 47 (11.72%) Big Data
2 37 (9.23%) Amazon RDS
3 36 (8.98%) Amazon Redshift
4 33 (8.23%) Dremio
5 30 (7.48%) Amazon Athena
5 30 (7.48%) Apache Arrow
5 30 (7.48%) Data Lake
6 19 (4.74%) SQL Server
7 17 (4.24%) Hadoop
7 17 (4.24%) Presto
8 16 (3.99%) Elasticsearch
9 13 (3.24%) MySQL
10 9 (2.24%) MongoDB
11 7 (1.75%) RDBMS
11 7 (1.75%) Relational Database
12 5 (1.25%) PostgreSQL
13 4 (1.00%) Amazon Aurora
13 4 (1.00%) MariaDB
13 4 (1.00%) NoSQL
14 3 (0.75%) Redis
Development Applications
1 105 (26.18%) Jenkins
2 58 (14.46%) Artifactory
3 36 (8.98%) Git
4 34 (8.48%) GitLab
5 20 (4.99%) Atlassian Bamboo
6 15 (3.74%) TeamCity
7 14 (3.49%) JIRA
8 11 (2.74%) Octopus Deploy
9 10 (2.49%) SonarQube
10 7 (1.75%) Sonatype Nexus
11 5 (1.25%) CircleCI
12 3 (0.75%) Travis CI
13 2 (0.50%) Gatling
13 2 (0.50%) git-flow
13 2 (0.50%) JUnit
13 2 (0.50%) LoadRunner
13 2 (0.50%) Spinnaker
14 1 (0.25%) Bitbucket
14 1 (0.25%) Team Foundation Server
14 1 (0.25%) Vagrant
General
1 115 (28.68%) Finance
2 64 (15.96%) Social Skills
3 36 (8.98%) Front Office
4 31 (7.73%) Banking
5 29 (7.23%) Public Sector
6 21 (5.24%) Analytical Skills
7 19 (4.74%) Legal
8 16 (3.99%) Law
9 12 (2.99%) Inclusion and Diversity
10 8 (2.00%) Retail
11 5 (1.25%) Presentation Skills
12 4 (1.00%) Investment Banking
12 4 (1.00%) Pharmaceutical
13 3 (0.75%) Games
14 2 (0.50%) Back Office
14 2 (0.50%) Health Technology
14 2 (0.50%) Marketing
15 1 (0.25%) Advertising
15 1 (0.25%) Manufacturing
Job Titles
1 132 (32.92%) Site Reliability Engineer
2 100 (24.94%) DevOps Engineer
3 86 (21.45%) Site Engineer
4 83 (20.70%) Senior
5 80 (19.95%) AWS Engineer
6 47 (11.72%) Big Data Engineer
7 44 (10.97%) Kubernetes Engineer
8 43 (10.72%) AWS DevOps
8 43 (10.72%) AWS DevOps Engineer
9 41 (10.22%) Cloud Engineer
10 30 (7.48%) Infrastructure Engineer
11 25 (6.23%) Azure Engineer
11 25 (6.23%) Platform Engineer
12 24 (5.99%) Senior Infrastructure Engineer
13 21 (5.24%) Cloud Infrastructure Engineer
13 21 (5.24%) Data Engineer
13 21 (5.24%) Senior Cloud Engineer
13 21 (5.24%) Software Engineer
14 19 (4.74%) Lead
15 18 (4.49%) Cloud Platform Engineer
Libraries, Frameworks & Software Standards
1 36 (8.98%) J2EE
2 30 (7.48%) gRPC
2 30 (7.48%) Protocol Buffers
3 20 (4.99%) YAML
4 19 (4.74%) ARM Templates
4 19 (4.74%) Elastic Stack
5 18 (4.49%) RabbitMQ
6 17 (4.24%) ActiveMQ
6 17 (4.24%) Apache NiFi
7 11 (2.74%) .NET
7 11 (2.74%) Node.js
7 11 (2.74%) REST
7 11 (2.74%) Spring
8 10 (2.49%) JSON
9 8 (2.00%) GraphQL
10 6 (1.50%) Azure Blueprints
10 6 (1.50%) Hibernate
10 6 (1.50%) React
11 5 (1.25%) ADO
12 4 (1.00%) Web Services
Miscellaneous
1 42 (10.47%) Hybrid Cloud
2 38 (9.48%) Hedge funds
3 37 (9.23%) Public Cloud
3 37 (9.23%) Tandem
4 34 (8.48%) Clustering
5 23 (5.74%) Cloud Native
6 18 (4.49%) Algorithms
7 16 (3.99%) Data Structures
8 13 (3.24%) Data Centre
9 12 (2.99%) Management Information System
10 11 (2.74%) Enterprise Software
11 8 (2.00%) Distributed Systems
11 8 (2.00%) Product Ownership
11 8 (2.00%) Self-Motivation
12 6 (1.50%) Greenfield Project
12 6 (1.50%) Hackathon
12 6 (1.50%) Replication
13 5 (1.25%) Linux Command Line
14 4 (1.00%) Enterprise Cloud
14 4 (1.00%) Legacy Code
Operating Systems
1 114 (28.43%) Linux
2 56 (13.97%) Windows
3 17 (4.24%) Windows Server
4 14 (3.49%) Unix
5 10 (2.49%) Red Hat Enterprise Linux
6 5 (1.25%) VMS
7 4 (1.00%) Oracle Linux
8 3 (0.75%) Amazon Linux
8 3 (0.75%) Windows Server 2008
8 3 (0.75%) Windows Server 2019
9 2 (0.50%) CentOS
9 2 (0.50%) Solaris
9 2 (0.50%) Windows 10
9 2 (0.50%) Windows Server 2016
10 1 (0.25%) Android
10 1 (0.25%) Apple iOS
10 1 (0.25%) Ubuntu
10 1 (0.25%) Windows Server 2012
Processes & Methodologies
1 257 (64.09%) DevOps
2 174 (43.39%) CI/CD
3 126 (31.42%) Agile
4 121 (30.17%) Infrastructure as Code
5 103 (25.69%) Software Engineering
6 80 (19.95%) Problem-Solving
7 70 (17.46%) Containerisation
8 69 (17.21%) Asset Management
9 65 (16.21%) Mentoring
10 61 (15.21%) Continuous Improvement
11 57 (14.21%) Decision-Making
12 55 (13.72%) Deployment Automation
13 46 (11.47%) Microservices
14 45 (11.22%) Coaching
15 44 (10.97%) Roadmaps
16 43 (10.72%) Open Source
17 42 (10.47%) Investment Management
18 40 (9.98%) Infrastructure Engineering
19 37 (9.23%) ITIL
20 36 (8.98%) Financial Modelling
Programming Languages
1 180 (44.89%) Python
2 123 (30.67%) Java
3 97 (24.19%) Go
4 73 (18.20%) Bash
5 66 (16.46%) PowerShell
6 48 (11.97%) JavaScript
7 30 (7.48%) SQL
8 29 (7.23%) C#
9 23 (5.74%) Bicep
9 23 (5.74%) Shell Script
10 17 (4.24%) TypeScript
11 6 (1.50%) Scala
12 5 (1.25%) C
12 5 (1.25%) Ruby
13 4 (1.00%) Groovy
14 2 (0.50%) PHP
15 1 (0.25%) C++
15 1 (0.25%) Perl
15 1 (0.25%) PL/SQL
15 1 (0.25%) Rust
Qualifications
1 41 (10.22%) Security Cleared
2 39 (9.73%) Degree
3 23 (5.74%) DV Cleared
4 18 (4.49%) Azure Certification
5 16 (3.99%) SC Cleared
6 14 (3.49%) AWS Certification
7 11 (2.74%) AWS Certified Developer
7 11 (2.74%) AWS Certified Solutions Architect
7 11 (2.74%) Computer Science Degree
8 9 (2.24%) Master's Degree
9 7 (1.75%) Numerate Degree
10 2 (0.50%) CISSP
10 2 (0.50%) Microsoft Certification
11 1 (0.25%) (ISC)2 CCSP
11 1 (0.25%) CISA
11 1 (0.25%) Cisco Certification
11 1 (0.25%) CISM
11 1 (0.25%) CRISC
11 1 (0.25%) MCP
11 1 (0.25%) MCSE
Quality Assurance & Compliance
1 19 (4.74%) ISO/IEC 27001
2 15 (3.74%) QA
3 9 (2.24%) SLA
4 4 (1.00%) HIPAA
4 4 (1.00%) PCI DSS
5 3 (0.75%) Cyber Essentials
6 2 (0.50%) GDPR
6 2 (0.50%) NIST
7 1 (0.25%) ISO 9001
System Software
1 143 (35.66%) Docker
2 24 (5.99%) Active Directory
3 20 (4.99%) VMware Infrastructure
4 8 (2.00%) KVM
5 6 (1.50%) DFS Replication
5 6 (1.50%) Virtual Machines
6 3 (0.75%) Ceph
7 1 (0.25%) Hyper-V
7 1 (0.25%) Microsoft Virtual Server
7 1 (0.25%) NFS
7 1 (0.25%) Virtual Desktop
7 1 (0.25%) Virtual Servers
7 1 (0.25%) VMware ESXi
Systems Management
1 217 (54.11%) Kubernetes
2 213 (53.12%) Terraform
3 84 (20.95%) Ansible
4 58 (14.46%) Prometheus
5 28 (6.98%) Grafana
6 18 (4.49%) HAProxy
7 12 (2.99%) Istio
7 12 (2.99%) Puppet
8 8 (2.00%) Progress Chef
9 7 (1.75%) Active Directory Federation Services
10 6 (1.50%) NetBackup
10 6 (1.50%) vRealize Orchestrator
11 5 (1.25%) Salt
12 4 (1.00%) Single Sign-On
13 3 (0.75%) Kibana
13 3 (0.75%) Packer
14 2 (0.50%) Argo
14 2 (0.50%) Docker Swarm
14 2 (0.50%) Microsoft Intune
14 2 (0.50%) ZABBIX
Vendors
1 48 (11.97%) Microsoft
2 33 (8.23%) VMware
3 23 (5.74%) Google
4 14 (3.49%) Red Hat
5 13 (3.24%) ServiceNow
6 12 (2.99%) Cisco
7 10 (2.49%) Citrix
8 7 (1.75%) Oracle
8 7 (1.75%) Splunk
8 7 (1.75%) Veeam
9 6 (1.50%) Juniper
10 4 (1.00%) New Relic
10 4 (1.00%) PagerDuty
10 4 (1.00%) Serena
11 3 (0.75%) AppDynamics
11 3 (0.75%) Dynatrace
11 3 (0.75%) LogicMonitor
12 2 (0.50%) F5
12 2 (0.50%) Palo Alto
12 2 (0.50%) SaltStack