Amazon S3 Jobs in London

Amazon Simple Storage Service (S3)
England > London

The table below provides summary statistics for permanent job vacancies advertised in London requiring Amazon S3 skills. It includes a benchmarking guide to the annual salaries offered in vacancies that cited Amazon S3 over the 6 months leading up to 30 May 2025, comparing them to the same period in the previous two years.

6 months to
30 May 2025
Same period 2024 Same period 2023
Rank 225 288 294
Rank change year-on-year +63 +6 -101
Permanent jobs citing Amazon S3 180 237 370
As % of all permanent jobs advertised in London 1.42% 0.99% 1.13%
As % of the Cloud Services category 3.25% 2.29% 2.24%
Number of salaries quoted 84 168 241
10th Percentile £53,250 £62,125 £58,750
25th Percentile £60,000 £73,438 £66,750
Median annual salary (50th Percentile) £75,000 £86,250 £85,000
Median % change year-on-year -13.04% +1.47% +6.25%
75th Percentile £89,375 £108,125 £105,000
90th Percentile £98,375 £138,750 £130,000
England median annual salary £72,500 £80,000 £75,000
% change year-on-year -9.38% +6.67% -6.25%

All Cloud Skills
London

Amazon S3 falls under the Cloud Services category. For comparison with the information above, the following table provides summary statistics for all permanent job vacancies requiring cloud computing skills in London.

Permanent vacancies with a requirement for cloud computing skills 5,538 10,359 16,536
As % of all permanent jobs advertised in London 43.64% 43.21% 50.45%
Number of salaries quoted 3,799 8,089 12,242
10th Percentile £42,500 £41,250 £42,500
25th Percentile £56,250 £55,000 £55,000
Median annual salary (50th Percentile) £75,000 £75,000 £75,000
75th Percentile £100,000 £96,250 £96,250
90th Percentile £120,000 £118,750 £115,000
England median annual salary £60,000 £57,500 £65,000
% change year-on-year +4.35% -11.54% +4.00%

Amazon S3
Job Vacancy Trend in London

Job postings citing Amazon S3 as a proportion of all IT jobs advertised in London.
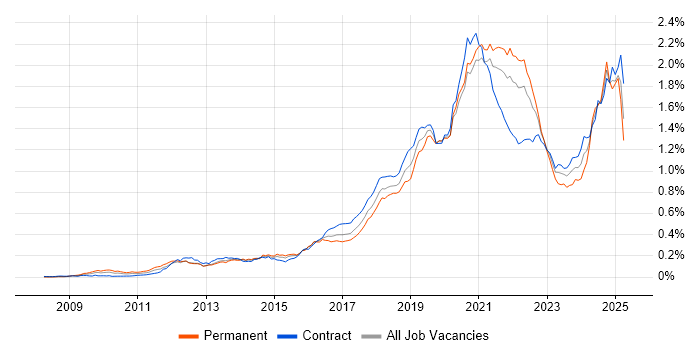
Job vacancy trend for Amazon S3 in London

Amazon S3
Salary Trend in London

3-month moving average salary quoted in jobs citing Amazon S3 in London.

Salary trend for Amazon S3 in London

Amazon S3
Salary Histogram in London

Salary distribution for jobs citing Amazon S3 in London over the 6 months to 30 May 2025.

Salary histogram for Amazon S3 in London

Amazon S3
Job Locations in London

The table below looks at the demand and provides a guide to the median salaries quoted in IT jobs citing Amazon S3 within the London region over the 6 months to 30 May 2025. The 'Rank Change' column provides an indication of the change in demand within each location based on the same 6 month period last year.

Location Rank Change
on Same Period
Last Year
Matching
Permanent
IT Job Ads
Median Salary
Past 6 Months
Median Salary
% Change
on Same Period
Last Year
Live
Jobs
South London - 22 - - 1
Central London +3 20 £77,500 -6.06% 13
West London +30 13 £63,500 -5.93% 30
East London - 7 £92,500 -
North London - 2 - -
Amazon S3
England

Amazon S3
Co-occurring Skills and Capabilities in London by Category

The follow tables expand on the table above by listing co-occurrences grouped by category. The same employment type, locality and period is covered with up to 20 co-occurrences shown in each of the following categories:

Application Platforms
1 12 (6.67%) Apache Airflow
2 6 (3.33%) Apache Spark
2 6 (3.33%) OpenStack
3 5 (2.78%) Apache
3 5 (2.78%) SAS
4 3 (1.67%) Confluence
4 3 (1.67%) Microsoft Exchange
4 3 (1.67%) SharePoint
4 3 (1.67%) WordPress
5 1 (0.56%) nginx
Applications
1 5 (2.78%) Microsoft Office
2 4 (2.22%) Mozilla Thunderbird
3 1 (0.56%) Adobe XD
3 1 (0.56%) Microsoft Excel
3 1 (0.56%) Microsoft PowerPoint
3 1 (0.56%) MS Visio
Business Applications
1 6 (3.33%) SimCorp Dimension
Cloud Services
1 174 (96.67%) AWS
2 129 (71.67%) Serverless
3 122 (67.78%) AWS Lambda
4 85 (47.22%) Amazon EC2
5 40 (22.22%) AWS Step Functions
6 30 (16.67%) Amazon EKS
7 26 (14.44%) Amazon ECS
8 25 (13.89%) AWS CloudFormation
8 25 (13.89%) Datadog
9 21 (11.67%) Amazon SQS
10 19 (10.56%) Virtual Private Cloud
11 17 (9.44%) Amazon Kinesis
11 17 (9.44%) GitHub
12 15 (8.33%) Amazon CloudWatch
12 15 (8.33%) Cloud Computing
13 12 (6.67%) GitHub Actions
13 12 (6.67%) Snowflake
14 11 (6.11%) Azure
15 9 (5.00%) Amazon GuardDuty
15 9 (5.00%) GCP
Communications & Networking
1 27 (15.00%) Broadband
2 8 (4.44%) SSL
2 8 (4.44%) VPN
3 5 (2.78%) Firewall
3 5 (2.78%) MQTT
3 5 (2.78%) SMS
4 4 (2.22%) LAN
4 4 (2.22%) Wi-Fi
5 3 (1.67%) Bluetooth
5 3 (1.67%) DNS
6 2 (1.11%) Internet
7 1 (0.56%) Cisco IOS
7 1 (0.56%) Value-Added Service
Database & Business Intelligence
1 65 (36.11%) DynamoDB
2 52 (28.89%) Amazon RDS
3 31 (17.22%) Amazon Redshift
3 31 (17.22%) Elasticsearch
3 31 (17.22%) NoSQL
4 24 (13.33%) PostgreSQL
5 20 (11.11%) Data Warehouse
6 19 (10.56%) Amazon Athena
7 17 (9.44%) Data Lake
8 10 (5.56%) MySQL
9 9 (5.00%) Relational Database
10 8 (4.44%) MongoDB
11 7 (3.89%) Amazon QuickSight
11 7 (3.89%) SQL Server
11 7 (3.89%) Tableau
12 6 (3.33%) Amazon Aurora
12 6 (3.33%) Hadoop
12 6 (3.33%) Redis
13 5 (2.78%) Apache Hive
13 5 (2.78%) Data Mining
Development Applications
1 53 (29.44%) Jenkins
2 46 (25.56%) Git
3 25 (13.89%) GitLab
4 18 (10.00%) JUnit
5 15 (8.33%) Cucumber
5 15 (8.33%) Maven
6 14 (7.78%) IntelliJ
6 14 (7.78%) Mockito
7 13 (7.22%) CircleCI
8 8 (4.44%) JIRA
9 4 (2.22%) Bitbucket
9 4 (2.22%) Bitbucket Server
10 2 (1.11%) Artifactory
10 2 (1.11%) Spinnaker
11 1 (0.56%) Android Studio
11 1 (0.56%) Appium
11 1 (0.56%) Charles Proxy
11 1 (0.56%) Locust
11 1 (0.56%) Selenium
11 1 (0.56%) SonarQube
General
1 71 (39.44%) Finance
2 51 (28.33%) Social Skills
3 31 (17.22%) Banking
4 18 (10.00%) Analytical Skills
5 16 (8.89%) Inclusion and Diversity
6 10 (5.56%) Marketing
7 7 (3.89%) Financial Institution
7 7 (3.89%) Presentation Skills
8 6 (3.33%) Investment Banking
8 6 (3.33%) Law
9 5 (2.78%) Games
9 5 (2.78%) Legal
9 5 (2.78%) Organisational Skills
9 5 (2.78%) Retail Banking
10 4 (2.22%) Advertising
11 3 (1.67%) Music Industry
11 3 (1.67%) Publishing
11 3 (1.67%) Tech for Good
12 2 (1.11%) Health Technology
12 2 (1.11%) Influencing Skills
Job Titles
1 92 (51.11%) Developer
2 78 (43.33%) Senior
3 57 (31.67%) AWS Developer
4 54 (30.00%) Senior Developer
5 26 (14.44%) Data Engineer
6 24 (13.33%) Java Developer
7 22 (12.22%) AWS Engineer
8 18 (10.00%) Senior Java Developer
9 17 (9.44%) Python Developer
10 16 (8.89%) AWS DevOps
11 15 (8.33%) Lead
11 15 (8.33%) Senior DevOps
12 14 (7.78%) DevOps Developer
12 14 (7.78%) Full-Stack Developer
12 14 (7.78%) Java Pricing Developer
12 14 (7.78%) Pricing Developer
13 12 (6.67%) AWS Data Engineer
13 12 (6.67%) Senior Data Engineer
13 12 (6.67%) Software Engineer
14 9 (5.00%) React Developer
Libraries, Frameworks & Software Standards
1 54 (30.00%) React
2 42 (23.33%) GraphQL
3 31 (17.22%) RESTful
4 28 (15.56%) Kafka
5 27 (15.00%) Serverless Framework
6 23 (12.78%) Spring
7 22 (12.22%) Spring Boot
8 14 (7.78%) ActiveMQ
8 14 (7.78%) JMS
8 14 (7.78%) RabbitMQ
9 13 (7.22%) gRPC
9 13 (7.22%) Node.js
10 11 (6.11%) REST
11 10 (5.56%) WebSockets
12 9 (5.00%) Django
12 9 (5.00%) Elastic Stack
13 8 (4.44%) .NET
13 8 (4.44%) PySpark
13 8 (4.44%) web3js
14 7 (3.89%) CSS
Miscellaneous
1 31 (17.22%) Cloud Native
2 17 (9.44%) Management Information System
3 14 (7.78%) Credit Derivative
3 14 (7.78%) Enterprise Software
4 10 (5.56%) Distributed Applications
5 9 (5.00%) Algorithms
6 8 (4.44%) Blockchain
6 8 (4.44%) Web3
7 6 (3.33%) Data Structures
7 6 (3.33%) Distributed Systems
7 6 (3.33%) Greenfield Project
8 5 (2.78%) Legacy Systems
8 5 (2.78%) Product Ownership
8 5 (2.78%) Public Cloud
9 4 (2.22%) Fixed Income
9 4 (2.22%) IoT
9 4 (2.22%) iPad
9 4 (2.22%) Mobile App
9 4 (2.22%) Onboarding
10 3 (1.67%) Equities
Operating Systems
1 36 (20.00%) Linux
2 7 (3.89%) Ubuntu
3 5 (2.78%) Windows
4 4 (2.22%) Mac OS
5 1 (0.56%) Android
5 1 (0.56%) Apple iOS
5 1 (0.56%) Debian
5 1 (0.56%) Windows 10
Processes & Methodologies
1 111 (61.67%) CI/CD
2 81 (45.00%) Agile
3 50 (27.78%) DevOps
3 50 (27.78%) Mentoring
4 47 (26.11%) Event-Driven
5 45 (25.00%) Continuous Integration
6 44 (24.44%) Infrastructure as Code
7 42 (23.33%) Analytics
8 41 (22.78%) Software Engineering
9 38 (21.11%) Artificial Intelligence
10 37 (20.56%) Containerisation
10 37 (20.56%) ETL
11 36 (20.00%) Event-Driven Architecture
12 32 (17.78%) Clean Code
13 31 (17.22%) SDLC
14 29 (16.11%) Data Pipeline
15 26 (14.44%) Microservices
16 24 (13.33%) Full-Stack Development
17 23 (12.78%) Problem-Solving
18 21 (11.67%) Data Engineering
Programming Languages
1 107 (59.44%) Python
2 54 (30.00%) JavaScript
3 49 (27.22%) TypeScript
4 47 (26.11%) SQL
5 39 (21.67%) Java
6 17 (9.44%) C++
7 14 (7.78%) Go
8 9 (5.00%) Scala
9 8 (4.44%) C#
10 7 (3.89%) Bash
11 6 (3.33%) R
12 5 (2.78%) MATLAB
12 5 (2.78%) PHP
13 4 (2.22%) PowerShell
13 4 (2.22%) Shell Script
14 3 (1.67%) C
14 3 (1.67%) Ladder Logic
15 1 (0.56%) Groovy
15 1 (0.56%) Ruby
15 1 (0.56%) T-SQL
Qualifications
1 40 (22.22%) AWS Certification
2 17 (9.44%) Degree
3 12 (6.67%) Computer Science Degree
4 7 (3.89%) Security Cleared
5 4 (2.22%) AWS Certified Solutions Architect
5 4 (2.22%) SC Cleared
6 3 (1.67%) AWS Certified Developer
6 3 (1.67%) Master's Degree
7 2 (1.11%) (ISC)2 CCSP
7 2 (1.11%) Cisco Certification
7 2 (1.11%) DV Cleared
8 1 (0.56%) AWS Certified DevOps Engineer
8 1 (0.56%) AWS Certified SysOps Administrator
8 1 (0.56%) CBAP
8 1 (0.56%) CCSK
8 1 (0.56%) PhD
8 1 (0.56%) PMI Certification
8 1 (0.56%) PMP
8 1 (0.56%) SnowPro
Quality Assurance & Compliance
1 8 (4.44%) QA
2 3 (1.67%) Data Quality
2 3 (1.67%) GDPR
3 2 (1.11%) Accessibility
3 2 (1.11%) HIPAA
3 2 (1.11%) ISO/IEC 27001
3 2 (1.11%) NIST
3 2 (1.11%) PCI DSS
3 2 (1.11%) SLA
4 1 (0.56%) Sarbanes-Oxley
4 1 (0.56%) SEPA
4 1 (0.56%) SOC 2
System Software
1 51 (28.33%) Docker
2 8 (4.44%) Active Directory
2 8 (4.44%) Virtual Desktop
3 5 (2.78%) Apache Flume
4 4 (2.22%) Virtual Machines
Systems Management
1 55 (30.56%) Terraform
2 38 (21.11%) Kubernetes
3 21 (11.67%) Ansible
4 13 (7.22%) Prometheus
5 6 (3.33%) Grafana
5 6 (3.33%) Single Sign-On
6 5 (2.78%) Oozie
7 4 (2.22%) Nessus
7 4 (2.22%) Proxmox
8 3 (1.67%) Kibana
9 2 (1.11%) logstash
10 1 (0.56%) Argo
10 1 (0.56%) Bugsnag
10 1 (0.56%) Istio
10 1 (0.56%) Progress Chef
10 1 (0.56%) Puppet
Vendors
1 14 (7.78%) IBM
2 11 (6.11%) Google
3 10 (5.56%) Oracle
4 8 (4.44%) Microsoft
5 6 (3.33%) Databricks
5 6 (3.33%) SimCorp
5 6 (3.33%) Splunk
6 5 (2.78%) Cloudera
6 5 (2.78%) Intel
7 4 (2.22%) Apple
7 4 (2.22%) Cisco
7 4 (2.22%) HubSpot
7 4 (2.22%) Juniper
7 4 (2.22%) Meraki
7 4 (2.22%) Zscaler
8 3 (1.67%) Concur
8 3 (1.67%) SAP
8 3 (1.67%) Siemens
9 2 (1.11%) Atlassian
9 2 (1.11%) Okta