Root Cause Analysis Jobs in London

Root Cause Analysis
England > London

The following table provides summary statistics for permanent job vacancies advertised in London with a requirement for Root Cause Analysis skills. Included is a benchmarking guide to the salaries offered in vacancies that have cited Root Cause Analysis over the 6 months to 7 May 2024 with a comparison to the same period in the previous 2 years.

6 months to
7 May 2024
Same period 2023 Same period 2022
Rank 238 351 407
Rank change year-on-year +113 +56 -16
Permanent jobs citing Root Cause Analysis 306 304 620
As % of all permanent jobs advertised in London 1.30% 0.88% 0.92%
As % of the Processes & Methodologies category 1.43% 0.93% 0.95%
Number of salaries quoted 126 195 263
10th Percentile £33,000 £35,375 £37,500
25th Percentile £51,250 £46,125 £47,500
Median annual salary (50th Percentile) £65,000 £67,275 £62,000
Median % change year-on-year -3.38% +8.51% +3.33%
75th Percentile £89,375 £89,852 £76,250
90th Percentile £110,000 £97,416 £92,000
England median annual salary £50,000 £55,000 £47,500
% change year-on-year -9.09% +15.79% -9.52%

All Process and Methodology Skills
London

Root Cause Analysis is in the Processes and Methodologies category. The following table is for comparison with the above and provides summary statistics for all permanent job vacancies advertised in London with a requirement for process or methodology skills.

Permanent vacancies with a requirement for process or methodology skills 21,393 32,863 65,398
As % of all permanent jobs advertised in London 91.19% 95.33% 96.93%
Number of salaries quoted 15,920 23,589 34,129
10th Percentile £37,800 £43,750 £42,500
25th Percentile £51,750 £55,000 £53,750
Median annual salary (50th Percentile) £70,037 £75,000 £70,000
Median % change year-on-year -6.62% +7.14% -
75th Percentile £95,000 £95,000 £92,500
90th Percentile £115,000 £115,000 £111,250
England median annual salary £55,000 £62,500 £60,000
% change year-on-year -12.00% +4.17% +9.09%

Root Cause Analysis
Job Vacancy Trend in London

Job postings citing Root Cause Analysis as a proportion of all IT jobs advertised in London.
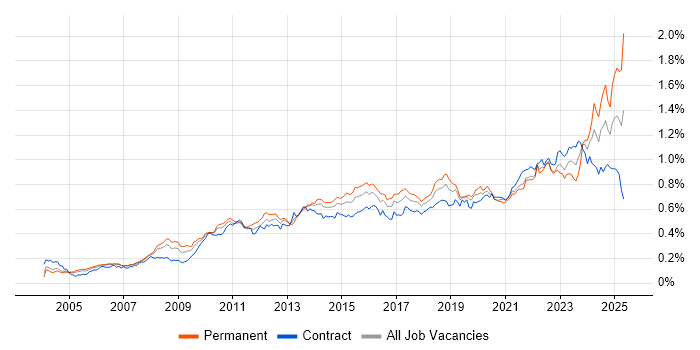
Job vacancy trend for Root Cause Analysis in London

Root Cause Analysis
Salary Trend in London

3-month moving average salary quoted in jobs citing Root Cause Analysis in London.

Salary trend for Root Cause Analysis in London

Root Cause Analysis
Salary Histogram in London

Salary distribution for jobs citing Root Cause Analysis in London over the 6 months to 7 May 2024.

Salary histogram for Root Cause Analysis in London

Root Cause Analysis
Job Locations in London

The table below looks at the demand and provides a guide to the median salaries quoted in IT jobs citing Root Cause Analysis within the London region over the 6 months to 7 May 2024. The 'Rank Change' column provides an indication of the change in demand within each location based on the same 6 month period last year.

Location Rank Change
on Same Period
Last Year
Matching
Permanent
IT Job Ads
Median Salary
Past 6 Months
Median Salary
% Change
on Same Period
Last Year
Live
Jobs
Central London +91 86 £61,500 +53.75% 17
South London -7 2 £53,750 -20.37% 3
West London -11 1 £55,000 -4.35% 3
Root Cause Analysis
England

Root Cause Analysis
Co-occurring Skills and Capabilities in London by Category

The follow tables expand on the table above by listing co-occurrences grouped by category. The same employment type, locality and period is covered with up to 20 co-occurrences shown in each of the following categories:

Application Platforms
1 9 (2.94%) Microsoft Exchange
2 6 (1.96%) Confluence
3 5 (1.63%) JBoss
3 5 (1.63%) SharePoint
4 4 (1.31%) SAS
5 2 (0.65%) SharePoint Server
5 2 (0.65%) Skype for Business
6 1 (0.33%) Exchange Server 2010
Applications
1 4 (1.31%) Microsoft Office
1 4 (1.31%) Microsoft PowerPoint
2 2 (0.65%) Microsoft Excel
3 1 (0.33%) MS Visio
3 1 (0.33%) Windchill
Business Applications
1 9 (2.94%) Dynamics CRM
2 5 (1.63%) Temenos T24
3 3 (0.98%) NEC Housing
4 2 (0.65%) SAP Business One
5 1 (0.33%) Endur
5 1 (0.33%) Remedy ITSM
5 1 (0.33%) Workday HCM
Cloud Services
1 113 (36.93%) AWS
2 55 (17.97%) Azure
3 29 (9.48%) Microsoft 365
4 17 (5.56%) Power Platform
5 15 (4.90%) Azure DevOps
5 15 (4.90%) Azure Functions
5 15 (4.90%) Serverless
6 14 (4.58%) GCP
7 11 (3.59%) Entra ID
8 10 (3.27%) Power Automate
8 10 (3.27%) PowerApps
9 9 (2.94%) Azure Logic Apps
10 8 (2.61%) Mimecast
11 7 (2.29%) Azure Storage
11 7 (2.29%) Dynamics 365
12 6 (1.96%) Azure AKS
12 6 (1.96%) Azure App Service
12 6 (1.96%) Azure Monitor
12 6 (1.96%) Azure Service Bus
12 6 (1.96%) SaaS
Communications & Networking
1 15 (4.90%) DNS
2 13 (4.25%) Firewall
2 13 (4.25%) LAN
2 13 (4.25%) VPN
2 13 (4.25%) WAN
3 12 (3.92%) Wireless
4 11 (3.59%) DHCP
4 11 (3.59%) Network Security
4 11 (3.59%) TCP/IP
5 10 (3.27%) VLAN
6 8 (2.61%) Internet
6 8 (2.61%) VoIP
7 6 (1.96%) Skype
8 5 (1.63%) Cisco Firepower
8 5 (1.63%) Cisco Nexus
8 5 (1.63%) F5 BIG-IP GTM
8 5 (1.63%) F5 BIG-IP LTM
8 5 (1.63%) SSL
8 5 (1.63%) Unified Communications
8 5 (1.63%) Wi-Fi
Database & Business Intelligence
1 117 (38.24%) Tableau
2 15 (4.90%) Power BI
3 14 (4.58%) SQL Server
4 8 (2.61%) MySQL
4 8 (2.61%) NoSQL
4 8 (2.61%) SQL Server Integration Services
5 6 (1.96%) Relational Database
6 5 (1.63%) Azure SQL Database
7 2 (0.65%) Base SAS
7 2 (0.65%) Metadata
7 2 (0.65%) PostgreSQL
7 2 (0.65%) RDBMS
7 2 (0.65%) Redis
8 1 (0.33%) Apache Cassandra
8 1 (0.33%) Dremio
8 1 (0.33%) Elasticsearch
8 1 (0.33%) InfluxDB
8 1 (0.33%) MariaDB
Development Applications
1 121 (39.54%) Git
2 15 (4.90%) Jenkins
3 12 (3.92%) JIRA
4 5 (1.63%) DTrace
4 5 (1.63%) GDB
4 5 (1.63%) Postman
5 3 (0.98%) Cucumber
5 3 (0.98%) TeamCity
6 2 (0.65%) REST Assured
7 1 (0.33%) Appium
7 1 (0.33%) GitLab
7 1 (0.33%) Gradle
7 1 (0.33%) JMeter
7 1 (0.33%) JUnit
7 1 (0.33%) Maven
7 1 (0.33%) Mocha
7 1 (0.33%) mountebank
7 1 (0.33%) Sinon.JS
7 1 (0.33%) Subversion
7 1 (0.33%) Team Foundation Server
General
1 213 (69.61%) Social Skills
2 109 (35.62%) Analytical Skills
3 93 (30.39%) Presentation Skills
4 85 (27.78%) Retail
5 55 (17.97%) Finance
6 30 (9.80%) Inclusion and Diversity
7 24 (7.84%) Banking
8 9 (2.94%) Law
9 8 (2.61%) Legal
10 6 (1.96%) Investment Banking
10 6 (1.96%) Public Sector
11 5 (1.63%) Automotive
12 3 (0.98%) German Language
12 3 (0.98%) Marketing
13 2 (0.65%) Influencing Skills
13 2 (0.65%) Manufacturing
13 2 (0.65%) Organisational Skills
13 2 (0.65%) Tech for Good
14 1 (0.33%) Back Office
14 1 (0.33%) General Ledger
Job Titles
1 116 (37.91%) Senior
2 113 (36.93%) Analyst
3 84 (27.45%) Data Analyst
4 65 (21.24%) Senior Analyst
5 55 (17.97%) Senior Data Analyst
6 35 (11.44%) Data Scientist
6 35 (11.44%) Lead
6 35 (11.44%) Senior Data Scientist
7 30 (9.80%) Audit Manager
8 26 (8.50%) Lead Data Analyst
9 21 (6.86%) Support Engineer
10 19 (6.21%) Quality Manager
11 17 (5.56%) Applications Support
12 15 (4.90%) Support Analyst
13 14 (4.58%) Senior Audit Manager
13 14 (4.58%) Senior Manager
14 11 (3.59%) Site Engineer
14 11 (3.59%) Site Reliability Engineer
14 11 (3.59%) Technical Support
15 10 (3.27%) Developer
Libraries, Frameworks & Software Standards
1 35 (11.44%) Pandas
1 35 (11.44%) PySpark
1 35 (11.44%) scikit-learn
1 35 (11.44%) TensorFlow
2 11 (3.59%) .NET
3 9 (2.94%) REST
4 8 (2.61%) Web Services
5 7 (2.29%) ADSI
5 7 (2.29%) LDAP
6 6 (1.96%) ARM Templates
7 5 (1.63%) FIX Protocol
7 5 (1.63%) HTML5 Canvas
8 4 (1.31%) HTML
9 3 (0.98%) CSS
9 3 (0.98%) XML
10 2 (0.65%) .NET Framework
10 2 (0.65%) AngularJS
10 2 (0.65%) SailPoint
10 2 (0.65%) Twitter Bootstrap
11 1 (0.33%) Kafka
Miscellaneous
1 37 (12.09%) Algorithms
2 18 (5.88%) Management Information System
3 14 (4.58%) Onboarding
4 9 (2.94%) Housing Association
5 8 (2.61%) Security Posture
6 7 (2.29%) Cloud Security Posture
6 7 (2.29%) Data Centre
7 6 (1.96%) Foreign Exchange (FX)
7 6 (1.96%) Linux Command Line
8 5 (1.63%) Client/Server
8 5 (1.63%) Distributed Denial-of-Service
8 5 (1.63%) Equities
8 5 (1.63%) Fixed Income
8 5 (1.63%) Hedge funds
8 5 (1.63%) Low-Code
8 5 (1.63%) Public Cloud
9 4 (1.31%) Cyber Security Posture
9 4 (1.31%) Market Risk
10 3 (0.98%) Replication
11 2 (0.65%) Clustering
Operating Systems
1 47 (15.36%) Windows
2 27 (8.82%) Linux
3 17 (5.56%) Windows Server
4 16 (5.23%) Unix
5 10 (3.27%) Android
6 7 (2.29%) Mac OS X
7 6 (1.96%) AIX
8 5 (1.63%) Windows Server 2016
9 4 (1.31%) Windows 7
9 4 (1.31%) Windows Server 2008
9 4 (1.31%) Windows Server 2019
10 3 (0.98%) Apple iOS
10 3 (0.98%) CentOS
10 3 (0.98%) Windows 10
11 2 (0.65%) Oracle Linux
11 2 (0.65%) Red Hat Enterprise Linux
11 2 (0.65%) Solaris
11 2 (0.65%) Windows Server 2012
12 1 (0.33%) Mac OS
Processes & Methodologies
1 149 (48.69%) Problem-Solving
2 119 (38.89%) Actionable Insight
3 117 (38.24%) Mathematics
4 116 (37.91%) Statistics
4 116 (37.91%) Storytelling
4 116 (37.91%) Visualisation
5 93 (30.39%) Data Analysis
6 87 (28.43%) Analytics
7 85 (27.78%) Data Pipeline
8 81 (26.47%) Customer Intelligence
8 81 (26.47%) Stakeholder Engagement
9 79 (25.82%) Business Strategy
10 44 (14.38%) Continuous Improvement
10 44 (14.38%) Decision-Making
11 43 (14.05%) Artificial Intelligence
12 39 (12.75%) Customer Experience
13 35 (11.44%) Data Science
13 35 (11.44%) Generative AI
13 35 (11.44%) MLOps
13 35 (11.44%) Neural Network
Programming Languages
1 153 (50.00%) SQL
2 141 (46.08%) Python
3 29 (9.48%) PowerShell
4 19 (6.21%) Java
5 11 (3.59%) C#
6 9 (2.94%) Bash
6 9 (2.94%) JavaScript
7 8 (2.61%) PL/SQL
7 8 (2.61%) T-SQL
8 5 (1.63%) C
8 5 (1.63%) OCaml
8 5 (1.63%) Shell Script
8 5 (1.63%) SystemTap
9 4 (1.31%) C++
10 2 (0.65%) Go
10 2 (0.65%) SAS Macro
11 1 (0.33%) BeanShell
11 1 (0.33%) Kotlin
11 1 (0.33%) Perl
11 1 (0.33%) Swift
Qualifications
1 156 (50.98%) Degree
2 116 (37.91%) DBS Check
3 36 (11.76%) Master's Degree
4 16 (5.23%) Azure Certification
5 15 (4.90%) Computer Science Degree
6 13 (4.25%) Cisco Certification
7 9 (2.94%) CISSP
8 8 (2.61%) ACCA
8 8 (2.61%) Microsoft Certification
9 7 (2.29%) (ISC)2 CCSP
9 7 (2.29%) AWS Certification
9 7 (2.29%) AWS Certified Cloud Practitioner
10 6 (1.96%) CCNP
10 6 (1.96%) Security Cleared
11 4 (1.31%) ITIL Foundation Certificate
12 3 (0.98%) CISA
13 2 (0.65%) CEH
13 2 (0.65%) CISM
13 2 (0.65%) ITIL Certification
13 2 (0.65%) VCAP
Quality Assurance & Compliance
1 22 (7.19%) SLA
2 19 (6.21%) IFRS
3 14 (4.58%) ISO/IEC 27001
4 13 (4.25%) NIST
5 12 (3.92%) PCI DSS
6 8 (2.61%) QA
7 5 (1.63%) GRC
8 3 (0.98%) Accessibility
8 3 (0.98%) ISO 9001
9 2 (0.65%) HMG Security Policy Framework
9 2 (0.65%) MiFID
9 2 (0.65%) UCITS
10 1 (0.33%) Data Quality
10 1 (0.33%) PMO
System Software
1 32 (10.46%) Active Directory
2 16 (5.23%) Docker
3 9 (2.94%) Virtual Machines
4 6 (1.96%) VMware Infrastructure
5 3 (0.98%) NFS
6 2 (0.65%) vSphere
7 1 (0.33%) Ceph
7 1 (0.33%) Virtual Desktop
Systems Management
1 20 (6.54%) Kubernetes
2 16 (5.23%) Terraform
3 11 (3.59%) Ansible
4 7 (2.29%) Grafana
5 6 (1.96%) SCCM
6 3 (0.98%) Microsoft Intune
7 2 (0.65%) Kibana
7 2 (0.65%) Prometheus
8 1 (0.33%) HP SiteScope
8 1 (0.33%) Jamf Pro
8 1 (0.33%) Perfmon
Vendors
1 116 (37.91%) Databricks
2 65 (21.24%) Microsoft
3 15 (4.90%) ServiceNow
4 12 (3.92%) Google
5 10 (3.27%) Oracle
6 9 (2.94%) Cisco
6 9 (2.94%) Citrix
7 7 (2.29%) Apple
7 7 (2.29%) Bloomberg
8 6 (1.96%) VMware
9 5 (1.63%) CheckPoint
9 5 (1.63%) F5
9 5 (1.63%) Forcepoint
9 5 (1.63%) Remedy
9 5 (1.63%) SolarWinds
9 5 (1.63%) Splunk
9 5 (1.63%) Temenos
10 3 (0.98%) Intel
10 3 (0.98%) Meraki
10 3 (0.98%) Veeam