Self-Motivation Jobs in London

Self-Motivation
England > London

The table below looks at the prevalence of the term Self-Motivation in permanent job vacancies in London. Included is a benchmarking guide to the salaries offered in vacancies that cited Self-Motivation over the 6 months leading up to 15 May 2025, comparing them to the same period in the previous two years.

6 months to
15 May 2025
Same period 2024 Same period 2023
Rank 126 87 122
Rank change year-on-year -39 +35 -2
Permanent jobs citing Self-Motivation 348 778 1,010
As % of all permanent jobs advertised in London 2.70% 3.30% 2.97%
As % of the Miscellaneous category 6.12% 8.14% 6.42%
Number of salaries quoted 136 378 618
10th Percentile £33,250 £29,671 £31,250
25th Percentile £41,250 £35,000 £42,760
Median annual salary (50th Percentile) £56,250 £54,000 £66,550
Median % change year-on-year +4.17% -18.86% +10.92%
75th Percentile £79,500 £78,750 £85,000
90th Percentile £102,500 £95,000 £100,000
England median annual salary £47,000 £40,000 £52,500
% change year-on-year +17.50% -23.81% -

All Generic Skills
London

Self-Motivation falls under the General and Transferable Skills category. For comparison with the information above, the following table provides summary statistics for all permanent job vacancies requiring generic IT skills in London.

Permanent vacancies with a requirement for generic IT skills 5,685 9,558 15,720
As % of all permanent jobs advertised in London 44.05% 40.52% 46.23%
Number of salaries quoted 3,173 6,774 10,643
10th Percentile £41,750 £37,500 £44,192
25th Percentile £56,250 £51,750 £56,250
Median annual salary (50th Percentile) £80,000 £75,000 £75,554
Median % change year-on-year +6.67% -0.73% +0.74%
75th Percentile £110,000 £100,000 £100,000
90th Percentile £136,250 £130,000 £122,500
England median annual salary £60,000 £55,000 £65,000
% change year-on-year +9.09% -15.38% +4.00%

Self-Motivation
Job Vacancy Trend in London

Job postings citing Self-Motivation as a proportion of all IT jobs advertised in London.
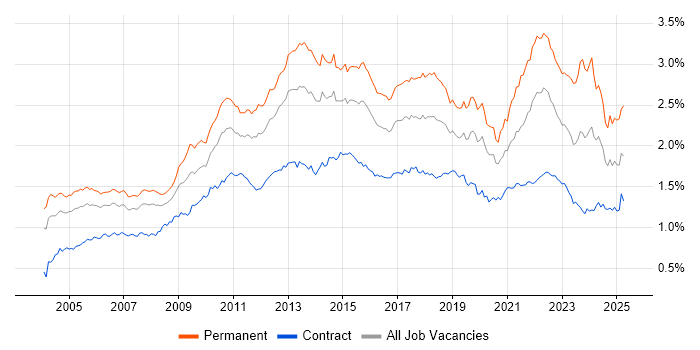
Job vacancy trend for Self-Motivation in London

Self-Motivation
Salary Trend in London

3-month moving average salary quoted in jobs citing Self-Motivation in London.

Salary trend for Self-Motivation in London

Self-Motivation
Salary Histogram in London

Salary distribution for jobs citing Self-Motivation in London over the 6 months to 15 May 2025.

Salary histogram for Self-Motivation in London

Self-Motivation
Job Locations in London

The table below looks at the demand and provides a guide to the median salaries quoted in IT jobs citing Self-Motivation within the London region over the 6 months to 15 May 2025. The 'Rank Change' column provides an indication of the change in demand within each location based on the same 6 month period last year.

Location Rank Change
on Same Period
Last Year
Matching
Permanent
IT Job Ads
Median Salary
Past 6 Months
Median Salary
% Change
on Same Period
Last Year
Live
Jobs
Central London +15 66 £47,000 -14.55% 45
East London -5 22 £80,000 -12.33% 15
West London +27 21 £76,500 +39.09% 29
South London -56 21 - - 8
North London -8 7 - - 1
Self-Motivation
England

Self-Motivation
Co-occurring Skills and Capabilities in London by Category

The follow tables expand on the table above by listing co-occurrences grouped by category. The same employment type, locality and period is covered with up to 20 co-occurrences shown in each of the following categories:

Application Platforms
1 27 (7.76%) SharePoint
2 14 (4.02%) Microsoft Exchange
3 5 (1.44%) Drupal
4 4 (1.15%) Liferay
5 2 (0.57%) WordPress
6 1 (0.29%) Confluence
6 1 (0.29%) Oracle SOA Suite
6 1 (0.29%) Oracle Workflow
Applications
1 30 (8.62%) Microsoft Office
2 18 (5.17%) Microsoft Excel
3 15 (4.31%) Microsoft PowerPoint
4 4 (1.15%) Microsoft Project
5 2 (0.57%) SOLIDWORKS
6 1 (0.29%) Chatbot
6 1 (0.29%) MS Visio
Business Applications
1 5 (1.44%) CiviCRM
1 5 (1.44%) Remedy ITSM
2 3 (0.86%) Salesforce CRM
3 2 (0.57%) Dynamics CRM
3 2 (0.57%) SAP S/4HANA
4 1 (0.29%) SAP ERP
Cloud Services
1 95 (27.30%) Azure
2 88 (25.29%) AWS
3 77 (22.13%) GCP
4 71 (20.40%) Serverless
5 67 (19.25%) AWS Lambda
6 24 (6.90%) Microsoft 365
6 24 (6.90%) SaaS
7 23 (6.61%) OneDrive
8 17 (4.89%) Google Analytics
9 12 (3.45%) Google Ads
10 8 (2.30%) Cloud Computing
11 7 (2.01%) Google Sheets
11 7 (2.01%) Power Platform
12 6 (1.72%) Entra ID
13 5 (1.44%) Adobe Creative Cloud
13 5 (1.44%) Azure DevOps
13 5 (1.44%) Azure Monitor
13 5 (1.44%) Canva
13 5 (1.44%) Figma
14 4 (1.15%) Snowflake
Communications & Networking
1 68 (19.54%) Broadband
2 22 (6.32%) Firewall
3 14 (4.02%) Wi-Fi
4 9 (2.59%) WAN
5 8 (2.30%) LAN
5 8 (2.30%) TCP/IP
5 8 (2.30%) WebEx
6 6 (1.72%) DHCP
6 6 (1.72%) DNS
6 6 (1.72%) VLAN
7 5 (1.44%) Intrusion Detection
7 5 (1.44%) IPsec
7 5 (1.44%) SSL
8 4 (1.15%) Network Security
8 4 (1.15%) VPN
9 3 (0.86%) Internet
9 3 (0.86%) Wireless
10 2 (0.57%) DKIM
10 2 (0.57%) Unified Communications
10 2 (0.57%) VoIP
Database & Business Intelligence
1 7 (2.01%) Relational Database
2 6 (1.72%) SQL Server
3 5 (1.44%) Power BI
4 4 (1.15%) Tableau
5 3 (0.86%) Data Warehouse
5 3 (0.86%) Metadata
5 3 (0.86%) NoSQL
6 2 (0.57%) Azure SQL Data Warehouse
6 2 (0.57%) Azure SQL Database
6 2 (0.57%) Big Data
6 2 (0.57%) Crystal Reports
6 2 (0.57%) Data Lake
6 2 (0.57%) Data Mining
6 2 (0.57%) GIS
6 2 (0.57%) HDInsight
6 2 (0.57%) MySQL
7 1 (0.29%) Hadoop
7 1 (0.29%) HBase
7 1 (0.29%) MongoDB
7 1 (0.29%) NonStop SQL
Development Applications
1 2 (0.57%) Git
1 2 (0.57%) Visual Studio
2 1 (0.29%) Android Studio
2 1 (0.29%) Cypress.io
2 1 (0.29%) Eclipse
2 1 (0.29%) JIRA
2 1 (0.29%) Selenium
2 1 (0.29%) Subversion
2 1 (0.29%) WebDriver
General
1 177 (50.86%) Social Skills
2 118 (33.91%) Analytical Skills
3 115 (33.05%) Finance
4 33 (9.48%) Marketing
5 30 (8.62%) Inclusion and Diversity
6 28 (8.05%) Advertising
7 23 (6.61%) Banking
8 21 (6.03%) Organisational Skills
9 20 (5.75%) Legal
10 15 (4.31%) Law
11 14 (4.02%) Presentation Skills
12 12 (3.45%) Public Sector
13 7 (2.01%) Front Office
13 7 (2.01%) Retail
14 6 (1.72%) Brand Awareness
15 5 (1.44%) Financial Institution
15 5 (1.44%) Investment Banking
15 5 (1.44%) Local Government
15 5 (1.44%) Multimedia
15 5 (1.44%) Telecoms
Job Titles
1 85 (24.43%) Senior
2 67 (19.25%) Business Manager
2 67 (19.25%) Machine Learning Engineer
3 63 (18.10%) Business Development Manager
3 63 (18.10%) Development Manager
4 43 (12.36%) Analyst
5 16 (4.60%) Lead
6 15 (4.31%) Support Engineer
7 12 (3.45%) Technical Engineer
7 12 (3.45%) Technical Support
7 12 (3.45%) Technical Support Engineer
8 10 (2.87%) Developer
8 10 (2.87%) IT Manager
8 10 (2.87%) Support Analyst
9 9 (2.59%) Administrator
10 8 (2.30%) Service Analyst
10 8 (2.30%) Service Desk Analyst
11 7 (2.01%) 1st Line Support
11 7 (2.01%) Marketing Manager
11 7 (2.01%) Senior Analyst
Libraries, Frameworks & Software Standards
1 5 (1.44%) .NET
2 4 (1.15%) CSS
2 4 (1.15%) EDI
2 4 (1.15%) FIX Protocol
2 4 (1.15%) HTML
2 4 (1.15%) React
3 2 (0.57%) AngularJS
3 2 (0.57%) JSON
3 2 (0.57%) LINQ
3 2 (0.57%) SAML
4 1 (0.29%) Express.js
4 1 (0.29%) Kafka
4 1 (0.29%) MEAN Stack
4 1 (0.29%) Node.js
4 1 (0.29%) Playwright
4 1 (0.29%) REST
4 1 (0.29%) RESTful
Miscellaneous
1 27 (7.76%) Social Media
2 14 (4.02%) Onboarding
3 13 (3.74%) Blog
4 11 (3.16%) Data Centre
5 9 (2.59%) Management Information System
6 7 (2.01%) Photography
6 7 (2.01%) Product Ownership
6 7 (2.01%) Video Editing
7 6 (1.72%) Mobile App
8 5 (1.44%) Blackberry
8 5 (1.44%) Team-Oriented Environment
9 4 (1.15%) Derivative
9 4 (1.15%) Enterprise Software
9 4 (1.15%) Linux Command Line
9 4 (1.15%) Video Conferencing
10 3 (0.86%) Market Risk
10 3 (0.86%) NHS
11 2 (0.57%) Enterprise Cloud
11 2 (0.57%) Social Network
11 2 (0.57%) Tandem
Operating Systems
1 52 (14.94%) Windows
2 19 (5.46%) Windows Server
3 18 (5.17%) Windows 10
4 15 (4.31%) Linux
5 3 (0.86%) Unix
6 2 (0.57%) Mac OS X
6 2 (0.57%) Red Hat Enterprise Linux
6 2 (0.57%) Windows Server 2012
7 1 (0.29%) Android
7 1 (0.29%) Mac OS
Processes & Methodologies
1 178 (51.15%) Problem-Solving
2 105 (30.17%) Agile
3 84 (24.14%) Decision-Making
4 82 (23.56%) Business Development
5 81 (23.28%) B2B
6 80 (22.99%) Mentoring
7 76 (21.84%) CI/CD
8 74 (21.26%) Data Science
9 72 (20.69%) Creative Thinking
9 72 (20.69%) Machine Learning
10 68 (19.54%) Clean Code
11 67 (19.25%) Performance Metrics
11 67 (19.25%) Personalization
12 66 (18.97%) Business Intelligence
13 60 (17.24%) B2B Sales
14 56 (16.09%) OpenUP
15 34 (9.77%) Customer Service
15 34 (9.77%) ITIL
16 28 (8.05%) Analytics
17 24 (6.90%) Continuous Improvement
Programming Languages
1 81 (23.28%) Python
2 69 (19.83%) TypeScript
3 22 (6.32%) SQL
4 11 (3.16%) C#
4 11 (3.16%) Java
5 7 (2.01%) JavaScript
6 6 (1.72%) PowerShell
7 3 (0.86%) R
7 3 (0.86%) T-SQL
8 2 (0.57%) C++
9 1 (0.29%) Bash
9 1 (0.29%) COBOL
9 1 (0.29%) Kotlin
9 1 (0.29%) MATLAB
9 1 (0.29%) Shell Script
9 1 (0.29%) VBA
Qualifications
1 148 (42.53%) Degree
2 67 (19.25%) PhD
3 12 (3.45%) Master's Degree
4 10 (2.87%) Microsoft Certification
5 9 (2.59%) Cisco Certification
6 6 (1.72%) CCNP
6 6 (1.72%) Computer Science Degree
6 6 (1.72%) MCSA
7 5 (1.44%) AWS Certification
7 5 (1.44%) CISA
7 5 (1.44%) CompTIA CySA+
7 5 (1.44%) CompTIA Security+
7 5 (1.44%) GIAC
8 4 (1.15%) CCIE
8 4 (1.15%) CIPD
8 4 (1.15%) CISSP
8 4 (1.15%) CRISC
8 4 (1.15%) DBS Check
8 4 (1.15%) PMI Certification
8 4 (1.15%) PMP
Quality Assurance & Compliance
1 16 (4.60%) Accessibility
2 10 (2.87%) ISO/IEC 27001
3 8 (2.30%) QA
4 5 (1.44%) GDPR
4 5 (1.44%) NCSC
5 4 (1.15%) Cyber Essentials
5 4 (1.15%) Data Quality
5 4 (1.15%) Software Quality Assurance
6 3 (0.86%) NIST
7 2 (0.57%) Actionable Recommendations
7 2 (0.57%) COBIT
7 2 (0.57%) Cyber Essentials PLUS
7 2 (0.57%) ISO 9001
7 2 (0.57%) PMO
7 2 (0.57%) SLA
8 1 (0.29%) COSO
8 1 (0.29%) GRC
8 1 (0.29%) ISO 15022
8 1 (0.29%) ISO 20022
8 1 (0.29%) SOC 2
System Software
1 29 (8.33%) Active Directory
2 10 (2.87%) VMware Infrastructure
3 6 (1.72%) Docker
4 3 (0.86%) Hyper-V
5 2 (0.57%) Virtual Desktop
5 2 (0.57%) Virtual Servers
6 1 (0.29%) HDFS
6 1 (0.29%) Veritas Cluster Server
Systems Management
1 14 (4.02%) Microsoft Intune
2 7 (2.01%) Terraform
3 5 (1.44%) SCCM
4 2 (0.57%) Kubernetes
4 2 (0.57%) RSA Archer
4 2 (0.57%) Single Sign-On
5 1 (0.29%) Ansible
5 1 (0.29%) Avamar
5 1 (0.29%) FortiGate
5 1 (0.29%) NetBackup
5 1 (0.29%) Tivoli Storage Manager
Vendors
1 77 (22.13%) Microsoft
2 30 (8.62%) Google
3 17 (4.89%) Salesforce
4 15 (4.31%) VMware
5 13 (3.74%) Apple
6 12 (3.45%) ServiceNow
7 11 (3.16%) HP
8 6 (1.72%) Cisco
9 5 (1.44%) Adobe
9 5 (1.44%) Databricks
9 5 (1.44%) Oracle
9 5 (1.44%) Remedy
10 4 (1.15%) HubSpot
10 4 (1.15%) Veeam
11 3 (0.86%) Alteryx
11 3 (0.86%) Informatica
11 3 (0.86%) SAP
12 2 (0.57%) DocuSign
12 2 (0.57%) Meraki
12 2 (0.57%) Red Hat