Bash Jobs in the UK excluding London

Bash Shell
UK > UK excluding London

The table below provides summary statistics for permanent job vacancies advertised in the UK excluding London requiring Bash skills. It includes a benchmarking guide to the annual salaries offered in vacancies that cited Bash over the 6 months leading up to 12 June 2025, comparing them to the same period in the previous two years.

6 months to
12 Jun 2025
Same period 2024 Same period 2023
Rank 191 252 147
Rank change year-on-year +61 -105 +47
Permanent jobs citing Bash 640 810 1,292
As % of all permanent jobs advertised in the UK excluding London 1.62% 1.02% 2.33%
As % of the Programming Languages category 6.17% 3.45% 6.04%
Number of salaries quoted 202 513 577
10th Percentile £40,000 £37,500 £38,999
25th Percentile £49,000 £45,000 £46,250
Median annual salary (50th Percentile) £60,000 £55,000 £61,180
Median % change year-on-year +9.09% -10.10% +3.26%
75th Percentile £75,000 £68,750 £77,500
90th Percentile £81,125 £80,000 £86,000
UK median annual salary £67,500 £60,000 £70,000
% change year-on-year +12.50% -14.29% -

All Programming Languages
UK excluding London

Bash falls under the Programming Languages category. For comparison with the information above, the following table provides summary statistics for all permanent job vacancies requiring coding skills in the UK excluding London.

Permanent vacancies with a requirement for coding skills 10,367 23,456 21,381
As % of all permanent jobs advertised in the UK excluding London 26.26% 29.40% 38.54%
Number of salaries quoted 6,580 16,953 12,883
10th Percentile £32,500 £32,500 £35,000
25th Percentile £43,750 £41,250 £42,500
Median annual salary (50th Percentile) £55,000 £54,000 £55,000
Median % change year-on-year +1.85% -1.82% +4.76%
75th Percentile £67,500 £67,250 £71,000
90th Percentile £80,000 £80,000 £83,750
UK median annual salary £60,000 £60,000 £65,000
% change year-on-year - -7.69% +4.00%

Bash
Job Vacancy Trend in the UK excluding London

Job postings citing Bash as a proportion of all IT jobs advertised in the UK excluding London.
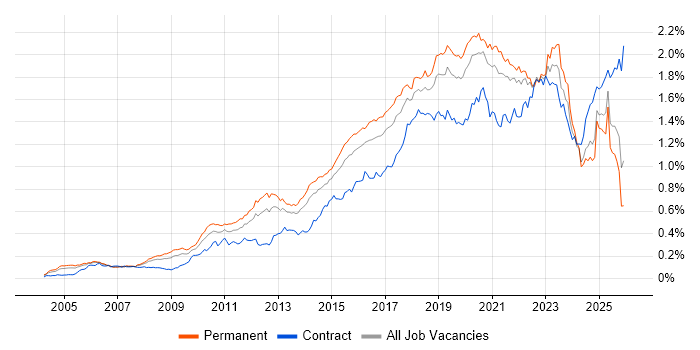
Job vacancy trend for Bash in the UK excluding London

Bash
Salary Trend in the UK excluding London

3-month moving average salary quoted in jobs citing Bash in the UK excluding London.

Salary trend for Bash in the UK excluding London

Bash
Salary Histogram in the UK excluding London

Salary distribution for jobs citing Bash in the UK excluding London over the 6 months to 12 June 2025.

Salary histogram for Bash in the UK excluding London

Bash
Job Locations in the UK excluding London

The table below looks at the demand and provides a guide to the median salaries quoted in IT jobs citing Bash within the UK excluding London region over the 6 months to 12 June 2025. The 'Rank Change' column provides an indication of the change in demand within each location based on the same 6 month period last year.

Location Rank Change
on Same Period
Last Year
Matching
Permanent
IT Job Ads
Median Salary
Past 6 Months
Median Salary
% Change
on Same Period
Last Year
Live
Jobs
North of England +204 309 £62,500 +4.17% 162
North West +172 288 £60,000 -4.43% 113
South East +25 141 £65,000 +18.18% 206
East of England +61 84 £60,000 - 99
Midlands +81 53 £55,000 -2.22% 44
South West -52 43 £57,443 +4.44% 56
East Midlands +60 28 £57,500 +15.00% 24
West Midlands +64 24 £55,000 -8.33% 17
Yorkshire +55 17 £68,750 +52.78% 41
Scotland +71 14 £80,000 +33.33% 55
North East +40 4 £47,500 -5.00% 8
Wales +42 2 £57,500 +27.78% 11
Northern Ireland +27 1 £55,000 -21.43% 21
Bash
UK

Bash
Co-occurring Skills and Capabilities in the UK excluding London by Category

The follow tables expand on the table above by listing co-occurrences grouped by category. The same employment type, locality and period is covered with up to 20 co-occurrences shown in each of the following categories:

Application Platforms
1 11 (1.72%) Apache Spark
2 6 (0.94%) Microsoft Exchange
3 5 (0.78%) Confluence
4 4 (0.63%) IIS
5 3 (0.47%) Apache Airflow
5 3 (0.47%) SharePoint
6 2 (0.31%) Oracle SOA Suite
6 2 (0.31%) SAS
7 1 (0.16%) Apache
7 1 (0.16%) CMS
7 1 (0.16%) nginx
Applications
1 8 (1.25%) Microsoft Excel
2 7 (1.09%) Chatbot
3 1 (0.16%) Weka
Business Applications
1 1 (0.16%) Oracle Payables
Cloud Services
1 142 (22.19%) AWS
2 90 (14.06%) Azure
3 65 (10.16%) Pulumi
4 30 (4.69%) GCP
5 29 (4.53%) GitHub
6 17 (2.66%) SaaS
7 15 (2.34%) Microsoft 365
7 15 (2.34%) Serverless
8 14 (2.19%) Amazon EC2
8 14 (2.19%) Azure DevOps
9 13 (2.03%) AWS Lambda
10 12 (1.88%) AWS CloudFormation
10 12 (1.88%) IaaS
10 12 (1.88%) PaaS
10 12 (1.88%) Power Platform
11 9 (1.41%) Amazon EKS
11 9 (1.41%) Azure Data Factory
12 7 (1.09%) GitHub Actions
13 6 (0.94%) Amazon CloudWatch
13 6 (0.94%) Virtual Private Cloud
Communications & Networking
1 343 (53.59%) VPN
2 262 (40.94%) Cisco IOS
3 76 (11.88%) TCP/IP
4 69 (10.78%) Broadband
5 51 (7.97%) Firewall
6 15 (2.34%) 5G
7 14 (2.19%) DNS
8 13 (2.03%) Bluetooth
8 13 (2.03%) Wi-Fi
9 12 (1.88%) LTE
10 10 (1.56%) Intrusion Detection
11 9 (1.41%) HTTP
11 9 (1.41%) Network Security
12 8 (1.25%) DHCP
12 8 (1.25%) Internet
12 8 (1.25%) VLAN
13 7 (1.09%) FTP
13 7 (1.09%) LAN
13 7 (1.09%) SMTP
13 7 (1.09%) WAN
Database & Business Intelligence
1 75 (11.72%) Relational Database
2 73 (11.41%) NoSQL
3 68 (10.63%) RDBMS
4 17 (2.66%) MySQL
5 15 (2.34%) Amazon RDS
5 15 (2.34%) SQL Server
6 12 (1.88%) PostgreSQL
7 11 (1.72%) Big Data
7 11 (1.72%) Data Warehouse
7 11 (1.72%) Power BI
8 8 (1.25%) SQL Server Integration Services
8 8 (1.25%) SQL Server Reporting Services
9 4 (0.63%) Elasticsearch
9 4 (0.63%) Metadata
10 3 (0.47%) Apache Hive
10 3 (0.47%) BigQuery
10 3 (0.47%) SQLite
10 3 (0.47%) Tableau
11 2 (0.31%) HBase
11 2 (0.31%) SAP HANA
Development Applications
1 66 (10.31%) Jaeger
2 62 (9.69%) Cucumber
2 62 (9.69%) Robot Framework
3 37 (5.78%) Jenkins
4 30 (4.69%) GitLab
5 14 (2.19%) Git
6 7 (1.09%) JIRA
6 7 (1.09%) TeamCity
7 5 (0.78%) CircleCI
8 3 (0.47%) Sonatype Nexus
9 2 (0.31%) Artifactory
9 2 (0.31%) Bitbucket
9 2 (0.31%) Burp Suite
9 2 (0.31%) JUnit
9 2 (0.31%) Metasploit
9 2 (0.31%) Mockito
10 1 (0.16%) Cypress.io
10 1 (0.16%) Maven
10 1 (0.16%) Subversion
10 1 (0.16%) WiX
General
1 405 (63.28%) Inclusion and Diversity
2 278 (43.44%) Analytical Skills
3 123 (19.22%) Social Skills
4 75 (11.72%) Telecoms
5 39 (6.09%) Finance
6 15 (2.34%) Electronics
7 13 (2.03%) Banking
8 8 (1.25%) Retail
9 7 (1.09%) Public Sector
10 4 (0.63%) Back Office
10 4 (0.63%) Financial Institution
10 4 (0.63%) Manufacturing
10 4 (0.63%) Marketing
11 3 (0.47%) Aerospace
11 3 (0.47%) Documentation Skills
11 3 (0.47%) Games
11 3 (0.47%) Organisational Skills
12 2 (0.31%) Agriculture
12 2 (0.31%) Billing
12 2 (0.31%) Presentation Skills
Job Titles
1 283 (44.22%) Infrastructure Engineer
2 115 (17.97%) Lead
3 65 (10.16%) Team Leader
4 64 (10.00%) Test Engineer
5 62 (9.69%) Test Automation Engineer
6 45 (7.03%) Senior
7 34 (5.31%) Administrator
7 34 (5.31%) DevOps Engineer
8 31 (4.84%) Systems Administrator
9 25 (3.91%) Linux Administrator
10 24 (3.75%) Linux Systems Administrator
11 20 (3.13%) Platform Engineer
11 20 (3.13%) Software Engineer
12 18 (2.81%) Analyst
13 16 (2.50%) Linux Engineer
14 14 (2.19%) Cloud Engineer
14 14 (2.19%) Support Engineer
15 12 (1.88%) Azure Engineer
16 11 (1.72%) Developer
16 11 (1.72%) Lead Infrastructure Engineer
Libraries, Frameworks & Software Standards
1 338 (52.81%) Elastic Stack
2 66 (10.31%) OpenTelemetry
3 13 (2.03%) LDAP
4 7 (1.09%) ADO
5 6 (0.94%) Kafka
5 6 (0.94%) Pandas
6 5 (0.78%) HTML
7 4 (0.63%) .NET
7 4 (0.63%) CSS
8 3 (0.47%) ARM Templates
8 3 (0.47%) Loki
8 3 (0.47%) Spring
9 2 (0.31%) Apache NiFi
9 2 (0.31%) Plotly
9 2 (0.31%) PySpark
9 2 (0.31%) REST
9 2 (0.31%) RESTful
9 2 (0.31%) Ruby on Rails
9 2 (0.31%) Shiny
9 2 (0.31%) YAML
Miscellaneous
1 260 (40.63%) Cyberattack
2 76 (11.88%) Linux Command Line
3 17 (2.66%) Management Information System
4 16 (2.50%) IoT
5 14 (2.19%) Hybrid Cloud
6 13 (2.03%) Data Centre
7 11 (1.72%) NB-IoT
8 10 (1.56%) Algorithms
8 10 (1.56%) Private Cloud
8 10 (1.56%) Security Operations Centre
9 9 (1.41%) Public Cloud
10 8 (1.25%) Cloud Native
10 8 (1.25%) Onboarding
11 7 (1.09%) Client/Server
11 7 (1.09%) Enterprise Cloud
11 7 (1.09%) Security Posture
12 6 (0.94%) Self-Motivation
13 5 (0.78%) Cyber Threat
14 3 (0.47%) Embedded Systems
14 3 (0.47%) Replication
Operating Systems
1 528 (82.50%) Linux
2 392 (61.25%) Windows
3 260 (40.63%) Android
4 87 (13.59%) Unix
5 28 (4.38%) Windows Server
6 23 (3.59%) Red Hat Enterprise Linux
7 16 (2.50%) Mac OS
8 10 (1.56%) Ubuntu
9 8 (1.25%) CentOS
9 8 (1.25%) SUSE Linux Enterprise Server
10 7 (1.09%) Debian
11 5 (0.78%) SUSE
12 3 (0.47%) Windows Server 2019
13 2 (0.31%) AIX
13 2 (0.31%) Solaris
14 1 (0.16%) CoreOS
Processes & Methodologies
1 468 (73.13%) DevOps
2 377 (58.91%) Problem-Solving
3 335 (52.34%) Task Automation
4 286 (44.69%) Infrastructure Engineering
4 286 (44.69%) Platform Engineering
5 270 (42.19%) Line Management
6 269 (42.03%) Mathematics
7 261 (40.78%) Risk Management
7 261 (40.78%) Storage Management
8 165 (25.78%) Mentoring
9 130 (20.31%) Infrastructure as Code
10 116 (18.13%) Containerisation
11 93 (14.53%) Agile
12 84 (13.13%) High Availability
13 74 (11.56%) Continuous Integration
14 73 (11.41%) Coaching
15 72 (11.25%) Roadmaps
16 71 (11.09%) Test Automation
17 70 (10.94%) CI/CD
18 69 (10.78%) GitOps
Programming Languages
1 596 (93.13%) Python
2 446 (69.69%) PowerShell
3 134 (20.94%) JavaScript
4 86 (13.44%) Java
5 70 (10.94%) Go
6 47 (7.34%) SQL
7 24 (3.75%) C++
8 19 (2.97%) C#
9 18 (2.81%) C
10 17 (2.66%) Perl
11 13 (2.03%) Shell Script
12 12 (1.88%) Bicep
13 10 (1.56%) Fortran
14 9 (1.41%) Ruby
15 8 (1.25%) Data Analysis Expressions
16 6 (0.94%) R
17 5 (0.78%) Korn
17 5 (0.78%) Kusto Query Language
18 3 (0.47%) PL/SQL
18 3 (0.47%) TypeScript
Qualifications
1 124 (19.38%) Degree
2 78 (12.19%) AWS Certification
3 42 (6.56%) Security Cleared
4 28 (4.38%) DV Cleared
5 27 (4.22%) SC Cleared
6 18 (2.81%) CompTIA Security+
7 13 (2.03%) Computer Science Degree
7 13 (2.03%) Master's Degree
8 11 (1.72%) Azure Certification
8 11 (1.72%) Network+ Certification
9 10 (1.56%) PhD
10 9 (1.41%) Microsoft Certification
11 7 (1.09%) CEH
12 6 (0.94%) RHCE
13 5 (0.78%) CISSP
14 4 (0.63%) CISM
14 4 (0.63%) GCIH
14 4 (0.63%) OSCP
15 3 (0.47%) CREST Certified
15 3 (0.47%) Linux+ Certification
Quality Assurance & Compliance
1 72 (11.25%) QA
2 27 (4.22%) ISO/IEC 27001
3 20 (3.13%) GDPR
4 10 (1.56%) COBIT
4 10 (1.56%) NIST
5 8 (1.25%) HIPAA
5 8 (1.25%) PCI DSS
6 3 (0.47%) Data Quality
7 2 (0.31%) Actionable Recommendations
7 2 (0.31%) Cyber Essentials
7 2 (0.31%) JTAG
7 2 (0.31%) SOC 2
8 1 (0.16%) Accessibility
8 1 (0.16%) NCSC
8 1 (0.16%) Sarbanes-Oxley
8 1 (0.16%) SLA
System Software
1 382 (59.69%) Docker
2 273 (42.66%) vSphere
3 267 (41.72%) Hyper-V
4 260 (40.63%) VMware NSX
5 33 (5.16%) VMware Infrastructure
6 23 (3.59%) Active Directory
7 11 (1.72%) VMware ESXi
8 8 (1.25%) NFS
9 5 (0.78%) Virtual Machines
10 3 (0.47%) Citrix Hypervisor
10 3 (0.47%) Dovecot
10 3 (0.47%) Firmware
10 3 (0.47%) GPFS
10 3 (0.47%) Lustre
10 3 (0.47%) Postfix
10 3 (0.47%) Virtual Desktop
11 2 (0.31%) Apache Flume
11 2 (0.31%) Embedded Firmware
11 2 (0.31%) HDFS
11 2 (0.31%) Squid
Systems Management
1 409 (63.91%) Terraform
2 398 (62.19%) Ansible
3 117 (18.28%) Kubernetes
4 81 (12.66%) Prometheus
5 70 (10.94%) Argo
6 65 (10.16%) Kustomize
7 28 (4.38%) Puppet
8 19 (2.97%) Grafana
9 13 (2.03%) Microsoft Intune
10 11 (1.72%) QRadar
11 10 (1.56%) Progress Chef
12 9 (1.41%) SCCM
13 6 (0.94%) Kibana
13 6 (0.94%) SCOM
14 4 (0.63%) SCOrch
15 3 (0.47%) Proxmox
15 3 (0.47%) Red Hat Satellite
16 2 (0.31%) Nagios
16 2 (0.31%) Oozie
16 2 (0.31%) ZABBIX
Vendors
1 282 (44.06%) Splunk
2 268 (41.88%) Cisco
3 261 (40.78%) Juniper
4 260 (40.63%) 3PAR
5 75 (11.72%) Microsoft
6 71 (11.09%) Google
7 44 (6.88%) VMware
8 19 (2.97%) Red Hat
9 13 (2.03%) SAP
10 7 (1.09%) Apple
10 7 (1.09%) Oracle
11 4 (0.63%) F5
11 4 (0.63%) IBM
11 4 (0.63%) Palo Alto
12 3 (0.47%) Dell
12 3 (0.47%) Dynatrace
12 3 (0.47%) NetApp
12 3 (0.47%) New Relic
12 3 (0.47%) ServiceNow
12 3 (0.47%) SolarWinds