C# Software Developer
UK
The median C# Software Developer salary in the UK is £54,250 per year, according to job vacancies posted during the 6 months leading to 1 May 2025.
The table below provides salary benchmarking and summary statistics, comparing them to the same period in the previous two years.
| 6 months to 1 May 2025 |
Same period 2024 | Same period 2023 | |
|---|---|---|---|
| Rank | 632 | 637 | 561 |
| Rank change year-on-year | +5 | -76 | +136 |
| Permanent jobs requiring a C# Software Developer | 60 | 264 | 474 |
| As % of all permanent jobs advertised in the UK | 0.12% | 0.27% | 0.46% |
| As % of the Job Titles category | 0.13% | 0.28% | 0.50% |
| Number of salaries quoted | 48 | 247 | 455 |
| 10th Percentile | £38,750 | £36,250 | £40,000 |
| 25th Percentile | £46,250 | £42,500 | £46,875 |
| Median annual salary (50th Percentile) | £54,250 | £52,500 | £60,000 |
| Median % change year-on-year | +3.33% | -12.50% | +14.29% |
| 75th Percentile | £65,625 | £63,750 | £78,125 |
| 90th Percentile | £115,000 | £72,500 | £95,000 |
| UK excluding London median annual salary | £50,000 | £52,500 | £55,000 |
| % change year-on-year | -4.76% | -4.55% | +10.00% |
All Permanent IT Job Vacancies
UK
For comparison with the information above, the following table provides summary statistics for all permanent IT job vacancies. Most job vacancies include a discernible job title that can be normalized. As such, the figures in the second row provide an indication of the number of permanent jobs in our overall sample.
| Permanent vacancies in the UK with a recognized job title | 46,902 | 93,183 | 95,132 |
| % of permanent jobs with a recognized job title | 90.12% | 94.62% | 91.53% |
| Number of salaries quoted | 27,275 | 66,883 | 59,840 |
| 10th Percentile | £30,000 | £28,500 | £32,500 |
| 25th Percentile | £42,000 | £38,500 | £45,000 |
| Median annual salary (50th Percentile) | £57,500 | £52,777 | £60,000 |
| Median % change year-on-year | +8.95% | -12.04% | - |
| 75th Percentile | £75,000 | £71,250 | £81,250 |
| 90th Percentile | £97,500 | £90,000 | £100,000 |
| UK excluding London median annual salary | £52,000 | £50,000 | £52,500 |
| % change year-on-year | +4.00% | -4.76% | +5.00% |
C# Software Developer
Job Vacancy Trend
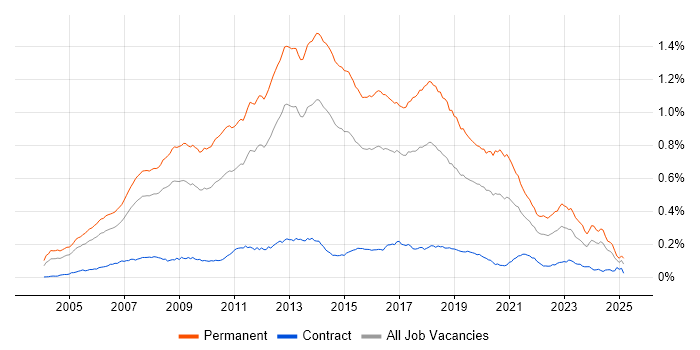
Job postings that featured C# Software Developer in the job title as a proportion of all IT jobs advertised.

C# Software Developer
Salary Trend
3-month moving average salary quoted in jobs citing C# Software Developer.
C# Software Developer
Salary Histogram
Salary distribution for jobs citing C# Software Developer over the 6 months to 1 May 2025.
C# Software Developer
Top 13 Job Locations
The table below looks at the demand and provides a guide to the median salaries quoted in IT jobs citing C# Software Developer within the UK over the 6 months to 1 May 2025. The 'Rank Change' column provides an indication of the change in demand within each location based on the same 6 month period last year.
| Location | Rank Change on Same Period Last Year |
Matching Permanent IT Job Ads |
Median Salary Past 6 Months |
Median Salary % Change on Same Period Last Year |
Live Jobs |
|---|---|---|---|---|---|
| England | +2 | 60 | £54,250 | +3.33% | 66 |
| UK excluding London | +32 | 45 | £50,000 | -4.76% | 59 |
| Work from Home | +97 | 24 | £54,250 | +1.40% | 43 |
| Midlands | +56 | 16 | £45,000 | -15.89% | 10 |
| North of England | +22 | 15 | £50,000 | +4.17% | 28 |
| London | +91 | 13 | £55,000 | -6.78% | 8 |
| South East | +75 | 13 | £60,000 | -4.00% | 7 |
| West Midlands | +31 | 10 | £45,000 | -15.89% | 5 |
| North West | -7 | 7 | £47,500 | - | 11 |
| East Midlands | +43 | 6 | £53,750 | +10.26% | 5 |
| Yorkshire | +57 | 5 | £53,500 | +8.08% | 7 |
| North East | +45 | 3 | £115,000 | +91.67% | 11 |
| South West | +79 | 1 | £44,000 | -16.19% | 6 |
C# Software Developer Skill Set
Top 30 Co-occurring Skills and Capabilities
For the 6 months to 1 May 2025, C# Software Developer job roles required the following skills and capabilities in order of popularity. The figures indicate the absolute number co-occurrences and as a proportion of all permanent job ads featuring C# Software Developer in the job title.
|
|
C# Software Developer Skill Set
Co-occurring Skills and Capabilities by Category
The follow tables expand on the table above by listing co-occurrences grouped by category. The same employment type, locality and period is covered with up to 20 co-occurrences shown in each of the following categories:
|
|
||||||||||||||||||||||||||||||||||||||||||||||||||||||||||||||||||||||||||||||||||||||||||||||||||||||||||||||||||||||||
|
|
||||||||||||||||||||||||||||||||||||||||||||||||||||||||||||||||||||||||||||||||||||||||||||||||||||||||||||||||||||||||
|
|
||||||||||||||||||||||||||||||||||||||||||||||||||||||||||||||||||||||||||||||||||||||||||||||||||||||||||||||||||||||||
|
|
||||||||||||||||||||||||||||||||||||||||||||||||||||||||||||||||||||||||||||||||||||||||||||||||||||||||||||||||||||||||
|
|
||||||||||||||||||||||||||||||||||||||||||||||||||||||||||||||||||||||||||||||||||||||||||||||||||||||||||||||||||||||||
|
|
||||||||||||||||||||||||||||||||||||||||||||||||||||||||||||||||||||||||||||||||||||||||||||||||||||||||||||||||||||||||
|
|
||||||||||||||||||||||||||||||||||||||||||||||||||||||||||||||||||||||||||||||||||||||||||||||||||||||||||||||||||||||||
|
|
||||||||||||||||||||||||||||||||||||||||||||||||||||||||||||||||||||||||||||||||||||||||||||||||||||||||||||||||||||||||
|
|||||||||||||||||||||||||||||||||||||||||||||||||||||||||||||||||||||||||||||||||||||||||||||||||||||||||||||||||||||||||
