User Experience Jobs

UX
UK

The table below provides summary statistics for permanent job vacancies requiring User Experience skills. It includes a benchmarking guide to the annual salaries offered in vacancies that cited User Experience over the 6 months leading up to 26 October 2024, comparing them to the same period in the previous two years.

6 months to
26 Oct 2024
Same period 2023 Same period 2022
Rank 74 83 42
Rank change year-on-year +9 -41 0
Permanent jobs citing User Experience 2,345 2,155 9,598
As % of all permanent jobs advertised in the UK 3.08% 3.67% 6.80%
As % of the Processes & Methodologies category 3.67% 3.89% 7.08%
Number of salaries quoted 957 1,653 3,597
10th Percentile £32,500 £38,529 £37,500
25th Percentile £42,500 £47,260 £47,500
Median annual salary (50th Percentile) £57,000 £61,500 £60,000
Median % change year-on-year -7.32% +2.50% +9.09%
75th Percentile £75,000 £80,000 £77,500
90th Percentile £93,750 £95,000 £90,850
UK excluding London median annual salary £50,000 £55,000 £55,000
% change year-on-year -9.09% - +10.00%

All Process and Methodology Skills
UK

User Experience falls under the Processes and Methodologies category. For comparison with the information above, the following table provides summary statistics for all permanent job vacancies requiring process or methodology skills.

Permanent vacancies with a requirement for process or methodology skills 63,908 55,391 135,614
As % of all permanent jobs advertised in the UK 84.07% 94.35% 96.13%
Number of salaries quoted 30,608 39,736 76,629
10th Percentile £34,000 £32,500 £34,000
25th Percentile £45,000 £44,497 £45,000
Median annual salary (50th Percentile) £60,000 £60,000 £60,000
Median % change year-on-year - - +4.35%
75th Percentile £77,500 £80,000 £81,000
90th Percentile £97,250 £97,500 £98,750
UK excluding London median annual salary £54,125 £52,500 £52,500
% change year-on-year +3.10% - +5.00%

User Experience
Job Vacancy Trend

Job postings citing User Experience as a proportion of all IT jobs advertised.
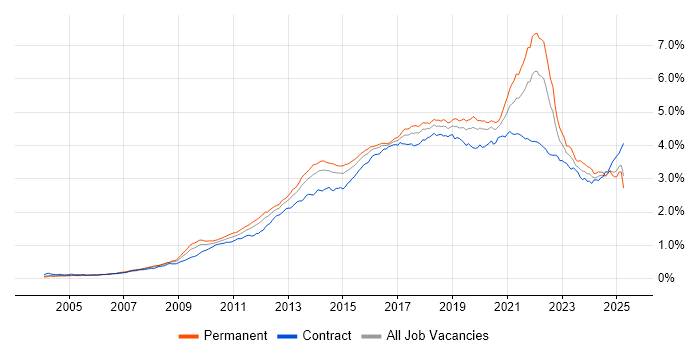
Job vacancy trend for User Experience in the UK

User Experience
Salary Trend

3-month moving average salary quoted in jobs citing User Experience.

Salary trend for User Experience in the UK

User Experience
Salary Histogram

Salary distribution for jobs citing User Experience over the 6 months to 26 October 2024.

Salary histogram for User Experience in the UK

User Experience
Top 19 Job Locations

The table below looks at the demand and provides a guide to the median salaries quoted in IT jobs citing User Experience within the UK over the 6 months to 26 October 2024. The 'Rank Change' column provides an indication of the change in demand within each location based on the same 6 month period last year.

Location Rank Change
on Same Period
Last Year
Matching
Permanent
IT Job Ads
Median Salary
Past 6 Months
Median Salary
% Change
on Same Period
Last Year
Live
Jobs
England +10 2,131 £57,500 -8.00% 752
UK excluding London +25 1,576 £50,000 -9.09% 419
Work from Home +18 932 £65,000 +3.17% 636
London -22 692 £75,000 +7.14% 359
North of England +46 564 £50,055 +0.11% 142
North West +39 422 £53,750 +7.50% 89
South East -10 349 £55,000 - 75
Midlands -8 209 £45,000 -18.18% 68
South West +42 179 £46,500 -15.45% 54
West Midlands -26 113 £54,744 -0.47% 43
East of England -10 105 £50,000 -9.09% 54
East Midlands +4 96 £35,000 -36.36% 25
Scotland -3 92 £60,000 +9.09% 25
Yorkshire +14 88 £50,000 +5.26% 29
North East +9 54 £45,000 -6.25% 24
Wales +43 41 £27,500 -50.00% 10
Northern Ireland +22 23 £52,500 +40.00% 3
Channel Islands - 9 £25,000 -
Isle of Man - 8 £25,000 -

User Experience
Co-occurring Skills and Capabilities by Category

The follow tables expand on the table above by listing co-occurrences grouped by category. The same employment type, locality and period is covered with up to 20 co-occurrences shown in each of the following categories:

Application Platforms
1 102 (4.35%) CMS
2 77 (3.28%) WordPress
3 53 (2.26%) Apache
4 50 (2.13%) Apache Airflow
5 37 (1.58%) SharePoint
6 34 (1.45%) Confluence
7 14 (0.60%) Drupal
8 11 (0.47%) Adobe Experience Manager
8 11 (0.47%) Microsoft Exchange
8 11 (0.47%) Umbraco
9 8 (0.34%) Headless CMS
10 6 (0.26%) Apache Spark
10 6 (0.26%) Moodle
11 3 (0.13%) Tomcat
11 3 (0.13%) Totara
12 2 (0.085%) Kentico
12 2 (0.085%) Strapi
13 1 (0.043%) Ethereum
13 1 (0.043%) Sitecore CMS
13 1 (0.043%) WildFly
Applications
1 65 (2.77%) Sketch
2 60 (2.56%) Adobe XD
3 48 (2.05%) Photoshop
4 46 (1.96%) Adobe Illustrator
5 44 (1.88%) Adobe Creative Suite
6 30 (1.28%) Microsoft Office
7 23 (0.98%) Microsoft Excel
8 19 (0.81%) InVision
9 10 (0.43%) Adobe After Effects
9 10 (0.43%) Elementor
9 10 (0.43%) MS Visio
10 9 (0.38%) Microsoft PowerPoint
11 7 (0.30%) Zeplin
12 5 (0.21%) Chatbot
13 3 (0.13%) InDesign
13 3 (0.13%) Trello
13 3 (0.13%) UserZoom
14 1 (0.043%) Adobe Premiere
14 1 (0.043%) CINEMA 4D
14 1 (0.043%) Marvel
Business Applications
1 29 (1.24%) Magento
1 29 (1.24%) NEC Housing
2 25 (1.07%) Shopify
3 15 (0.64%) Ripple
4 8 (0.34%) Oracle ERP
4 8 (0.34%) Payment Gateway
5 7 (0.30%) Dynamics CRM
5 7 (0.30%) Teamcenter
6 4 (0.17%) Dynamics AX
6 4 (0.17%) Dynamics NAV
7 3 (0.13%) Remedy ITSM
7 3 (0.13%) SAP S/4HANA
7 3 (0.13%) Workfront
8 2 (0.085%) Elite 3E
9 1 (0.043%) Salesforce CRM
9 1 (0.043%) SDL Web 8
9 1 (0.043%) TRIRIGA
Cloud Services
1 620 (26.44%) AWS
2 314 (13.39%) GitHub
3 277 (11.81%) Azure
4 252 (10.75%) Serverless
5 216 (9.21%) Amazon Kinesis
5 216 (9.21%) Amazon S3
6 215 (9.17%) Amazon SQS
6 215 (9.17%) AWS Lambda
7 194 (8.27%) Figma
8 145 (6.18%) GCP
9 129 (5.50%) SaaS
10 98 (4.18%) Power Platform
11 80 (3.41%) Microsoft 365
12 42 (1.79%) Entra ID
13 41 (1.75%) Azure DevOps
14 36 (1.54%) Cloud Computing
15 35 (1.49%) Google Analytics
16 31 (1.32%) Firebase
17 30 (1.28%) Miro
18 26 (1.11%) PowerApps
Communications & Networking
1 58 (2.47%) DNS
2 42 (1.79%) DHCP
3 39 (1.66%) Broadband
4 37 (1.58%) Unified Communications
5 27 (1.15%) Wi-Fi
6 19 (0.81%) Structured Cabling
7 18 (0.77%) MQTT
8 17 (0.72%) Firewall
9 16 (0.68%) Network Security
10 14 (0.60%) VPN
11 9 (0.38%) Intranet
11 9 (0.38%) Wireless
12 8 (0.34%) Intrusion Detection
12 8 (0.34%) Remote Desktop
12 8 (0.34%) VoIP
13 7 (0.30%) 3G
14 6 (0.26%) GPRS
14 6 (0.26%) LTE
14 6 (0.26%) Modbus
15 4 (0.17%) HTTP
Database & Business Intelligence
1 303 (12.92%) PostgreSQL
2 237 (10.11%) Redis
3 217 (9.25%) DynamoDB
4 110 (4.69%) SQL Server
5 103 (4.39%) MySQL
6 98 (4.18%) MongoDB
7 92 (3.92%) Power BI
8 64 (2.73%) NoSQL
9 48 (2.05%) Data Warehouse
10 44 (1.88%) Apache Ignite
11 41 (1.75%) Relational Database
11 41 (1.75%) Tableau
12 38 (1.62%) SQLite
13 25 (1.07%) DB2
14 24 (1.02%) Data Vault
15 20 (0.85%) Elasticsearch
16 10 (0.43%) Data Lake
17 9 (0.38%) Power Query
17 9 (0.38%) SQL Server Reporting Services
18 7 (0.30%) RDBMS
Development Applications
1 267 (11.39%) Jenkins
2 217 (9.25%) Git
3 139 (5.93%) JIRA
4 36 (1.54%) Bitbucket
5 28 (1.19%) Visual Studio
6 24 (1.02%) webpack
7 19 (0.81%) Artifactory
8 18 (0.77%) Cypress.io
8 18 (0.77%) Selenium
8 18 (0.77%) Visual Studio Code
9 17 (0.72%) Maven
10 16 (0.68%) Axure RP
11 14 (0.60%) Vite
12 12 (0.51%) Cucumber
12 12 (0.51%) gulp
13 11 (0.47%) TeamCity
14 10 (0.43%) MSTest
15 9 (0.38%) GitLab
16 8 (0.34%) Babel
17 7 (0.30%) Storybook
General
1 619 (26.40%) Inclusion and Diversity
2 592 (25.25%) Social Skills
3 383 (16.33%) Marketing
4 368 (15.69%) Finance
5 270 (11.51%) Analytical Skills
6 233 (9.94%) Advertising
7 100 (4.26%) Public Sector
8 95 (4.05%) Front Office
9 92 (3.92%) Law
10 91 (3.88%) Presentation Skills
11 51 (2.17%) Games
12 47 (2.00%) Legal
13 46 (1.96%) Manufacturing
14 40 (1.71%) Retail
15 39 (1.66%) Local Government
16 38 (1.62%) Organisational Skills
17 37 (1.58%) Pharmaceutical
18 33 (1.41%) Police
19 30 (1.28%) Banking
19 30 (1.28%) Social Housing
Job Titles
1 656 (27.97%) Developer
2 477 (20.34%) Software Engineer
3 337 (14.37%) Senior
4 225 (9.59%) Lead
5 200 (8.53%) Designer
6 163 (6.95%) Front-End Developer (Client-Side Developer)
7 145 (6.18%) Architect
8 122 (5.20%) UX Designer
9 114 (4.86%) Senior Developer
10 110 (4.69%) Analyst
11 108 (4.61%) React Developer
12 103 (4.39%) UI Developer
13 96 (4.09%) UI Engineer
14 91 (3.88%) Product Manager
15 90 (3.84%) Lead Software Engineer
16 86 (3.67%) Software Architect
17 84 (3.58%) Programmer
18 82 (3.50%) Software Programmer
19 77 (3.28%) Developer/Software Engineer
20 69 (2.94%) Full-Stack Developer
Libraries, Frameworks & Software Standards
1 558 (23.80%) React
2 419 (17.87%) CSS
2 419 (17.87%) HTML
3 415 (17.70%) Node.js
4 348 (14.84%) AngularJS
5 311 (13.26%) REST
6 271 (11.56%) Tailwind CSS
7 193 (8.23%) .NET
8 125 (5.33%) HTML5
9 113 (4.82%) Vue
10 103 (4.39%) Redux
11 100 (4.26%) RESTful
12 87 (3.71%) jQuery
13 82 (3.50%) Laravel
14 64 (2.73%) Web Services
15 58 (2.47%) ASP.NET
16 56 (2.39%) Twitter Bootstrap
17 53 (2.26%) JSON
18 51 (2.17%) .NET Core
19 49 (2.09%) GraphQL
Miscellaneous
1 283 (12.07%) Cyberattack
2 222 (9.47%) Digital Media
3 218 (9.30%) Blog
4 124 (5.29%) Product Ownership
5 116 (4.95%) Mobile App
6 75 (3.20%) Fixed Income
7 48 (2.05%) Blockchain
7 48 (2.05%) Self-Motivation
8 45 (1.92%) Algorithms
9 44 (1.88%) e-Learning
10 43 (1.83%) Social Media
11 37 (1.58%) Onboarding
12 36 (1.54%) Greenfield Project
12 36 (1.54%) Management Information System
13 33 (1.41%) Video Conferencing
14 31 (1.32%) Data Structures
15 30 (1.28%) Graphic Design
16 29 (1.24%) IoT
17 28 (1.19%) Analytical Mindset
17 28 (1.19%) Hybrid Cloud
Operating Systems
1 138 (5.88%) Windows
2 120 (5.12%) Android
3 116 (4.95%) Linux
4 83 (3.54%) Apple iOS
5 21 (0.90%) Windows 10
5 21 (0.90%) Windows Server
6 15 (0.64%) Ubuntu
7 13 (0.55%) Windows Server 2016
8 8 (0.34%) CentOS
8 8 (0.34%) Mac OS
8 8 (0.34%) Windows Server 2012
8 8 (0.34%) Windows Server 2019
9 4 (0.17%) Unix
9 4 (0.17%) Windows 7
10 2 (0.085%) VMS
10 2 (0.085%) Windows Vista
11 1 (0.043%) Embedded Linux
11 1 (0.043%) tvOS
11 1 (0.043%) Windows 8
11 1 (0.043%) Windows Embedded Compact
Processes & Methodologies
1 1,083 (46.18%) Agile
2 770 (32.84%) Software Engineering
3 756 (32.24%) Problem-Solving
4 632 (26.95%) UX Design
5 480 (20.47%) Full-Stack Development
6 459 (19.57%) Mentoring
7 357 (15.22%) E-Commerce
8 323 (13.77%) Machine Learning
9 321 (13.69%) Scrum
10 304 (12.96%) Creative Thinking
11 293 (12.49%) Data Engineering
12 287 (12.24%) Site Reliability Engineering
13 276 (11.77%) Front End Development
14 223 (9.51%) Epics
15 219 (9.34%) Continuous Delivery
15 219 (9.34%) Web Development
16 202 (8.61%) Roadmaps
17 196 (8.36%) DevOps
18 182 (7.76%) Analytics
19 157 (6.70%) Computer Science
Programming Languages
1 573 (24.43%) JavaScript
2 435 (18.55%) TypeScript
3 243 (10.36%) SQL
4 220 (9.38%) C#
5 214 (9.13%) Python
6 148 (6.31%) Java
7 136 (5.80%) PHP
8 40 (1.71%) PowerShell
9 32 (1.36%) C
10 28 (1.19%) T-SQL
11 27 (1.15%) Bash
12 25 (1.07%) C++
13 23 (0.98%) Kotlin
14 22 (0.94%) Objective-C
15 18 (0.77%) Swift
16 16 (0.68%) Apex Code
17 13 (0.55%) Ruby
18 12 (0.51%) XAML
19 11 (0.47%) VBA
20 10 (0.43%) R
Qualifications
1 299 (12.75%) Degree
2 100 (4.26%) Computer Science Degree
3 65 (2.77%) Security Cleared
4 40 (1.71%) DBS Check
5 39 (1.66%) Master's Degree
6 31 (1.32%) SC Cleared
7 26 (1.11%) DV Cleared
8 24 (1.02%) CISSP
9 23 (0.98%) CISA
10 19 (0.81%) RIBA
11 17 (0.72%) Microsoft Certification
12 16 (0.68%) CEH
13 15 (0.64%) CCNA
13 15 (0.64%) CCNP
13 15 (0.64%) Cisco Certification
13 15 (0.64%) CRISC
14 11 (0.47%) ITIL Certification
15 10 (0.43%) Numerate Degree
16 8 (0.34%) CISM
16 8 (0.34%) CompTIA CySA+
Quality Assurance & Compliance
1 131 (5.59%) Accessibility
2 72 (3.07%) QA
3 33 (1.41%) SLA
4 18 (0.77%) Data Quality
5 16 (0.68%) MiFID
6 11 (0.47%) GDPR
7 7 (0.30%) ISO/IEC 27001
8 5 (0.21%) WCAG
9 4 (0.17%) Cyber Essentials
9 4 (0.17%) NCSC
10 3 (0.13%) PCI DSS
11 2 (0.085%) GLP
11 2 (0.085%) HIPAA
11 2 (0.085%) PMO
11 2 (0.085%) WAI
12 1 (0.043%) Actionable Recommendations
12 1 (0.043%) ISO 9001
System Software
1 301 (12.84%) Docker
2 78 (3.33%) Active Directory
3 12 (0.51%) Hyper-V
4 9 (0.38%) Firmware
5 7 (0.30%) VMware Infrastructure
6 5 (0.21%) Embedded Firmware
7 4 (0.17%) Virtual Machines
7 4 (0.17%) VMware ESXi
8 3 (0.13%) Virtual Desktop
9 2 (0.085%) XenApp
9 2 (0.085%) XenDesktop
10 1 (0.043%) BitLocker
10 1 (0.043%) Shibboleth
10 1 (0.043%) VMware Workstation
10 1 (0.043%) vSphere
Systems Management
1 268 (11.43%) Kubernetes
2 37 (1.58%) Terraform
3 29 (1.24%) Microsoft Intune
4 22 (0.94%) SCCM
5 19 (0.81%) Jamf Pro
6 16 (0.68%) Grafana
7 11 (0.47%) Kibana
8 9 (0.38%) Ansible
8 9 (0.38%) cPanel
8 9 (0.38%) Progress Chef
9 7 (0.30%) Packer
10 6 (0.26%) Prometheus
11 4 (0.17%) Microsoft Data Protection Manager
11 4 (0.17%) SCDPM
11 4 (0.17%) vCenter Server
11 4 (0.17%) WSUS
11 4 (0.17%) ZABBIX
12 2 (0.085%) Active Directory Federation Services
13 1 (0.043%) Single Sign-On
13 1 (0.043%) SysTrack
Vendors
1 233 (9.94%) Microsoft
2 129 (5.50%) Adobe
3 108 (4.61%) Google
4 33 (1.41%) Red Hat
5 30 (1.28%) IBM
6 29 (1.24%) NEC
6 29 (1.24%) ServiceNow
7 27 (1.15%) VMware
8 25 (1.07%) Oracle
9 23 (0.98%) Salesforce
10 22 (0.94%) WooCommerce
11 21 (0.90%) Citrix
12 19 (0.81%) Atlassian
13 17 (0.72%) SAP
14 15 (0.64%) Apple
15 14 (0.60%) CyberArk
15 14 (0.60%) Freshdesk
15 14 (0.60%) Tanium
16 13 (0.55%) Xamarin
17 8 (0.34%) F5