Object-Oriented Programming (OOP)
UK

The table below provides summary statistics for permanent job vacancies requiring OOP skills. It includes a benchmarking guide to the annual salaries offered in vacancies that cited OOP over the 6 months leading up to 8 December 2024, comparing them to the same period in the previous two years.

6 months to
8 Dec 2024
Same period 2023 Same period 2022
Rank 331 309 223
Rank change year-on-year -22 -86 -35
Permanent jobs citing OOP 569 538 2,059
As % of all permanent jobs advertised in the UK 0.82% 1.02% 1.68%
As % of the Processes & Methodologies category 0.93% 1.08% 1.75%
Number of salaries quoted 377 455 1,402
10th Percentile £35,000 £41,350 £40,459
25th Percentile £48,750 £45,000 £50,000
Median annual salary (50th Percentile) £59,125 £60,000 £70,000
Median % change year-on-year -1.46% -14.29% +27.27%
75th Percentile £72,500 £75,000 £87,500
90th Percentile £100,000 £85,000 £107,500
UK excluding London median annual salary £55,000 £55,000 £60,000
% change year-on-year - -8.33% +20.00%

All Process and Methodology Skills
UK

OOP falls under the Processes and Methodologies category. For comparison with the information above, the following table provides summary statistics for all permanent job vacancies requiring process or methodology skills.

Permanent vacancies with a requirement for process or methodology skills 61,487 49,863 117,613
As % of all permanent jobs advertised in the UK 88.65% 94.11% 95.75%
Number of salaries quoted 28,400 36,022 72,003
10th Percentile £35,000 £32,500 £34,700
25th Percentile £45,000 £43,750 £45,000
Median annual salary (50th Percentile) £60,000 £60,000 £61,000
Median % change year-on-year - -1.64% +1.67%
75th Percentile £78,750 £80,000 £82,500
90th Percentile £97,500 £99,680 £100,000
UK excluding London median annual salary £54,714 £52,500 £53,500
% change year-on-year +4.22% -1.87% +7.00%

OOP
Job Vacancy Trend

Job postings citing OOP as a proportion of all IT jobs advertised.
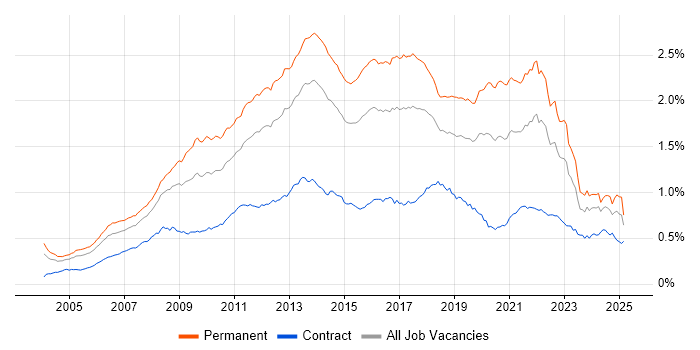
Job vacancy trend for OOP in the UK

OOP
Salary Trend

3-month moving average salary quoted in jobs citing OOP.

Salary trend for OOP in the UK

OOP
Salary Histogram

Salary distribution for jobs citing OOP over the 6 months to 8 December 2024.

Salary histogram for OOP in the UK

OOP
Top 17 Job Locations

The table below looks at the demand and provides a guide to the median salaries quoted in IT jobs citing OOP within the UK over the 6 months to 8 December 2024. The 'Rank Change' column provides an indication of the change in demand within each location based on the same 6 month period last year.

Location Rank Change
on Same Period
Last Year
Matching
Permanent
IT Job Ads
Median Salary
Past 6 Months
Median Salary
% Change
on Same Period
Last Year
Live
Jobs
England -37 520 £60,000 - 175
UK excluding London -27 399 £55,000 - 116
Work from Home -40 217 £57,500 +0.88% 183
London -33 158 £81,250 +16.07% 79
South East -43 105 £52,500 -4.55% 27
North of England -41 103 £52,500 -4.55% 39
South West +28 83 £57,500 +4.55% 7
North West -50 63 £52,500 -12.50% 20
Midlands -46 38 £55,000 -8.33% 15
West Midlands -32 30 £55,000 -18.52% 12
Yorkshire +8 26 £58,750 +6.82% 8
East of England -45 23 £65,000 -3.70% 12
Scotland -2 22 £57,500 +43.75% 12
North East -23 14 £57,500 +33.72% 11
Wales +25 13 £37,500 -25.00% 2
Northern Ireland +30 12 £50,000 - 8
East Midlands -37 8 £37,500 -31.82% 3

OOP
Co-occurring Skills and Capabilities by Category

The follow tables expand on the table above by listing co-occurrences grouped by category. The same employment type, locality and period is covered with up to 20 co-occurrences shown in each of the following categories:

Application Platforms
1 21 (3.69%) Apache
2 18 (3.16%) nginx
3 15 (2.64%) Confluence
4 13 (2.28%) WordPress
5 12 (2.11%) CMS
6 5 (0.88%) Umbraco
6 5 (0.88%) WildFly
7 4 (0.70%) IIS
8 3 (0.53%) Cloud Foundry
8 3 (0.53%) Microsoft Exchange
8 3 (0.53%) SharePoint
9 2 (0.35%) Drupal
10 1 (0.18%) Adobe Experience Manager
10 1 (0.18%) Apache Airflow
10 1 (0.18%) Apache Spark
10 1 (0.18%) Appian
10 1 (0.18%) DataSynapse
10 1 (0.18%) NServiceBus
10 1 (0.18%) Tomcat
Applications
1 9 (1.58%) Microsoft Excel
2 6 (1.05%) Spreadsheet
3 3 (0.53%) InfoPath
3 3 (0.53%) Microsoft Office
3 3 (0.53%) Microsoft PowerPoint
4 1 (0.18%) OrCAD
4 1 (0.18%) Trello
Business Applications
1 3 (0.53%) Dynamics CRM
1 3 (0.53%) SAP S/4HANA
1 3 (0.53%) Shopify
2 1 (0.18%) Magento
Cloud Services
1 148 (26.01%) Azure
2 145 (25.48%) AWS
3 94 (16.52%) GCP
4 35 (6.15%) GitHub
5 26 (4.57%) Azure DevOps
6 25 (4.39%) SaaS
7 17 (2.99%) Datadog
8 14 (2.46%) Cloud Computing
9 12 (2.11%) Serverless
10 9 (1.58%) IBM Cloud
11 8 (1.41%) Azure Sentinel
12 7 (1.23%) Azure Data Factory
12 7 (1.23%) Azure Functions
12 7 (1.23%) Entra ID
13 6 (1.05%) Azure Logic Apps
13 6 (1.05%) Dynamics 365
13 6 (1.05%) Power Platform
14 5 (0.88%) AWS Lambda
14 5 (0.88%) Azure Monitor
14 5 (0.88%) PaaS
Communications & Networking
1 26 (4.57%) Network Security
2 9 (1.58%) HTTP
3 8 (1.41%) Internet
4 7 (1.23%) Wi-Fi
5 4 (0.70%) SMTP
5 4 (0.70%) SNMP
5 4 (0.70%) SSH
5 4 (0.70%) TCP/IP
6 3 (0.53%) FTP
7 2 (0.35%) AMQP
8 1 (0.18%) 5G
8 1 (0.18%) MQTT
8 1 (0.18%) Multicast
8 1 (0.18%) RS-232
8 1 (0.18%) RS-485
Database & Business Intelligence
1 152 (26.71%) MySQL
2 65 (11.42%) SQL Server
3 46 (8.08%) Relational Database
4 43 (7.56%) NoSQL
5 41 (7.21%) PostgreSQL
6 20 (3.51%) MongoDB
7 17 (2.99%) Azure SQL Database
8 11 (1.93%) Big Data
9 9 (1.58%) Data Lake
9 9 (1.58%) DB2
10 7 (1.23%) Redis
10 7 (1.23%) SQLite
11 6 (1.05%) Elasticsearch
11 6 (1.05%) Hadoop
12 5 (0.88%) RDBMS
13 4 (0.70%) SQL Server Reporting Services
14 3 (0.53%) SQL Server Integration Services
15 2 (0.35%) Apache Cassandra
15 2 (0.35%) OLTP
15 2 (0.35%) Oracle OLAP
Development Applications
1 159 (27.94%) Git
2 35 (6.15%) PHPUnit
3 31 (5.45%) JIRA
4 28 (4.92%) Selenium
5 23 (4.04%) Visual Studio
6 13 (2.28%) JUnit
7 11 (1.93%) GitLab
7 11 (1.93%) Visual Studio Code
7 11 (1.93%) webpack
8 10 (1.76%) Jenkins
8 10 (1.76%) Postman
9 9 (1.58%) Bitbucket
9 9 (1.58%) Maven
9 9 (1.58%) TestNG
10 8 (1.41%) Babel
10 8 (1.41%) Cucumber
11 7 (1.23%) Cypress.io
11 7 (1.23%) Mercurial
12 5 (0.88%) Mocha
12 5 (0.88%) Team Foundation Server
General
1 177 (31.11%) Finance
2 112 (19.68%) Social Skills
3 47 (8.26%) Games
4 36 (6.33%) Analytical Skills
5 35 (6.15%) Retail
6 34 (5.98%) Inclusion and Diversity
7 30 (5.27%) Marketing
8 27 (4.75%) Public Sector
9 24 (4.22%) Banking
10 21 (3.69%) Manufacturing
11 10 (1.76%) Electronics
12 8 (1.41%) Investment Banking
13 7 (1.23%) Advertising
13 7 (1.23%) Law
13 7 (1.23%) Legal
13 7 (1.23%) Telecoms
14 6 (1.05%) Automotive
14 6 (1.05%) Back Office
14 6 (1.05%) Retail Banking
14 6 (1.05%) Social Science
Job Titles
1 316 (55.54%) Developer
2 191 (33.57%) Senior
3 107 (18.80%) Software Engineer
4 92 (16.17%) Senior Developer
5 77 (13.53%) PHP Developer
6 64 (11.25%) Web Developer
7 62 (10.90%) Senior Software Engineer
8 51 (8.96%) .NET Developer
9 48 (8.44%) Lead
10 41 (7.21%) PHP Web Developer
11 39 (6.85%) C# Developer
11 39 (6.85%) Senior PHP Developer
12 37 (6.50%) Software Developer
13 34 (5.98%) Backend Developer
14 32 (5.62%) Full-Stack Developer
15 29 (5.10%) Full-Stack Engineer
16 23 (4.04%) Senior Backend Developer
17 22 (3.87%) Senior Web Developer
18 21 (3.69%) Front-End Developer (Client-Side Developer)
19 19 (3.34%) Senior PHP Web Developer
Libraries, Frameworks & Software Standards
1 213 (37.43%) HTML
2 208 (36.56%) CSS
3 162 (28.47%) .NET
4 140 (24.60%) React
5 96 (16.87%) AngularJS
6 84 (14.76%) LAMP
7 64 (11.25%) REST
8 60 (10.54%) RESTful
9 59 (10.37%) Laravel
10 52 (9.14%) ASP.NET
11 50 (8.79%) Web Services
12 49 (8.61%) HTML5
13 47 (8.26%) .NET Framework
14 42 (7.38%) Vue
15 39 (6.85%) Symfony
16 38 (6.68%) .NET Core
17 34 (5.98%) jQuery
18 33 (5.80%) Spring
19 26 (4.57%) Spring Boot
20 25 (4.39%) Flask
Miscellaneous
1 53 (9.31%) Data Structures
2 36 (6.33%) Algorithms
3 32 (5.62%) Greenfield Project
3 32 (5.62%) Mobile App
4 22 (3.87%) Cybercrime
4 22 (3.87%) Product Ownership
5 20 (3.51%) Distributed Systems
6 18 (3.16%) Cloud Native
7 16 (2.81%) Hedge funds
8 15 (2.64%) Legacy Systems
8 15 (2.64%) Self-Motivation
9 14 (2.46%) Management Information System
10 12 (2.11%) Client/Server
11 11 (1.93%) Virtual Team
12 10 (1.76%) Reinsurance
13 9 (1.58%) Blockchain
13 9 (1.58%) e-Learning
13 9 (1.58%) Hybrid Cloud
14 8 (1.41%) Robotics
15 7 (1.23%) Taxonomies
Operating Systems
1 85 (14.94%) Linux
2 35 (6.15%) Windows
3 24 (4.22%) Android
4 15 (2.64%) Apple iOS
5 11 (1.93%) Unix
6 5 (0.88%) Windows Server
7 4 (0.70%) CentOS
8 1 (0.18%) Alpine Linux
8 1 (0.18%) Embedded Linux
8 1 (0.18%) Robot Operating System
Processes & Methodologies
1 364 (63.97%) OO
2 189 (33.22%) Agile
3 183 (32.16%) Software Engineering
4 130 (22.85%) Design Patterns
4 130 (22.85%) Problem-Solving
5 126 (22.14%) MVC
6 124 (21.79%) Web Development
7 102 (17.93%) Microservices
8 101 (17.75%) Full-Stack Development
9 98 (17.22%) Computer Science
9 98 (17.22%) TDD
10 93 (16.34%) CI/CD
10 93 (16.34%) E-Commerce
11 91 (15.99%) DevOps
12 64 (11.25%) Scrum
13 60 (10.54%) SOLID
14 56 (9.84%) Test Automation
15 53 (9.31%) Mathematics
16 50 (8.79%) Unit Testing
17 49 (8.61%) Front End Development
Programming Languages
1 245 (43.06%) JavaScript
2 173 (30.40%) C#
3 168 (29.53%) PHP
4 151 (26.54%) SQL
5 119 (20.91%) Python
6 110 (19.33%) Java
7 46 (8.08%) TypeScript
8 43 (7.56%) C++
9 24 (4.22%) PowerShell
10 18 (3.16%) C
10 18 (3.16%) Kotlin
11 12 (2.11%) Go
11 12 (2.11%) Scala
12 9 (1.58%) Bash
13 8 (1.41%) VB.NET
14 6 (1.05%) Groovy
14 6 (1.05%) Shell Script
15 5 (0.88%) Perl
16 4 (0.70%) T-SQL
16 4 (0.70%) XAML
Qualifications
1 128 (22.50%) Degree
2 52 (9.14%) Computer Science Degree
3 29 (5.10%) Security Cleared
4 23 (4.04%) Master's Degree
5 11 (1.93%) DV Cleared
6 9 (1.58%) Numerate Degree
6 9 (1.58%) SC Cleared
7 8 (1.41%) (ISC)2 CCSP
7 8 (1.41%) CCSP
7 8 (1.41%) Cisco Certification
7 8 (1.41%) CISSP
8 7 (1.23%) HND
9 3 (0.53%) ISTQB
10 1 (0.18%) Microsoft Certification
10 1 (0.18%) PhD
Quality Assurance & Compliance
1 41 (7.21%) QA
2 14 (2.46%) ISO/IEC 27001
3 8 (1.41%) NIST
3 8 (1.41%) SLA
3 8 (1.41%) SOC 2
4 6 (1.05%) Accessibility
5 5 (0.88%) NCSC
6 2 (0.35%) Data Quality
System Software
1 78 (13.71%) Docker
2 4 (0.70%) Active Directory
2 4 (0.70%) VMware Infrastructure
3 3 (0.53%) Virtual Machines
4 1 (0.18%) Slurm Workload Manager
Systems Management
1 53 (9.31%) Kubernetes
2 30 (5.27%) Terraform
3 6 (1.05%) Ansible
4 1 (0.18%) Grafana
4 1 (0.18%) Kibana
4 1 (0.18%) Kustomize
4 1 (0.18%) Packer
4 1 (0.18%) Prometheus
Vendors
1 66 (11.60%) Microsoft
2 37 (6.50%) Google
3 13 (2.28%) Xamarin
4 12 (2.11%) Twitter
5 11 (1.93%) Oracle
6 10 (1.76%) Red Hat
6 10 (1.76%) SAP
7 9 (1.58%) IBM
7 9 (1.58%) Splunk
8 7 (1.23%) ANSYS
8 7 (1.23%) EMC
9 4 (0.70%) DevExpress
9 4 (0.70%) NVIDIA
9 4 (0.70%) VMware
9 4 (0.70%) YouTube
10 3 (0.53%) Sybase
11 2 (0.35%) Databricks
11 2 (0.35%) Facebook
12 1 (0.18%) CyberTech
12 1 (0.18%) Solace