Adobe Jobs in England

Adobe
UK > England

The table below provides summary statistics for permanent job vacancies advertised in England with a requirement for knowledge and experience of Adobe products and/or services. Included is a benchmarking guide to the salaries offered in vacancies that have cited Adobe over the 6 months to 13 May 2024 with a comparison to the same period in the previous 2 years.

The figures below represent the IT labour market in general and are not representative of salaries within Adobe Systems, Inc.

6 months to
13 May 2024
Same period 2023 Same period 2022
Rank 275 276 217
Rank change year-on-year +1 -59 +73
Permanent jobs citing Adobe 861 1,174 2,522
As % of all permanent jobs advertised in England 1.00% 1.30% 1.88%
As % of the Vendors category 2.72% 3.09% 4.84%
Number of salaries quoted 622 570 854
10th Percentile £25,000 £29,500 £29,111
25th Percentile £28,000 £37,500 £36,438
Median annual salary (50th Percentile) £38,000 £50,119 £52,500
Median % change year-on-year -24.18% -4.54% +5.00%
75th Percentile £50,000 £68,750 £70,000
90th Percentile £63,675 £85,000 £91,250
UK median annual salary £38,000 £50,238 £52,500
% change year-on-year -24.36% -4.31% +8.25%

All Vendors
England

Adobe is in the Vendor Products and Services category. The following table is for comparison with the above and provides summary statistics for all permanent job vacancies with a requirement for knowledge or experience of vendor products and services advertised in England.

Permanent vacancies with a requirement for knowledge or experience of vendor products and services 31,674 37,936 52,068
As % of all permanent jobs advertised in England 36.95% 42.11% 38.83%
Number of salaries quoted 22,619 21,811 28,990
10th Percentile £26,500 £31,000 £30,000
25th Percentile £35,750 £41,250 £40,000
Median annual salary (50th Percentile) £50,000 £57,500 £55,000
Median % change year-on-year -13.04% +4.55% +3.77%
75th Percentile £68,750 £75,000 £75,000
90th Percentile £87,500 £93,750 £90,000
UK median annual salary £50,000 £57,500 £55,000
% change year-on-year -13.04% +4.55% +4.76%

Adobe
Job Vacancy Trend in England

Job postings citing Adobe as a proportion of all IT jobs advertised in England.
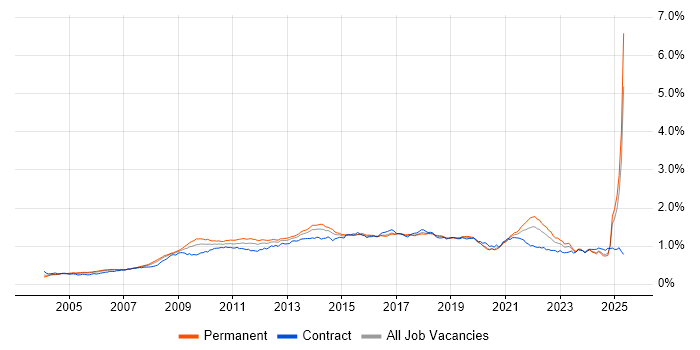
Job vacancy trend for Adobe in England

Adobe
Salary Trend in England

3-month moving average salary quoted in jobs citing Adobe in England.

Salary trend for Adobe in England

Adobe
Salary Histogram in England

Salary distribution for jobs citing Adobe in England over the 6 months to 13 May 2024.

Salary histogram for Adobe in England

Adobe
Job Locations in England

The table below looks at the demand and provides a guide to the median salaries quoted in IT jobs citing Adobe within the England region over the 6 months to 13 May 2024. The 'Rank Change' column provides an indication of the change in demand within each location based on the same 6 month period last year.

Location Rank Change
on Same Period
Last Year
Matching
Permanent
IT Job Ads
Median Salary
Past 6 Months
Median Salary
% Change
on Same Period
Last Year
Live
Jobs
London -2 258 £50,000 -9.09% 196
South East +16 178 £33,000 -20.00% 49
North of England -40 178 £35,000 -30.33% 73
Midlands +90 138 £37,500 -1.32% 45
North West +48 133 £37,500 -27.00% 42
West Midlands +82 96 £38,000 -3.18% 26
East of England -37 54 £28,500 -48.18% 17
South West -11 52 £35,000 -12.50% 21
East Midlands +26 42 £32,000 -15.79% 19
Yorkshire -75 40 £35,000 -17.65% 23
North East -2 5 £30,000 -36.84% 8
Adobe
UK

Adobe
Co-occurring Skills and Capabilities in England by Category

The follow tables expand on the table above by listing co-occurrences grouped by category. The same employment type, locality and period is covered with up to 20 co-occurrences shown in each of the following categories:

Application Platforms
1 76 (8.83%) CMS
2 69 (8.01%) WordPress
3 33 (3.83%) Adobe Experience Manager
4 17 (1.97%) Microsoft Exchange
5 13 (1.51%) Umbraco
6 10 (1.16%) Confluence
7 9 (1.05%) SAS
8 7 (0.81%) IIS
9 6 (0.70%) Apache Solr
9 6 (0.70%) SharePoint
9 6 (0.70%) Sitecore CMS
10 4 (0.46%) Apache
10 4 (0.46%) ColdFusion
11 2 (0.23%) Apache Airflow
11 2 (0.23%) Drupal
12 1 (0.12%) EPiServer
12 1 (0.12%) Headless CMS
12 1 (0.12%) NetWeaver
Applications
1 214 (24.85%) Photoshop
2 189 (21.95%) Adobe Creative Suite
3 175 (20.33%) Adobe Illustrator
4 126 (14.63%) InDesign
5 87 (10.10%) Adobe XD
6 84 (9.76%) Microsoft Office
7 65 (7.55%) Sketch
8 63 (7.32%) Adobe After Effects
9 57 (6.62%) Adobe Premiere
10 49 (5.69%) Microsoft PowerPoint
11 40 (4.65%) Microsoft Excel
12 27 (3.14%) Adobe Captivate
13 16 (1.86%) InVision
14 15 (1.74%) AutoCAD
15 13 (1.51%) Trello
16 12 (1.39%) Revit
17 11 (1.28%) Acrobat
17 11 (1.28%) CINEMA 4D
18 10 (1.16%) SketchUp
19 9 (1.05%) Blender
Business Applications
1 28 (3.25%) Magento
2 19 (2.21%) Shopify
3 16 (1.86%) Adobe Campaign
4 14 (1.63%) SDL Web 8
5 3 (0.35%) Elite 3E
6 2 (0.23%) SAP S/4HANA
6 2 (0.23%) Workfront
7 1 (0.12%) Carpe Diem
7 1 (0.12%) Dynamics CRM
7 1 (0.12%) Dynamics NAV
7 1 (0.12%) Exchequer
7 1 (0.12%) FastStats
7 1 (0.12%) Sage 200
7 1 (0.12%) SAP ERP
7 1 (0.12%) Sprinklr
7 1 (0.12%) Unica
7 1 (0.12%) WebTrends
Cloud Services
1 119 (13.82%) Figma
2 107 (12.43%) Adobe Creative Cloud
3 78 (9.06%) Microsoft 365
4 55 (6.39%) AWS
5 49 (5.69%) Azure
6 40 (4.65%) Google Analytics
7 36 (4.18%) SaaS
8 29 (3.37%) Adobe Analytics
9 20 (2.32%) Canva
9 20 (2.32%) Entra ID
10 16 (1.86%) Power Platform
11 14 (1.63%) Amazon EC2
11 14 (1.63%) Amazon S3
11 14 (1.63%) NuGet
12 12 (1.39%) Azure DevOps
13 11 (1.28%) MailChimp
14 10 (1.16%) WhatsApp
15 9 (1.05%) GCP
16 8 (0.93%) Google Ads
17 7 (0.81%) Serverless
Communications & Networking
1 36 (4.18%) SD-WAN
1 36 (4.18%) WAN
2 24 (2.79%) Unified Communications
3 21 (2.44%) Cisco Firepower
3 21 (2.44%) DNS
4 19 (2.21%) DHCP
5 12 (1.39%) Intranet
6 8 (0.93%) Internet
7 6 (0.70%) VLAN
7 6 (0.70%) Wi-Fi
8 5 (0.58%) Firewall
8 5 (0.58%) Structured Cabling
9 4 (0.46%) SMS
10 3 (0.35%) LAN
10 3 (0.35%) RIP
10 3 (0.35%) VPN
11 2 (0.23%) Extranet
11 2 (0.23%) Remote Desktop
11 2 (0.23%) SNA
11 2 (0.23%) Wireless
Database & Business Intelligence
1 42 (4.88%) SQL Server
2 15 (1.74%) Power BI
3 14 (1.63%) MySQL
3 14 (1.63%) Tableau
4 7 (0.81%) Data Lake
5 6 (0.70%) Azure SQL Database
6 4 (0.46%) BigQuery
6 4 (0.46%) Metadata
7 2 (0.23%) Amazon Redshift
7 2 (0.23%) Looker
7 2 (0.23%) phpMyAdmin
7 2 (0.23%) QlikView
7 2 (0.23%) Relational Database
7 2 (0.23%) SQL Server Reporting Services
8 1 (0.12%) Big Data
8 1 (0.12%) Geospatial Data
8 1 (0.12%) GIS
8 1 (0.12%) Jackrabbit
8 1 (0.12%) SAP HANA
Development Applications
1 46 (5.34%) Git
2 41 (4.76%) JIRA
3 18 (2.09%) Axure RP
4 17 (1.97%) Visual Studio
5 14 (1.63%) Balsamiq
5 14 (1.63%) git-flow
5 14 (1.63%) Moq
5 14 (1.63%) NUnit
5 14 (1.63%) Octopus Deploy
5 14 (1.63%) Sourcetree
5 14 (1.63%) SpecFlow
5 14 (1.63%) TeamCity
6 9 (1.05%) Jenkins
7 8 (0.93%) Cucumber
8 6 (0.70%) Cypress.io
9 4 (0.46%) Bitbucket
9 4 (0.46%) Jasmine
9 4 (0.46%) Visual Website Optimizer
10 3 (0.35%) WiX
11 2 (0.23%) gulp
General
1 288 (33.45%) Marketing
2 279 (32.40%) Social Skills
3 93 (10.80%) Retail
4 78 (9.06%) Finance
5 70 (8.13%) Analytical Skills
6 49 (5.69%) Organisational Skills
7 46 (5.34%) Advertising
8 42 (4.88%) Presentation Skills
9 41 (4.76%) Inclusion and Diversity
10 35 (4.07%) Publishing
11 34 (3.95%) Games
12 30 (3.48%) Public Sector
13 20 (2.32%) Legal
14 18 (2.09%) Multimedia
15 15 (1.74%) Automotive
15 15 (1.74%) Electronics
16 13 (1.51%) Manufacturing
17 9 (1.05%) Law
18 8 (0.93%) Banking
18 8 (0.93%) Influencing Skills
Job Titles
1 244 (28.34%) Designer
2 112 (13.01%) Developer
3 110 (12.78%) Senior
4 71 (8.25%) Graphic Designer
5 57 (6.62%) Analyst
5 57 (6.62%) Consultant
6 53 (6.16%) UX Designer
7 50 (5.81%) Architect
8 42 (4.88%) UI Designer
9 36 (4.18%) Cisco Architect
9 36 (4.18%) Senior Architect
9 36 (4.18%) Senior Cisco Architect
10 35 (4.07%) Digital Designer
11 31 (3.60%) Front-End Developer (Client-Side Developer)
11 31 (3.60%) Junior
11 31 (3.60%) UI/UX Designer
12 30 (3.48%) Senior Designer
12 30 (3.48%) Technical Consultant
13 28 (3.25%) Project Manager
14 26 (3.02%) Artworker
Libraries, Frameworks & Software Standards
1 183 (21.25%) HTML
2 152 (17.65%) CSS
3 54 (6.27%) React
4 37 (4.30%) HTML5
5 36 (4.18%) XML
6 34 (3.95%) Web Services
7 29 (3.37%) jQuery
8 26 (3.02%) .NET
9 22 (2.56%) AngularJS
10 20 (2.32%) SOAP
11 19 (2.21%) RESTful
12 18 (2.09%) Sass
13 16 (1.86%) ASP.NET
13 16 (1.86%) ASP.NET MVC
13 16 (1.86%) Vue
14 14 (1.63%) .NET Framework
14 14 (1.63%) ASP.NET MVC 5
14 14 (1.63%) Code First Entity Framework
14 14 (1.63%) Entity Framework
14 14 (1.63%) Semantic HTML
Miscellaneous
1 118 (13.70%) Data Centre
2 112 (13.01%) Graphic Design
3 108 (12.54%) Social Media
4 54 (6.27%) Animation
5 49 (5.69%) Self-Motivation
6 46 (5.34%) Product Ownership
7 37 (4.30%) e-Learning
8 33 (3.83%) Photography
9 30 (3.48%) Public Cloud
10 28 (3.25%) Blog
11 26 (3.02%) Private Cloud
12 25 (2.90%) Motion Graphics
13 23 (2.67%) Video Editing
14 21 (2.44%) Onboarding
15 17 (1.97%) Digital Signage
15 17 (1.97%) Greenfield Project
16 15 (1.74%) Management Information System
17 14 (1.63%) Legacy Code
17 14 (1.63%) Mobile App
18 13 (1.51%) Digital Media
Operating Systems
1 127 (14.75%) Windows
2 50 (5.81%) Windows 10
3 21 (2.44%) Windows Server
4 17 (1.97%) Mac OS
5 15 (1.74%) Windows Server 2019
6 11 (1.28%) Windows Server 2012
7 10 (1.16%) Windows Server 2016
8 7 (0.81%) Apple iOS
9 4 (0.46%) Linux
10 3 (0.35%) Android
11 2 (0.23%) VMS
12 1 (0.12%) Windows 7
12 1 (0.12%) Windows XP
Processes & Methodologies
1 216 (25.09%) User Experience
2 156 (18.12%) Cybersecurity
3 147 (17.07%) Software Licensing
4 139 (16.14%) Presales
5 129 (14.98%) Problem-Solving
6 110 (12.78%) Analytics
6 110 (12.78%) UX Design
7 109 (12.66%) Agile
8 85 (9.87%) E-Commerce
9 75 (8.71%) Time Management
10 71 (8.25%) Project Management
11 69 (8.01%) Wireframes
12 60 (6.97%) DevOps
13 57 (6.62%) Customer Experience
14 55 (6.39%) Mentoring
15 53 (6.16%) Digital Marketing
16 52 (6.04%) Front End Development
17 50 (5.81%) Typography
18 49 (5.69%) CRM
19 48 (5.57%) SEO
Programming Languages
1 130 (15.10%) JavaScript
2 47 (5.46%) SQL
3 28 (3.25%) C#
4 26 (3.02%) PHP
4 26 (3.02%) TypeScript
5 23 (2.67%) R
6 18 (2.09%) Python
7 17 (1.97%) Java
8 14 (1.63%) T-SQL
8 14 (1.63%) XPath
9 8 (0.93%) Scala
10 4 (0.46%) CFML
11 2 (0.23%) Apex Code
11 2 (0.23%) JSX
12 1 (0.12%) ABAP
12 1 (0.12%) Groovy
12 1 (0.12%) PowerShell
Qualifications
1 259 (30.08%) Degree
2 50 (5.81%) Microsoft Certification
3 38 (4.41%) CCNA
3 38 (4.41%) Cisco Certification
4 36 (4.18%) CCNP
5 28 (3.25%) MCP
6 17 (1.97%) AWS Certification
7 12 (1.39%) AWS Certified Solutions Architect
8 10 (1.16%) DBS Check
9 9 (1.05%) CIPD
9 9 (1.05%) HND
10 6 (0.70%) Azure Certification
10 6 (0.70%) Master's Degree
11 4 (0.46%) Computer Science Degree
12 3 (0.35%) A+ Certification
12 3 (0.35%) PMI Certification
12 3 (0.35%) PRINCE2 Practitioner
12 3 (0.35%) Security Cleared
13 2 (0.23%) ITIL Certification
13 2 (0.23%) MCSE
Quality Assurance & Compliance
1 57 (6.62%) Accessibility
2 21 (2.44%) GDPR
3 14 (1.63%) Actionable Recommendations
3 14 (1.63%) WCAG
4 13 (1.51%) QA
5 4 (0.46%) SLA
6 3 (0.35%) Data Quality
6 3 (0.35%) PMO
7 2 (0.23%) ISO 9001
7 2 (0.23%) ISO/IEC 17025
7 2 (0.23%) ITGC
7 2 (0.23%) PMBOK
7 2 (0.23%) Sarbanes-Oxley
8 1 (0.12%) NEBOSH
System Software
1 66 (7.67%) Active Directory
2 6 (0.70%) Docker
3 5 (0.58%) Virtual Desktop
4 3 (0.35%) Microsoft Virtual Server
4 3 (0.35%) Virtual Servers
5 2 (0.23%) Hyper-V
5 2 (0.23%) VMware Infrastructure
6 1 (0.12%) XenApp
Systems Management
1 21 (2.44%) Stealthwatch
2 19 (2.21%) Microsoft Intune
3 15 (1.74%) CASB
4 3 (0.35%) Jamf Pro
4 3 (0.35%) SCCM
5 2 (0.23%) cPanel
5 2 (0.23%) Kubernetes
6 1 (0.12%) WSUS
Vendors
1 289 (33.57%) Microsoft
2 153 (17.77%) Apple
3 69 (8.01%) Google
4 38 (4.41%) Cisco
5 37 (4.30%) HP
5 37 (4.30%) Meraki
6 34 (3.95%) Dell
7 32 (3.72%) Salesforce
7 32 (3.72%) Samsung
8 18 (2.09%) Intel
9 16 (1.86%) Instagram
10 14 (1.63%) Cognizant
11 13 (1.51%) Marketo
12 12 (1.39%) Autodesk
12 12 (1.39%) Citrix
12 12 (1.39%) YouTube
13 11 (1.28%) Facebook
13 11 (1.28%) Snow
14 9 (1.05%) HubSpot
14 9 (1.05%) SAP