Digital Transformation Programme Jobs in England

Digital Transformation Programmes/Projects
UK > England

The table below provides summary statistics for permanent job vacancies advertised in England requiring Digital Transformation Programme skills. It includes a benchmarking guide to the annual salaries offered in vacancies that cited Digital Transformation Programme over the 6 months leading up to 28 May 2025, comparing them to the same period in the previous two years.

6 months to
28 May 2025
Same period 2024 Same period 2023
Rank 444 396 356
Rank change year-on-year -48 -40 +41
Permanent jobs citing Digital Transformation Programme 252 541 800
As % of all permanent jobs advertised in England 0.52% 0.61% 0.92%
As % of the Processes & Methodologies category 0.55% 0.73% 0.96%
Number of salaries quoted 127 396 439
10th Percentile £43,750 £40,000 £38,719
25th Percentile £50,000 £43,191 £51,250
Median annual salary (50th Percentile) £65,000 £60,000 £70,000
Median % change year-on-year +8.33% -14.29% -
75th Percentile £86,250 £75,000 £80,000
90th Percentile £95,400 £87,500 £95,000
UK median annual salary £60,000 £60,000 £68,497
% change year-on-year - -12.40% -2.15%

All Process and Methodology Skills
England

Digital Transformation Programme falls under the Processes and Methodologies category. For comparison with the information above, the following table provides summary statistics for all permanent job vacancies requiring process or methodology skills in England.

Permanent vacancies with a requirement for process or methodology skills 45,477 74,482 83,229
As % of all permanent jobs advertised in England 94.01% 84.24% 95.56%
Number of salaries quoted 22,533 54,432 49,691
10th Percentile £29,625 £29,000 £34,375
25th Percentile £41,250 £40,000 £46,105
Median annual salary (50th Percentile) £57,500 £55,000 £62,500
Median % change year-on-year +4.55% -12.00% +4.17%
75th Percentile £75,000 £72,500 £82,500
90th Percentile £98,695 £93,750 £102,500
UK median annual salary £57,500 £55,000 £61,000
% change year-on-year +4.55% -9.84% +1.67%

Digital Transformation Programme
Job Vacancy Trend in England

Job postings citing Digital Transformation Programme as a proportion of all IT jobs advertised in England.
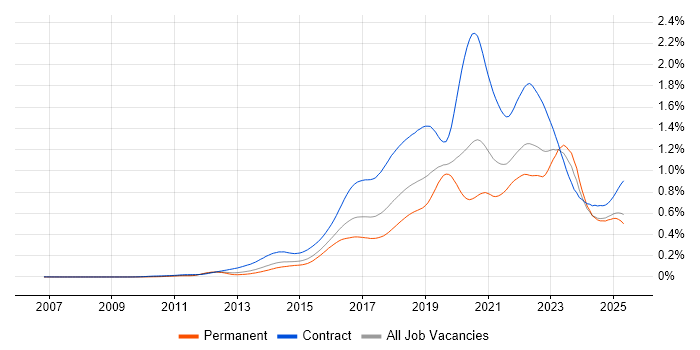
Job vacancy trend for Digital Transformation Programme in England

Digital Transformation Programme
Salary Trend in England

3-month moving average salary quoted in jobs citing Digital Transformation Programme in England.

Salary trend for Digital Transformation Programme in England

Digital Transformation Programme
Salary Histogram in England

Salary distribution for jobs citing Digital Transformation Programme in England over the 6 months to 28 May 2025.

Salary histogram for Digital Transformation Programme in England

Digital Transformation Programme
Job Locations in England

The table below looks at the demand and provides a guide to the median salaries quoted in IT jobs citing Digital Transformation Programme within the England region over the 6 months to 28 May 2025. The 'Rank Change' column provides an indication of the change in demand within each location based on the same 6 month period last year.

Location Rank Change
on Same Period
Last Year
Matching
Permanent
IT Job Ads
Median Salary
Past 6 Months
Median Salary
% Change
on Same Period
Last Year
Live
Jobs
London +46 95 £90,000 +27.66% 209
South East +84 50 £60,000 - 83
Midlands +11 35 £57,500 +4.55% 37
North of England -80 25 £65,000 +13.04% 85
East of England +51 24 £52,500 +10.53% 14
West Midlands +24 21 £48,000 -21.58% 19
South West +77 15 £60,125 +20.25% 24
North West -72 13 £55,000 -10.14% 52
East Midlands +30 12 £60,000 +37.16% 17
Yorkshire +26 9 £67,500 +22.73% 16
North East +27 3 £55,000 +18.33% 19
Digital Transformation Programme
UK

Digital Transformation Programme
Co-occurring Skills and Capabilities in England by Category

The follow tables expand on the table above by listing co-occurrences grouped by category. The same employment type, locality and period is covered with up to 20 co-occurrences shown in each of the following categories:

Application Platforms
1 8 (3.17%) CMS
1 8 (3.17%) SharePoint
2 4 (1.59%) Umbraco
3 2 (0.79%) Apache Spark
3 2 (0.79%) DNN
3 2 (0.79%) Kentico
3 2 (0.79%) nginx
3 2 (0.79%) Sitecore CMS
3 2 (0.79%) Sitefinity
3 2 (0.79%) WordPress
4 1 (0.40%) Apache
4 1 (0.40%) Apache Airflow
4 1 (0.40%) BizTalk Server
4 1 (0.40%) Headless CMS
4 1 (0.40%) Mendix
4 1 (0.40%) Microsoft Exchange
4 1 (0.40%) OpenEdge
4 1 (0.40%) Oracle Workflow
4 1 (0.40%) WebLogic
Applications
1 17 (6.75%) Microsoft Office
2 8 (3.17%) Maya
3 6 (2.38%) Microsoft Excel
4 4 (1.59%) Microsoft Project
4 4 (1.59%) MS Visio
5 3 (1.19%) Microsoft PowerPoint
6 1 (0.40%) Trello
Business Applications
1 11 (4.37%) Dynamics CRM
2 3 (1.19%) SAP S/4HANA
3 2 (0.79%) Sage 200
4 1 (0.40%) Dynamics AX
4 1 (0.40%) iTrent
4 1 (0.40%) Lorenzo
4 1 (0.40%) Oracle EBS
4 1 (0.40%) Oracle Payables
4 1 (0.40%) SAP CO
4 1 (0.40%) SAP FI
4 1 (0.40%) SAP FI/CO
4 1 (0.40%) SAP SCM
4 1 (0.40%) Shopify
4 1 (0.40%) SystmOne
4 1 (0.40%) Visualfiles
Cloud Services
1 39 (15.48%) Azure
2 33 (13.10%) Power Platform
3 32 (12.70%) AWS
4 13 (5.16%) Dynamics 365
5 12 (4.76%) GCP
6 10 (3.97%) Microsoft 365
6 10 (3.97%) Microsoft Copilot
7 9 (3.57%) Amazon SageMaker
7 9 (3.57%) Azure DevOps
7 9 (3.57%) Boomi
7 9 (3.57%) SaaS
8 8 (3.17%) GitHub
8 8 (3.17%) Salesforce Commerce Cloud
9 5 (1.98%) Entra ID
9 5 (1.98%) GitHub Actions
10 4 (1.59%) Cloud Computing
10 4 (1.59%) PaaS
11 3 (1.19%) AWS CloudFormation
11 3 (1.19%) PowerApps
11 3 (1.19%) Snowflake
Communications & Networking
1 7 (2.78%) Firewall
2 6 (2.38%) DNS
3 4 (1.59%) DHCP
3 4 (1.59%) TCP/IP
3 4 (1.59%) VLAN
4 2 (0.79%) Network Security
5 1 (0.40%) Broadband
5 1 (0.40%) VoIP
Database & Business Intelligence
1 18 (7.14%) Power BI
2 12 (4.76%) Tableau
3 9 (3.57%) Data Lake
4 6 (2.38%) NoSQL
5 4 (1.59%) SQL Server
6 3 (1.19%) Hadoop
7 2 (0.79%) Big Data
7 2 (0.79%) BigQuery
7 2 (0.79%) DTS
7 2 (0.79%) Electronic Patient Records
7 2 (0.79%) Metadata
8 1 (0.40%) HBase
8 1 (0.40%) KDB
8 1 (0.40%) MySQL
8 1 (0.40%) Oracle Database
8 1 (0.40%) Relational Database
8 1 (0.40%) SAP HANA
8 1 (0.40%) SQL Server Analysis Services
8 1 (0.40%) SQL Server Integration Services
8 1 (0.40%) SQL Server Reporting Services
Development Applications
1 4 (1.59%) Jenkins
1 4 (1.59%) JIRA
2 1 (0.40%) CircleCI
2 1 (0.40%) Git
2 1 (0.40%) IBM UrbanCode
2 1 (0.40%) Jasmine
2 1 (0.40%) Karma Test Runner
2 1 (0.40%) Octopus Deploy
2 1 (0.40%) Protractor
2 1 (0.40%) Subversion
2 1 (0.40%) Team Foundation Server
2 1 (0.40%) TeamCity
2 1 (0.40%) Travis CI
2 1 (0.40%) Vite
General
1 87 (34.52%) Social Skills
2 81 (32.14%) Finance
3 75 (29.76%) Law
4 55 (21.83%) Analytical Skills
5 20 (7.94%) Retail
6 17 (6.75%) Marketing
7 14 (5.56%) Games
8 12 (4.76%) Manufacturing
9 11 (4.37%) Banking
9 11 (4.37%) Legal
9 11 (4.37%) Presentation Skills
10 9 (3.57%) Pharmaceutical
11 8 (3.17%) Public Sector
12 7 (2.78%) Inclusion and Diversity
13 4 (1.59%) Retail Banking
14 3 (1.19%) Automotive
14 3 (1.19%) Private Banking
14 3 (1.19%) Telecoms
15 2 (0.79%) Back Office
15 2 (0.79%) Publishing
Job Titles
1 58 (23.02%) Senior
2 51 (20.24%) Architect
3 40 (15.87%) Lead
4 37 (14.68%) Senior Architect
5 36 (14.29%) Solutions Architect
6 29 (11.51%) Senior Solutions Architect
7 28 (11.11%) ServiceNow Architect
8 25 (9.92%) Analyst
9 19 (7.54%) Project Manager
10 15 (5.95%) Developer
11 13 (5.16%) Business Analyst
12 9 (3.57%) Salesforce Architect
13 8 (3.17%) CRM Architect
13 8 (3.17%) IT Architect
13 8 (3.17%) Senior Manager
13 8 (3.17%) Senior Salesforce Architect
14 7 (2.78%) Consultant
14 7 (2.78%) Digital Transformation
14 7 (2.78%) Junior
15 6 (2.38%) Cloud Engineer
Libraries, Frameworks & Software Standards
1 11 (4.37%) React
2 9 (3.57%) Keras
2 9 (3.57%) NumPy
2 9 (3.57%) PyTorch
2 9 (3.57%) scikit-learn
2 9 (3.57%) TensorFlow
3 6 (2.38%) .NET
3 6 (2.38%) Node.js
4 5 (1.98%) CSS
5 4 (1.59%) HTML
6 3 (1.19%) AngularJS
6 3 (1.19%) Middleware
6 3 (1.19%) RESTful
7 2 (0.79%) GraphQL
7 2 (0.79%) Kafka
7 2 (0.79%) Loki
7 2 (0.79%) MACH
7 2 (0.79%) Redux
7 2 (0.79%) REST
7 2 (0.79%) Web Services
Miscellaneous
1 13 (5.16%) Cloud Native
2 11 (4.37%) Algorithms
2 11 (4.37%) Product Ownership
3 9 (3.57%) Analytical Mindset
3 9 (3.57%) Enterprise Software
4 8 (3.17%) NHS
4 8 (3.17%) Self-Motivation
5 7 (2.78%) Legacy Systems
6 5 (1.98%) Microsoft Licensing
6 5 (1.98%) Operational Technology
7 4 (1.59%) Cloud Security Posture
7 4 (1.59%) Security Posture
8 3 (1.19%) Distributed Systems
8 3 (1.19%) Foreign Exchange (FX)
8 3 (1.19%) Hybrid Cloud
8 3 (1.19%) Legacy Applications
9 2 (0.79%) Driving Licence
9 2 (0.79%) Greenfield Project
9 2 (0.79%) PMI
9 2 (0.79%) Private Cloud
Operating Systems
1 8 (3.17%) Windows
2 2 (0.79%) Linux
Processes & Methodologies
1 89 (35.32%) Agile
2 69 (27.38%) Project Management
3 68 (26.98%) Roadmaps
4 66 (26.19%) User Experience
5 64 (25.40%) Continuous Improvement
6 58 (23.02%) Problem-Solving
7 54 (21.43%) Artificial Intelligence
8 46 (18.25%) Computer Science
9 45 (17.86%) Stakeholder Engagement
10 42 (16.67%) Business Strategy
11 41 (16.27%) Service Delivery
12 38 (15.08%) Change Management
13 36 (14.29%) Analytics
13 36 (14.29%) Project Delivery
13 36 (14.29%) Stakeholder Management
14 35 (13.89%) Decision-Making
14 35 (13.89%) Workflow
15 32 (12.70%) Product Strategy
15 32 (12.70%) Thought Leadership
16 31 (12.30%) Product Roadmap
Programming Languages
1 31 (12.30%) Python
2 19 (7.54%) SQL
3 10 (3.97%) JavaScript
4 9 (3.57%) TypeScript
5 7 (2.78%) C#
5 7 (2.78%) Java
6 6 (2.38%) Go
7 3 (1.19%) C++
8 2 (0.79%) Apex Code
8 2 (0.79%) Bash
8 2 (0.79%) PowerShell
9 1 (0.40%) ABAP
9 1 (0.40%) Bicep
9 1 (0.40%) C
9 1 (0.40%) PL/SQL
9 1 (0.40%) R
9 1 (0.40%) VBA
Qualifications
1 68 (26.98%) Degree
2 34 (13.49%) Computer Science Degree
3 27 (10.71%) PMI Certification
4 26 (10.32%) PMP
5 22 (8.73%) Security Cleared
6 15 (5.95%) SC Cleared
7 9 (3.57%) PhD
8 7 (2.78%) Azure Certification
8 7 (2.78%) Microsoft Certification
9 5 (1.98%) BPSS Clearance
10 3 (1.19%) ACCA
10 3 (1.19%) CISM
10 3 (1.19%) CISSP
10 3 (1.19%) PRINCE2 Practitioner
11 2 (0.79%) AWS Certification
11 2 (0.79%) CBAP
11 2 (0.79%) CESG Certified Professional
11 2 (0.79%) ISO 27001 Lead Auditor
11 2 (0.79%) Master's Degree
11 2 (0.79%) TOGAF Certification
Quality Assurance & Compliance
1 12 (4.76%) GDPR
2 8 (3.17%) PMO
2 8 (3.17%) QA
3 6 (2.38%) Data Quality
3 6 (2.38%) ISO/IEC 27001
4 4 (1.59%) NIST
5 3 (1.19%) Def Stans
5 3 (1.19%) GRC
5 3 (1.19%) RMADS
5 3 (1.19%) Sarbanes-Oxley
6 2 (0.79%) Cyber Essentials
6 2 (0.79%) PCI DSS
6 2 (0.79%) SLA
7 1 (0.40%) Accessibility
7 1 (0.40%) COBIT
7 1 (0.40%) DICOM
7 1 (0.40%) HL7
7 1 (0.40%) SNOMED CT
7 1 (0.40%) WCAG
System Software
1 11 (4.37%) Docker
2 6 (2.38%) Active Directory
3 1 (0.40%) HDFS
Systems Management
1 11 (4.37%) Kubernetes
2 10 (3.97%) Terraform
3 2 (0.79%) Ansible
3 2 (0.79%) Grafana
4 1 (0.40%) Automic
4 1 (0.40%) Consul
4 1 (0.40%) Marathon
4 1 (0.40%) Rancher
Vendors
1 54 (21.43%) Microsoft
2 44 (17.46%) SAP
3 38 (15.08%) ServiceNow
4 29 (11.51%) Salesforce
5 19 (7.54%) Concur
5 19 (7.54%) Workday
6 12 (4.76%) Oracle
7 9 (3.57%) MuleSoft
8 8 (3.17%) Adobe
8 8 (3.17%) Dell
8 8 (3.17%) Google
9 6 (2.38%) Hitachi
10 2 (0.79%) Foundry
10 2 (0.79%) Palantir
10 2 (0.79%) Sage
10 2 (0.79%) Salesforce Marketing Cloud
10 2 (0.79%) Sitecore
11 1 (0.40%) Blue Prism
11 1 (0.40%) MEDITECH
11 1 (0.40%) SnapLogic