GAP Analysis Jobs with Hybrid/Remote/WFH Options

GAP Analysis
UK > Work from Home

The table below provides summary statistics for permanent remote or hybrid work requiring GAP Analysis skills. It includes a benchmarking guide to the annual salaries offered in vacancies that cited GAP Analysis over the 6 months leading up to 3 May 2025, comparing them to the same period in the previous two years.

6 months to
3 May 2025
Same period 2024 Same period 2023
Rank 382 480 511
Rank change year-on-year +98 +31 +114
Permanent jobs citing GAP Analysis 35 105 167
As % of all permanent jobs with a WFH option 0.23% 0.31% 0.39%
As % of the Processes & Methodologies category 0.25% 0.34% 0.41%
Number of salaries quoted 24 95 111
10th Percentile £37,950 £40,250 £42,750
25th Percentile £39,000 £45,000 £46,250
Median annual salary (50th Percentile) £51,250 £52,500 £60,000
Median % change year-on-year -2.38% -12.50% -
75th Percentile £65,875 £80,000 £91,250
90th Percentile £87,625 £87,500 £103,750
UK median annual salary £55,000 £62,500 £62,500
% change year-on-year -12.00% - +4.17%

All Process and Methodology Skills
Work from Home

GAP Analysis falls under the Processes and Methodologies category. For comparison with the information above, the following table provides summary statistics for all permanent job vacancies with remote or hybrid options requiring process or methodology skills.

Permanent vacancies with a requirement for process or methodology skills 14,134 30,993 40,912
As % of all permanent jobs with a WFH option 93.17% 91.62% 96.10%
Number of salaries quoted 9,780 23,560 28,419
10th Percentile £30,000 £33,750 £37,500
25th Percentile £45,000 £42,500 £47,500
Median annual salary (50th Percentile) £60,000 £57,500 £62,500
Median % change year-on-year +4.35% -8.00% +4.17%
75th Percentile £77,500 £75,000 £82,500
90th Percentile £102,500 £95,000 £100,000
UK median annual salary £57,500 £55,000 £61,500
% change year-on-year +4.55% -10.57% +2.50%

GAP Analysis
Trend for Jobs with a WFH Option

Job vacancies with remote working options citing GAP Analysis as a proportion of all IT jobs advertised.
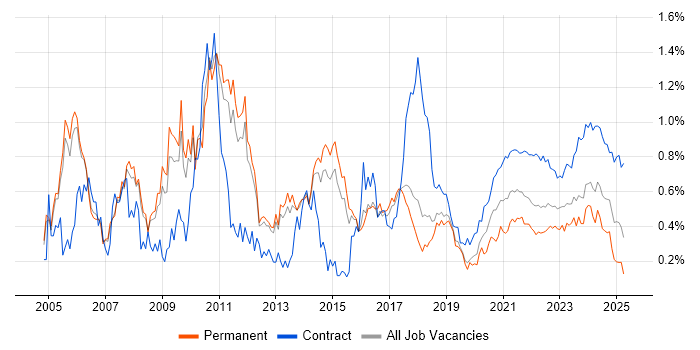
GAP Analysis trend for jobs with Hybrid/Remote/WFH options

GAP Analysis
Salary Trend for Jobs with a WFH Option

3-month moving average salary quoted in job vacancies with remote working options citing GAP Analysis.

GAP Analysis salary trend for jobs with a WFH option

GAP Analysis
Salary Histogram for Jobs with a WFH Option

Salary distribution for jobs with remote working options citing GAP Analysis over the 6 months to 3 May 2025.

GAP Analysis salary histogram for jobs with a WFH option

GAP Analysis
Co-occurring Skills and Capabilities with WFH Options by Category

The follow tables expand on the table above by listing co-occurrences grouped by category. The same employment type, locality and period is covered with up to 20 co-occurrences shown in each of the following categories:

Application Platforms
1 9 (25.71%) CMS
2 7 (20.00%) Sitecore CMS
3 2 (5.71%) Oracle Workflow
3 2 (5.71%) Umbraco
3 2 (5.71%) WordPress
4 1 (2.86%) SharePoint
Applications
1 8 (22.86%) Microsoft Excel
1 8 (22.86%) Microsoft PowerPoint
2 2 (5.71%) Oracle Smart View
2 2 (5.71%) Spreadsheet
3 1 (2.86%) Camtasia
3 1 (2.86%) Trello
Business Applications
1 2 (5.71%) Dynamics AX
1 2 (5.71%) Dynamics CRM
1 2 (5.71%) Oracle Assets
1 2 (5.71%) Oracle Cash Management
1 2 (5.71%) Oracle ERP
1 2 (5.71%) Oracle Financials
1 2 (5.71%) Oracle General Ledger
1 2 (5.71%) Oracle Payables
1 2 (5.71%) Oracle Receivables
1 2 (5.71%) ResourceLink
2 1 (2.86%) Elite 3E
2 1 (2.86%) Odoo
2 1 (2.86%) SAP S/4HANA
Cloud Services
1 9 (25.71%) Google Analytics
2 6 (17.14%) Azure
3 5 (14.29%) Dynamics 365
4 4 (11.43%) Power Platform
5 3 (8.57%) OCI
6 2 (5.71%) AWS
6 2 (5.71%) Google Ads
6 2 (5.71%) PaaS
6 2 (5.71%) SaaS
7 1 (2.86%) Azure DevOps
7 1 (2.86%) Azure Event Grid
7 1 (2.86%) Azure Functions
7 1 (2.86%) Azure Logic Apps
7 1 (2.86%) Azure Sentinel
7 1 (2.86%) Azure Service Bus
7 1 (2.86%) Microsoft 365
7 1 (2.86%) OneDrive
7 1 (2.86%) PowerApps
7 1 (2.86%) Serverless
7 1 (2.86%) WhatsApp
Communications & Networking
1 1 (2.86%) Firewall
Database & Business Intelligence
1 3 (8.57%) Power BI
1 3 (8.57%) Tableau
2 1 (2.86%) Big Data
2 1 (2.86%) Relational Database
2 1 (2.86%) Snowflake Schema
2 1 (2.86%) Star Schema
Development Applications
1 1 (2.86%) JIRA
General
1 18 (51.43%) Social Skills
2 13 (37.14%) Analytical Skills
3 9 (25.71%) Marketing
3 9 (25.71%) Presentation Skills
4 8 (22.86%) Advertising
5 7 (20.00%) Finance
5 7 (20.00%) Publishing
6 5 (14.29%) Retail
7 2 (5.71%) General Ledger
7 2 (5.71%) Law
7 2 (5.71%) Local Government
7 2 (5.71%) Manufacturing
7 2 (5.71%) Public Sector
8 1 (2.86%) Billing
8 1 (2.86%) Documentation Skills
8 1 (2.86%) Electronics
8 1 (2.86%) Inclusion and Diversity
8 1 (2.86%) Influencing Skills
8 1 (2.86%) Legal
8 1 (2.86%) Organisational Skills
Job Titles
1 8 (22.86%) Analyst
2 7 (20.00%) Digital Executive
2 7 (20.00%) SEO Executive
3 5 (14.29%) Business Analyst
4 4 (11.43%) Consultant
4 4 (11.43%) Cybersecurity Practitioner
5 3 (8.57%) Functional Consultant
5 3 (8.57%) Lead
6 2 (5.71%) Architect
6 2 (5.71%) Business Manager
6 2 (5.71%) Dynamics 365 Consultant
6 2 (5.71%) MI Manager
6 2 (5.71%) Security Analyst
6 2 (5.71%) Systems Manager
7 1 (2.86%) Agile Business Analyst
7 1 (2.86%) Compliance Analyst
7 1 (2.86%) ERP Architect
7 1 (2.86%) Microsoft CRM Consultant
7 1 (2.86%) Mortgage Business Analyst
7 1 (2.86%) Security Compliance Analyst
Libraries, Frameworks & Software Standards
1 3 (8.57%) Oracle Fusion
1 3 (8.57%) REST
2 2 (5.71%) CSS
2 2 (5.71%) HTML
2 2 (5.71%) SOAP
Miscellaneous
1 7 (20.00%) Analytical Mindset
1 7 (20.00%) Blog
2 6 (17.14%) Management Information System
3 2 (5.71%) Algorithms
3 2 (5.71%) Legacy Systems
3 2 (5.71%) Self-Motivation
3 2 (5.71%) Social Media
4 1 (2.86%) e-Learning
4 1 (2.86%) Greenfield Project
4 1 (2.86%) iPhone
4 1 (2.86%) Learning Management System
4 1 (2.86%) Legacy Applications
4 1 (2.86%) Onboarding
4 1 (2.86%) Product Ownership
4 1 (2.86%) Security Posture
4 1 (2.86%) SWIFT Messaging Network
Operating Systems
1 1 (2.86%) Windows
1 1 (2.86%) Windows 10
Processes & Methodologies
1 11 (31.43%) Analytics
2 10 (28.57%) Requirements Gathering
3 9 (25.71%) Actionable Insight
3 9 (25.71%) Link Building
3 9 (25.71%) Pay per click
3 9 (25.71%) SEO
4 7 (20.00%) Business Development
4 7 (20.00%) Content Writing
4 7 (20.00%) ERP
4 7 (20.00%) Social Commerce
5 6 (17.14%) Information Security
5 6 (17.14%) Problem-Solving
6 5 (14.29%) Data Modelling
6 5 (14.29%) User Acceptance Testing
7 4 (11.43%) Agile
7 4 (11.43%) Business Analysis
7 4 (11.43%) Data Migration
7 4 (11.43%) Migration
7 4 (11.43%) Project Management
7 4 (11.43%) Workflow
Programming Languages
1 2 (5.71%) SQL
Qualifications
1 7 (20.00%) Security Cleared
2 6 (17.14%) SC Cleared
3 4 (11.43%) CISM
4 3 (8.57%) Degree
4 3 (8.57%) Microsoft Certification
5 2 (5.71%) CTC Cleared
5 2 (5.71%) IIBA
5 2 (5.71%) MCP
6 1 (2.86%) CBAP
6 1 (2.86%) CCSK
6 1 (2.86%) CISSP
6 1 (2.86%) Computer Science Degree
6 1 (2.86%) MCT
Quality Assurance & Compliance
1 6 (17.14%) ISO/IEC 27001
2 5 (14.29%) NIST
3 4 (11.43%) Cyber Essentials
3 4 (11.43%) Cyber Essentials PLUS
3 4 (11.43%) Def Stans
4 1 (2.86%) Actionable Recommendations
4 1 (2.86%) Data Quality
4 1 (2.86%) ISO 22301
4 1 (2.86%) ISO 9001
4 1 (2.86%) PCI DSS
Systems Management
1 1 (2.86%) Nessus
Vendors
1 15 (42.86%) Microsoft
2 9 (25.71%) Ahrefs
2 9 (25.71%) Google
3 7 (20.00%) Salesforce
3 7 (20.00%) Screaming Frog
3 7 (20.00%) Sitecore
4 3 (8.57%) Oracle
5 2 (5.71%) Cognos
5 2 (5.71%) SAP
6 1 (2.86%) iManage
6 1 (2.86%) Tenable