Puppet Jobs with Work from Home Options

Puppet
UK > Work from Home

The table below provides summary statistics for permanent job vacancies with an option to work from home (WFH) and a requirement for Puppet skills. Included is a benchmarking guide to the salaries offered in vacancies that have cited Puppet over the 6 months to 19 April 2024 with a comparison to the same period in the previous 2 years.

6 months to
19 Apr 2024
Same period 2023 Same period 2022
Rank 428 359 300
Rank change year-on-year -69 -59 -143
Permanent jobs citing Puppet 157 365 820
As % of all permanent jobs with a WFH option 0.47% 0.83% 1.24%
As % of the Systems Management category 3.94% 5.14% 6.36%
Number of salaries quoted 142 260 547
10th Percentile £48,750 £47,250 £43,500
25th Percentile £56,563 £58,750 £50,000
Median annual salary (50th Percentile) £72,500 £75,000 £75,000
Median % change year-on-year -3.33% - +21.95%
75th Percentile £84,688 £90,000 £90,000
90th Percentile £102,500 £101,250 £100,000
UK median annual salary £70,576 £73,750 £72,500
% change year-on-year -4.30% +1.72% +16.00%

All Systems Management Skills
Work from Home

Puppet is in the Systems Management category. The following table is for comparison with the above and provides summary statistics for all permanent job vacancies with a WFH option and a requirement for systems management skills.

Permanent vacancies with a requirement for systems management skills 3,985 7,098 12,897
As % of all permanent jobs with a WFH option 11.81% 16.15% 19.50%
Number of salaries quoted 3,041 4,966 7,736
10th Percentile £37,101 £40,000 £42,500
25th Percentile £47,500 £52,500 £52,500
Median annual salary (50th Percentile) £64,000 £69,447 £70,000
Median % change year-on-year -7.84% -0.79% +7.69%
75th Percentile £83,750 £88,750 £86,250
90th Percentile £102,500 £105,000 £100,000
UK median annual salary £60,000 £67,500 £70,000
% change year-on-year -11.11% -3.57% +12.00%

Puppet
Trend for Jobs with a WFH Option

Job vacancies with a work from home option citing Puppet as a proportion of all IT jobs advertised.
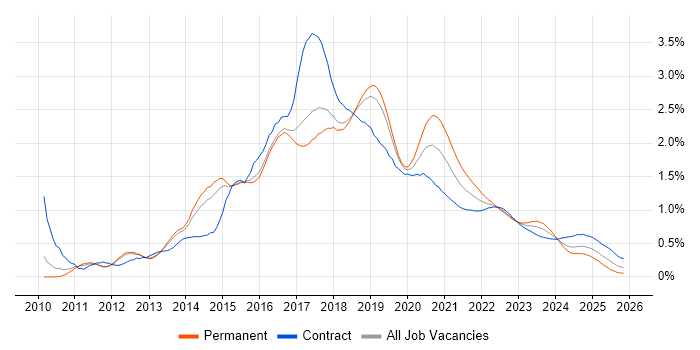
Puppet trend for jobs with a WFH option

Puppet
Salary Trend for Jobs with a WFH Option

3-month moving average salary quoted in job vacancies with a work from home option citing Puppet.

Puppet salary trend for jobs with a WFH option

Puppet
Salary Histogram for Jobs with a WFH Option

Salary distribution for jobs with a work from home option citing Puppet over the 6 months to 19 April 2024.

Puppet salary histogram for jobs with a WFH option

Puppet
Co-occurring Skills and Capabilities with WFH Options by Category

The follow tables expand on the table above by listing co-occurrences grouped by category. The same employment type, locality and period is covered with up to 20 co-occurrences shown in each of the following categories:

Application Platforms
1 10 (6.37%) OpenStack
2 6 (3.82%) Microsoft Exchange
3 5 (3.18%) Confluence
4 3 (1.91%) CloudStack
5 2 (1.27%) nginx
6 1 (0.64%) Apache
6 1 (0.64%) Tomcat
Cloud Services
1 90 (57.32%) AWS
2 65 (41.40%) Azure
3 32 (20.38%) GCP
4 31 (19.75%) GitHub
5 20 (12.74%) Amazon S3
6 16 (10.19%) Azure DevOps
7 13 (8.28%) AWS CloudFormation
8 12 (7.64%) Serverless
9 11 (7.01%) AWS Lambda
10 10 (6.37%) Datadog
11 9 (5.73%) GitHub Actions
11 9 (5.73%) OpenShift
11 9 (5.73%) Pulumi
12 7 (4.46%) Amazon EC2
12 7 (4.46%) Azure AKS
12 7 (4.46%) Azure Cosmos DB
12 7 (4.46%) Azure Monitor
13 6 (3.82%) Rubrik
13 6 (3.82%) SaaS
14 5 (3.18%) Cloud Computing
Communications & Networking
1 22 (14.01%) DNS
2 15 (9.55%) Firewall
2 15 (9.55%) TCP/IP
3 13 (8.28%) VSAN
4 11 (7.01%) Internet
5 10 (6.37%) SNMP
5 10 (6.37%) tcpdump
6 6 (3.82%) DHCP
6 6 (3.82%) SAN
7 4 (2.55%) OSPF
7 4 (2.55%) VPN
8 3 (1.91%) iSCSI
9 2 (1.27%) BGP
9 2 (1.27%) HTTP
9 2 (1.27%) IPsec
9 2 (1.27%) IPv4
9 2 (1.27%) LAN
9 2 (1.27%) VLAN
9 2 (1.27%) WAN
9 2 (1.27%) WLAN
Database & Business Intelligence
1 23 (14.65%) MySQL
2 18 (11.46%) MongoDB
3 13 (8.28%) Elasticsearch
4 9 (5.73%) Redis
5 8 (5.10%) PostgreSQL
6 7 (4.46%) Azure SQL Database
6 7 (4.46%) MariaDB
7 5 (3.18%) Amazon RDS
8 2 (1.27%) Big Data
8 2 (1.27%) NoSQL
9 1 (0.64%) Hadoop
9 1 (0.64%) InfluxDB
9 1 (0.64%) Oracle Database
9 1 (0.64%) Power BI
9 1 (0.64%) Relational Database
9 1 (0.64%) SQL Server
Development Applications
1 56 (35.67%) Git
2 46 (29.30%) Jenkins
3 26 (16.56%) GitLab
4 9 (5.73%) Bitbucket
4 9 (5.73%) Team Foundation Server
5 8 (5.10%) JIRA
5 8 (5.10%) SonarQube
6 7 (4.46%) Selenium
7 6 (3.82%) Maven
7 6 (3.82%) Subversion
8 5 (3.18%) Atlassian Bamboo
8 5 (3.18%) Sonatype Nexus
9 3 (1.91%) Cucumber
9 3 (1.91%) IBM UrbanCode
10 2 (1.27%) CA Release Automation
10 2 (1.27%) Mocha
10 2 (1.27%) Zephyr
11 1 (0.64%) CircleCI
11 1 (0.64%) Gradle
11 1 (0.64%) TeamCity
General
1 27 (17.20%) Finance
2 25 (15.92%) Social Skills
3 24 (15.29%) Banking
4 17 (10.83%) Analytical Skills
4 17 (10.83%) Investment Banking
5 13 (8.28%) Telecoms
6 11 (7.01%) Retail
7 6 (3.82%) Inclusion and Diversity
7 6 (3.82%) Marketing
7 6 (3.82%) Public Sector
7 6 (3.82%) Tech for Good
8 5 (3.18%) Organisational Skills
9 4 (2.55%) Aerospace
9 4 (2.55%) Manufacturing
10 3 (1.91%) Advertising
11 2 (1.27%) Law
12 1 (0.64%) Automotive
12 1 (0.64%) Legal
12 1 (0.64%) Presentation Skills
Job Titles
1 51 (32.48%) DevOps Engineer
2 36 (22.93%) Senior
3 33 (21.02%) Lead
4 31 (19.75%) Linux Engineer
5 30 (19.11%) Infrastructure Engineer
6 29 (18.47%) Senior DevOps
6 29 (18.47%) Senior DevOps Engineer
7 26 (16.56%) Cloud Engineer
8 25 (15.92%) Azure Engineer
8 25 (15.92%) Platform Engineer
9 23 (14.65%) Cloud Platform Engineer
10 18 (11.46%) AWS Engineer
11 17 (10.83%) Operations Engineer
12 16 (10.19%) Windows Engineer
12 16 (10.19%) Windows Infrastructure Engineer
13 15 (9.55%) Automation Engineer
13 15 (9.55%) Cloud Automation Engineer
14 14 (8.92%) Systems Engineer
15 12 (7.64%) Linux/Unix DevOps
15 12 (7.64%) Senior Linux Engineer
Libraries, Frameworks & Software Standards
1 13 (8.28%) YAML
2 11 (7.01%) Elastic Stack
3 8 (5.10%) ARM Templates
4 6 (3.82%) ADO
4 6 (3.82%) JSON
5 5 (3.18%) RESTful
6 4 (2.55%) Django
6 4 (2.55%) Node.js
6 4 (2.55%) SAML
6 4 (2.55%) XML
7 3 (1.91%) .NET
8 2 (1.27%) AWS CDK
8 2 (1.27%) REST
9 1 (0.64%) Flash
9 1 (0.64%) Kafka
9 1 (0.64%) Keycloak
9 1 (0.64%) LEMP Stack
9 1 (0.64%) Middleware
9 1 (0.64%) React
9 1 (0.64%) Web Services
Miscellaneous
1 31 (19.75%) Linux Command Line
2 13 (8.28%) Hybrid Cloud
3 12 (7.64%) Data Centre
4 11 (7.01%) Clustering
5 8 (5.10%) Product Ownership
5 8 (5.10%) Self-Motivation
6 7 (4.46%) Public Cloud
6 7 (4.46%) Virtual Team
7 6 (3.82%) Distributed Systems
8 5 (3.18%) Private Cloud
9 4 (2.55%) Enterprise Software
10 3 (1.91%) Cloud Native
11 2 (1.27%) Client/Server
11 2 (1.27%) Greenfield Project
11 2 (1.27%) Life Science
11 2 (1.27%) Management Information System
12 1 (0.64%) Distributed Denial-of-Service
Operating Systems
1 95 (60.51%) Linux
2 60 (38.22%) Windows
3 38 (24.20%) Red Hat Enterprise Linux
4 23 (14.65%) Windows Server
5 12 (7.64%) Unix
6 9 (5.73%) CentOS
7 7 (4.46%) CoreOS
8 3 (1.91%) SUSE
8 3 (1.91%) SUSE Linux Enterprise Server
8 3 (1.91%) VMS
9 2 (1.27%) Ubuntu
Processes & Methodologies
1 117 (74.52%) DevOps
2 85 (54.14%) CI/CD
3 60 (38.22%) Configuration Management
4 58 (36.94%) Agile
5 57 (36.31%) Infrastructure as Code
6 34 (21.66%) Problem-Solving
7 27 (17.20%) Test Automation
8 26 (16.56%) Infrastructure Engineering
8 26 (16.56%) Platform Engineering
9 24 (15.29%) Continuous Improvement
9 24 (15.29%) Cybersecurity
10 23 (14.65%) Containerisation
11 17 (10.83%) ITIL
11 17 (10.83%) Time Management
12 16 (10.19%) Asset Management
12 16 (10.19%) Migration
13 15 (9.55%) Computer Science
14 13 (8.28%) Deployment Automation
14 13 (8.28%) Mentoring
15 12 (7.64%) Site Reliability Engineering
Programming Languages
1 111 (70.70%) Python
2 83 (52.87%) Bash
3 57 (36.31%) PowerShell
4 45 (28.66%) Perl
5 39 (24.84%) Java
5 39 (24.84%) Ruby
6 23 (14.65%) Go
7 16 (10.19%) Korn
7 16 (10.19%) SQL
8 14 (8.92%) JavaScript
9 12 (7.64%) C#
10 9 (5.73%) PHP
10 9 (5.73%) TypeScript
11 8 (5.10%) Groovy
12 4 (2.55%) C++
12 4 (2.55%) Lua
12 4 (2.55%) Tcl
13 2 (1.27%) Kotlin
13 2 (1.27%) SOQL
14 1 (0.64%) AWK
Qualifications
1 26 (16.56%) Security Cleared
2 17 (10.83%) Degree
3 15 (9.55%) Computer Science Degree
4 10 (6.37%) ITIL Foundation Certificate
5 7 (4.46%) Azure Certification
6 6 (3.82%) SC Cleared
7 4 (2.55%) AWS Certification
7 4 (2.55%) AWS Certified DevOps Engineer
7 4 (2.55%) DV Cleared
8 2 (1.27%) CCNP
8 2 (1.27%) Cisco Certification
8 2 (1.27%) JNCIP
9 1 (0.64%) AWS Certified Solutions Architect
9 1 (0.64%) OCP
9 1 (0.64%) Oracle Certification
Quality Assurance & Compliance
1 5 (3.18%) QA
2 2 (1.27%) Data Quality
3 1 (0.64%) Cyber Essentials
3 1 (0.64%) Cyber Essentials PLUS
3 1 (0.64%) ISO/IEC 27001
3 1 (0.64%) NCSC
System Software
1 86 (54.78%) Docker
2 24 (15.29%) VMware Infrastructure
3 18 (11.46%) Active Directory
4 14 (8.92%) VMware ESXi
5 13 (8.28%) vSphere
6 6 (3.82%) DFS Replication
6 6 (3.82%) KVM
7 5 (3.18%) Virtual Machines
8 3 (1.91%) Ceph
8 3 (1.91%) Gluster
8 3 (1.91%) oVirt
9 1 (0.64%) Hyper-V
9 1 (0.64%) XenApp
9 1 (0.64%) XenDesktop
Systems Management
1 127 (80.89%) Ansible
2 82 (52.23%) Terraform
3 78 (49.68%) Kubernetes
4 59 (37.58%) Progress Chef
5 23 (14.65%) vCenter Server
6 22 (14.01%) Grafana
7 17 (10.83%) Salt
8 16 (10.19%) Prometheus
8 16 (10.19%) Red Hat Satellite
9 14 (8.92%) ZABBIX
10 13 (8.28%) Nagios
11 12 (7.64%) HAProxy
12 10 (6.37%) Graphite
13 6 (3.82%) Active Directory Federation Services
13 6 (3.82%) NetBackup
13 6 (3.82%) vRealize Orchestrator
14 5 (3.18%) Argo
14 5 (3.18%) Packer
15 4 (2.55%) Consul
15 4 (2.55%) vRealize
Vendors
1 28 (17.83%) VMware
2 27 (17.20%) Microsoft
3 25 (15.92%) Red Hat
4 17 (10.83%) TOWER Software
5 16 (10.19%) Sun
6 14 (8.92%) SaltStack
7 10 (6.37%) New Relic
8 8 (5.10%) Citrix
9 6 (3.82%) Veeam
10 5 (3.18%) Google
11 4 (2.55%) Atlassian
11 4 (2.55%) Cisco
11 4 (2.55%) Oracle
11 4 (2.55%) ServiceNow
11 4 (2.55%) Splunk
12 3 (1.91%) Dynatrace
13 2 (1.27%) Salesforce
13 2 (1.27%) Veracode
14 1 (0.64%) Adobe
14 1 (0.64%) Wallstreet Suite