Security Information and Event Management (SIEM)
UK

The following table provides summary statistics for permanent job vacancies with a requirement for SIEM skills. Included is a benchmarking guide to the salaries offered in vacancies that have cited SIEM over the 6 months to 4 December 2023 with a comparison to the same period in the previous 2 years.

6 months to
4 Dec 2023
Same period 2022 Same period 2021
Rank 180 315 362
Rank change year-on-year +135 +47 -57
Permanent jobs citing SIEM 1,051 1,383 1,276
As % of all permanent jobs advertised in the UK 1.97% 1.12% 0.99%
As % of the Processes & Methodologies category 2.10% 1.17% 1.04%
Number of salaries quoted 617 899 897
10th Percentile £38,834 £41,800 £41,000
25th Percentile £51,250 £51,250 £49,250
Median annual salary (50th Percentile) £65,000 £65,000 £65,000
Median % change year-on-year - - +8.33%
75th Percentile £80,000 £81,250 £78,750
90th Percentile £97,500 £96,250 £91,550
UK excluding London median annual salary £58,750 £60,000 £60,000
% change year-on-year -2.08% - +20.00%

All Process and Methodology Skills
UK

SIEM is in the Processes and Methodologies category. The following table is for comparison with the above and provides summary statistics for all permanent job vacancies with a requirement for process or methodology skills.

Permanent vacancies with a requirement for process or methodology skills 50,088 118,671 122,416
As % of all permanent jobs advertised in the UK 94.09% 95.74% 95.45%
Number of salaries quoted 36,209 72,079 81,851
10th Percentile £32,500 £34,492 £32,500
25th Percentile £43,750 £45,000 £42,500
Median annual salary (50th Percentile) £60,000 £60,000 £60,000
Median % change year-on-year - - +9.09%
75th Percentile £80,000 £82,000 £77,500
90th Percentile £99,025 £100,000 £95,000
UK excluding London median annual salary £52,500 £53,219 £50,000
% change year-on-year -1.35% +6.44% +4.17%

SIEM
Job Vacancy Trend

Job postings citing SIEM as a proportion of all IT jobs advertised.
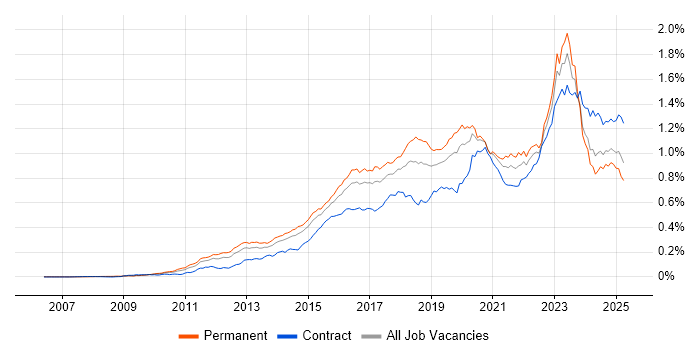
Job vacancy trend for SIEM in the UK

SIEM
Salary Trend

3-month moving average salary quoted in jobs citing SIEM.

Salary trend for SIEM in the UK

SIEM
Salary Histogram

Salary distribution for jobs citing SIEM over the 6 months to 4 December 2023.

Salary histogram for SIEM in the UK

SIEM
Top 18 Job Locations

The table below looks at the demand and provides a guide to the median salaries quoted in IT jobs citing SIEM within the UK over the 6 months to 4 December 2023. The 'Rank Change' column provides an indication of the change in demand within each location based on the same 6 month period last year.

Location Rank Change
on Same Period
Last Year
Matching
Permanent
IT Job Ads
Median Salary
Past 6 Months
Median Salary
% Change
on Same Period
Last Year
Live
Jobs
England +146 859 £65,000 - 242
UK excluding London +177 704 £58,750 -2.08% 149
Work from Home +104 351 £63,000 -3.08% 114
London +115 309 £75,000 +11.11% 102
South East +143 160 £58,750 -6.00% 37
North of England +116 153 £55,000 -4.35% 28
Midlands +121 100 £53,500 -14.40% 32
North West +44 74 £55,000 -4.35% 11
Yorkshire +131 73 £55,000 -8.33% 11
Wales +73 69 £46,500 -19.13% 3
Scotland +23 69 £50,000 -28.57% 13
South West +100 68 £65,000 +6.12% 21
East of England +148 63 £65,000 +18.18% 14
West Midlands +110 63 £53,500 -14.40% 27
East Midlands +65 36 £50,000 +4.17% 5
Northern Ireland +53 22 £37,500 -46.43% 1
North East +51 6 £55,646 -14.39% 6
Isle of Man - 2 £72,500 -

SIEM
Co-occurring Skills and Capabilities by Category

The follow tables expand on the table above by listing co-occurrences grouped by category. The same employment type, locality and period is covered with up to 20 co-occurrences shown in each of the following categories:

Application Platforms
1 21 (2.00%) SharePoint
2 18 (1.71%) Confluence
3 10 (0.95%) IIS
4 6 (0.57%) CMS
5 5 (0.48%) MS Exchange
6 3 (0.29%) Apache
7 2 (0.19%) MS Project Server
8 1 (0.095%) Moodle
Applications
1 7 (0.67%) Microsoft Office
2 3 (0.29%) Microsoft Excel
2 3 (0.29%) Microsoft PowerPoint
2 3 (0.29%) Microsoft Project
2 3 (0.29%) MS Visio
Cloud Services
1 204 (19.41%) Azure
2 156 (14.84%) AWS
3 103 (9.80%) Microsoft 365
4 62 (5.90%) Azure Sentinel
5 44 (4.19%) Entra ID
5 44 (4.19%) PaaS
6 42 (4.00%) SaaS
7 32 (3.04%) IaaS
8 25 (2.38%) Azure ExpressRoute
8 25 (2.38%) Cloud Computing
9 15 (1.43%) GitHub
10 14 (1.33%) AWS Direct Connect
11 13 (1.24%) Serverless
12 11 (1.05%) GCP
13 9 (0.86%) Azure Cosmos DB
14 8 (0.76%) Amazon GuardDuty
14 8 (0.76%) Azure Service Bus
15 7 (0.67%) Azure Monitor
15 7 (0.67%) Microsoft Purview
15 7 (0.67%) WhatsApp
Communications & Networking
1 373 (35.49%) Firewall
2 210 (19.98%) Network Security
3 184 (17.51%) WAN
4 171 (16.27%) LAN
5 170 (16.18%) Intrusion Detection
6 106 (10.09%) TCP/IP
7 97 (9.23%) VPN
8 64 (6.09%) Internet
9 53 (5.04%) DNS
9 53 (5.04%) Wireless
10 50 (4.76%) HTTP
11 37 (3.52%) SMTP
12 36 (3.43%) DHCP
12 36 (3.43%) Wi-Fi
13 35 (3.33%) FTP
14 32 (3.04%) Sourcefire
15 31 (2.95%) SD-WAN
16 23 (2.19%) NGFW
17 20 (1.90%) Cisco Nexus
18 16 (1.52%) Cisco ISE
Database & Business Intelligence
1 30 (2.85%) SQL Server
2 12 (1.14%) MySQL
3 8 (0.76%) Azure SQL Database
4 7 (0.67%) Amazon RDS
5 6 (0.57%) Big Data
5 6 (0.57%) Redis
6 3 (0.29%) SQL Server Integration Services
7 2 (0.19%) Amazon Redshift
7 2 (0.19%) Elasticsearch
8 1 (0.095%) PostgreSQL
8 1 (0.095%) SQL Server Reporting Services
Development Applications
1 26 (2.47%) Jenkins
2 22 (2.09%) JIRA
3 10 (0.95%) CircleCI
4 3 (0.29%) Sonatype Nexus
5 2 (0.19%) GitLab
6 1 (0.095%) Postman
General
1 429 (40.82%) Social Skills
2 352 (33.49%) Finance
3 318 (30.26%) Games
4 227 (21.60%) Banking
5 88 (8.37%) Analytical Skills
6 63 (5.99%) Public Sector
7 35 (3.33%) Law
8 21 (2.00%) Retail
9 19 (1.81%) Telecoms
10 17 (1.62%) Legal
11 15 (1.43%) Inclusion and Diversity
12 9 (0.86%) Marketing
13 8 (0.76%) Aerospace
13 8 (0.76%) Manufacturing
13 8 (0.76%) Presentation Skills
14 6 (0.57%) Automotive
14 6 (0.57%) Organisational Skills
14 6 (0.57%) Police
15 5 (0.48%) Advertising
16 4 (0.38%) Local Government
Job Titles
1 285 (27.12%) Analyst
2 263 (25.02%) Architect
3 239 (22.74%) Security Architect
4 195 (18.55%) Senior
5 172 (16.37%) Security Analyst
6 142 (13.51%) Security Engineer
7 115 (10.94%) Security Manager
8 105 (9.99%) SOC Analyst
9 96 (9.13%) Lead
10 64 (6.09%) Cybersecurity Analyst
11 63 (5.99%) Senior Manager
12 60 (5.71%) Business Manager
12 60 (5.71%) Senior Business Manager
13 56 (5.33%) Senior Analyst
14 52 (4.95%) Cybersecurity Engineer
15 46 (4.38%) Security Specialist
16 43 (4.09%) IT Engineer
16 43 (4.09%) Senior Security Analyst
17 41 (3.90%) Senior Security Engineer
18 38 (3.62%) IT Security Engineer
Libraries, Frameworks & Software Standards
1 45 (4.28%) LDAP
2 20 (1.90%) 802.1X
3 12 (1.14%) RESTful
4 9 (0.86%) JSON
5 8 (0.76%) Regular Expression
6 7 (0.67%) Fluent Bit
6 7 (0.67%) React
7 6 (0.57%) Next.js
7 6 (0.57%) Node.js
8 5 (0.48%) SailPoint
8 5 (0.48%) YAML
9 3 (0.29%) .NET
9 3 (0.29%) .NET Framework
9 3 (0.29%) Elastic Stack
9 3 (0.29%) REST
10 2 (0.19%) ARM Templates
10 2 (0.19%) CSS
10 2 (0.19%) Microsoft Graph
10 2 (0.19%) SAML
10 2 (0.19%) web3js
Miscellaneous
1 180 (17.13%) Security Operations Centre
2 106 (10.09%) Management Information System
3 93 (8.85%) PKI
4 91 (8.66%) Cyber Threat
5 53 (5.04%) Security Posture
6 51 (4.85%) Cyberattack
7 43 (4.09%) Analytical Mindset
8 38 (3.62%) Data Centre
9 31 (2.95%) Distributed Denial-of-Service
10 22 (2.09%) Cyber Kill Chain
11 21 (2.00%) Onboarding
12 17 (1.62%) Operational Technology
13 16 (1.52%) Public Cloud
14 14 (1.33%) Self-Motivation
15 12 (1.14%) Insider Threat
16 11 (1.05%) Cloud Native
16 11 (1.05%) Cyber Defence
17 10 (0.95%) Cybercrime
18 8 (0.76%) Hybrid Cloud
19 7 (0.67%) Private Cloud
Operating Systems
1 248 (23.60%) Windows
2 109 (10.37%) Linux
3 106 (10.09%) Unix
4 73 (6.95%) Windows Server
5 18 (1.71%) Windows Server 2016
6 16 (1.52%) Windows Server 2019
7 13 (1.24%) Windows 10
8 12 (1.14%) Mac OS
9 10 (0.95%) Ubuntu
10 7 (0.67%) Windows Server 2012
11 5 (0.48%) Windows Server 2003
12 4 (0.38%) Red Hat Enterprise Linux
13 3 (0.29%) Android
13 3 (0.29%) Apple iOS
13 3 (0.29%) Debian
13 3 (0.29%) VMS
14 2 (0.19%) Mac OS X
15 1 (0.095%) Windows Server 2008
Processes & Methodologies
1 788 (74.98%) Cybersecurity
2 430 (40.91%) Vulnerability Management
3 322 (30.64%) Security Operations
4 263 (25.02%) Actionable Insight
5 257 (24.45%) Identity Access Management
6 242 (23.03%) Information Security
7 222 (21.12%) Containerisation
8 217 (20.65%) RBAC
9 209 (19.89%) Network Segmentation
10 208 (19.79%) Asset Management
11 206 (19.60%) IT Asset Management
12 185 (17.60%) Vulnerability Scanning
13 179 (17.03%) Incident Response
14 171 (16.27%) Data Loss Prevention
15 135 (12.84%) Cloud Security
16 109 (10.37%) Security Management
17 107 (10.18%) Incident Management
18 106 (10.09%) Threat Intelligence
19 104 (9.90%) Problem-Solving
20 96 (9.13%) Cyber Threat Intelligence
Programming Languages
1 92 (8.75%) Python
2 69 (6.57%) PowerShell
3 29 (2.76%) Bash
4 25 (2.38%) SQL
5 23 (2.19%) Kusto Query Language
6 9 (0.86%) C#
6 9 (0.86%) JavaScript
7 8 (0.76%) Java
8 7 (0.67%) Shell Script
9 5 (0.48%) Perl
10 4 (0.38%) Go
11 3 (0.29%) VBScript
12 2 (0.19%) C
13 1 (0.095%) Bicep
13 1 (0.095%) Kotlin
13 1 (0.095%) PHP
13 1 (0.095%) R
13 1 (0.095%) Search Processing Language
13 1 (0.095%) TypeScript
Qualifications
1 380 (36.16%) Security Cleared
2 218 (20.74%) CISSP
3 131 (12.46%) Degree
4 115 (10.94%) CISM
5 89 (8.47%) SC Cleared
6 78 (7.42%) Cisco Certification
7 67 (6.37%) SSCP
8 43 (4.09%) CEH
9 40 (3.81%) (ISC)2 CCSP
9 40 (3.81%) Master's Degree
10 39 (3.71%) CompTIA Security+
11 38 (3.62%) CCSP
12 35 (3.33%) DV Cleared
13 30 (2.85%) CCNA
14 26 (2.47%) GCIH
15 23 (2.19%) GCIA
15 23 (2.19%) GIAC
16 22 (2.09%) GSEC
17 21 (2.00%) CISA
17 21 (2.00%) Network+ Certification
Quality Assurance & Compliance
1 251 (23.88%) ISO/IEC 27001
2 109 (10.37%) NIST
3 107 (10.18%) GDPR
4 54 (5.14%) Cyber Essentials
5 48 (4.57%) PCI DSS
6 31 (2.95%) HMG Security Policy Framework
7 21 (2.00%) SOC 2
8 18 (1.71%) Cyber Essentials PLUS
9 14 (1.33%) NCSC
10 10 (0.95%) GRC
11 9 (0.86%) COBIT
12 7 (0.67%) ISO/IEC 27002 (supersedes ISO/IEC 17799)
13 6 (0.57%) ISO 9000
14 5 (0.48%) QA
14 5 (0.48%) SLA
15 4 (0.38%) ISO/IEC 27005
15 4 (0.38%) RMADS
16 3 (0.29%) ISO/IEC 17025
16 3 (0.29%) NIST 800
16 3 (0.29%) PSD2
System Software
1 211 (20.08%) Virtual Machines
2 114 (10.85%) Active Directory
3 44 (4.19%) VMware Infrastructure
4 23 (2.19%) Docker
5 13 (1.24%) Virtual Desktop
6 6 (0.57%) VMware ESXi
7 5 (0.48%) Hyper-V
8 4 (0.38%) vSphere
9 3 (0.29%) Squid
10 2 (0.19%) VMware Server
11 1 (0.095%) BitLocker
11 1 (0.095%) Snort
11 1 (0.095%) XenApp
Systems Management
1 41 (3.90%) Ansible
2 37 (3.52%) FortiGate
3 34 (3.24%) Kubernetes
4 23 (2.19%) Terraform
5 22 (2.09%) Nessus
6 21 (2.00%) CSIRT
7 20 (1.90%) Microsoft Intune
8 19 (1.81%) CASB
9 10 (0.95%) SCCM
10 9 (0.86%) Puppet
10 9 (0.86%) QRadar
10 9 (0.86%) Single Sign-On
11 7 (0.67%) Fluentd
11 7 (0.67%) logstash
12 5 (0.48%) Backup Exec
12 5 (0.48%) Jamf Pro
13 4 (0.38%) Active Directory Federation Services
13 4 (0.38%) Progress Chef
14 3 (0.29%) Computer Emergency Response Teams
14 3 (0.29%) EnCase
Vendors
1 187 (17.79%) Microsoft
2 117 (11.13%) Cisco
3 116 (11.04%) Splunk
4 73 (6.95%) VMware
5 59 (5.61%) ArcSight
6 51 (4.85%) CheckPoint
7 47 (4.47%) F5
7 47 (4.47%) Palo Alto
8 36 (3.43%) Juniper
9 34 (3.24%) Trend Micro
10 32 (3.04%) IBM
10 32 (3.04%) TippingPoint
11 31 (2.95%) Citrix
12 24 (2.28%) McAfee
13 22 (2.09%) Carbon Black
14 20 (1.90%) Symantec
15 18 (1.71%) CyberArk
16 16 (1.52%) Acronis
16 16 (1.52%) SolarWinds
17 15 (1.43%) Meraki