Data Analytics Jobs in England

Data Analytics
UK > England

The table below provides summary statistics for permanent job vacancies advertised in England requiring Data Analytics skills. It includes a benchmarking guide to the annual salaries offered in vacancies that cited Data Analytics over the 6 months leading up to 28 May 2025, comparing them to the same period in the previous two years.

6 months to
28 May 2025
Same period 2024 Same period 2023
Rank 207 205 152
Rank change year-on-year -2 -53 +11
Permanent jobs citing Data Analytics 763 1,233 2,050
As % of all permanent jobs advertised in England 1.58% 1.39% 2.35%
As % of the Processes & Methodologies category 1.68% 1.66% 2.46%
Number of salaries quoted 318 818 878
10th Percentile £25,969 £33,500 £37,391
25th Percentile £36,250 £42,500 £48,750
Median annual salary (50th Percentile) £60,743 £60,000 £67,003
Median % change year-on-year +1.24% -10.45% -1.10%
75th Percentile £80,000 £77,500 £84,775
90th Percentile £97,875 £95,000 £106,250
UK median annual salary £60,000 £60,000 £65,000
% change year-on-year - -7.69% -3.70%

All Process and Methodology Skills
England

Data Analytics falls under the Processes and Methodologies category. For comparison with the information above, the following table provides summary statistics for all permanent job vacancies requiring process or methodology skills in England.

Permanent vacancies with a requirement for process or methodology skills 45,477 74,482 83,229
As % of all permanent jobs advertised in England 94.01% 84.24% 95.56%
Number of salaries quoted 22,533 54,432 49,691
10th Percentile £29,625 £29,000 £34,375
25th Percentile £41,250 £40,000 £46,105
Median annual salary (50th Percentile) £57,500 £55,000 £62,500
Median % change year-on-year +4.55% -12.00% +4.17%
75th Percentile £75,000 £72,500 £82,500
90th Percentile £98,695 £93,750 £102,500
UK median annual salary £57,500 £55,000 £61,000
% change year-on-year +4.55% -9.84% +1.67%

Data Analytics
Job Vacancy Trend in England

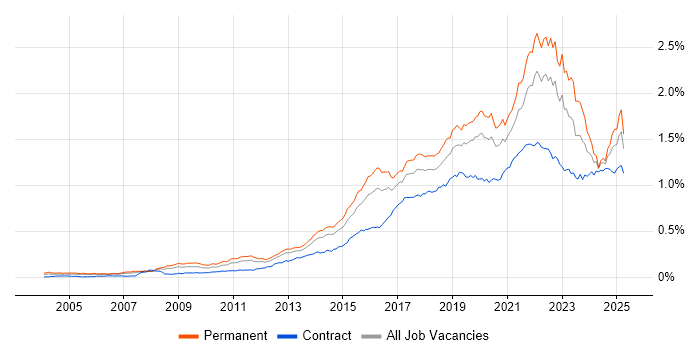
Job postings citing Data Analytics as a proportion of all IT jobs advertised in England.

Job vacancy trend for Data Analytics in England

Data Analytics
Salary Trend in England

3-month moving average salary quoted in jobs citing Data Analytics in England.

Salary trend for Data Analytics in England

Data Analytics
Salary Histogram in England

Salary distribution for jobs citing Data Analytics in England over the 6 months to 28 May 2025.

Salary histogram for Data Analytics in England

Data Analytics
Job Locations in England

The table below looks at the demand and provides a guide to the median salaries quoted in IT jobs citing Data Analytics within the England region over the 6 months to 28 May 2025. The 'Rank Change' column provides an indication of the change in demand within each location based on the same 6 month period last year.

Location Rank Change
on Same Period
Last Year
Matching
Permanent
IT Job Ads
Median Salary
Past 6 Months
Median Salary
% Change
on Same Period
Last Year
Live
Jobs
London -3 290 £80,000 +10.34% 624
North of England +43 175 £41,000 -13.68% 115
North West +10 118 £43,750 -12.50% 66
South East +25 113 £56,250 +2.27% 123
Midlands -18 106 £43,000 -18.10% 87
West Midlands +1 88 £45,000 -18.18% 51
Yorkshire +77 60 £45,000 +5.88% 37
East of England +69 55 £70,000 +40.00% 49
South West +32 48 £42,500 -32.00% 57
East Midlands +17 18 £43,000 -14.00% 32
North East +22 1 £30,500 -39.00% 12
Data Analytics
UK

Data Analytics
Co-occurring Skills and Capabilities in England by Category

The follow tables expand on the table above by listing co-occurrences grouped by category. The same employment type, locality and period is covered with up to 20 co-occurrences shown in each of the following categories:

Application Platforms
1 36 (4.72%) SharePoint
2 31 (4.06%) Apache Spark
3 9 (1.18%) Apache Airflow
4 7 (0.92%) Apache
5 6 (0.79%) WordPress
6 5 (0.66%) CMS
6 5 (0.66%) SAS
7 3 (0.39%) Adobe Experience Manager
8 2 (0.26%) ArcGIS
8 2 (0.26%) Confluence
8 2 (0.26%) Headless CMS
9 1 (0.13%) Microsoft Exchange
Applications
1 98 (12.84%) Microsoft Excel
2 8 (1.05%) Microsoft Office
2 8 (1.05%) Microsoft PowerPoint
3 5 (0.66%) Trello
4 3 (0.39%) Microsoft Project
5 2 (0.26%) MS Visio
6 1 (0.13%) Chatbot
6 1 (0.13%) SPSS
6 1 (0.13%) SPSS Modeler
Business Applications
1 24 (3.15%) Dynamics AX
2 6 (0.79%) Infor M3
3 3 (0.39%) Sprinklr
4 2 (0.26%) iTrent
5 1 (0.13%) Actimize
5 1 (0.13%) Dynamics CRM
5 1 (0.13%) Oracle EBS R12
5 1 (0.13%) Oracle Procure-to-Pay
5 1 (0.13%) Payment Gateway
5 1 (0.13%) Salesforce CRM
Cloud Services
1 239 (31.32%) Power Platform
2 153 (20.05%) Azure
3 127 (16.64%) AWS
4 53 (6.95%) GCP
5 43 (5.64%) SaaS
6 42 (5.50%) Serverless
7 35 (4.59%) PowerApps
8 32 (4.19%) AWS Lambda
9 29 (3.80%) Amazon CloudWatch
10 28 (3.67%) Power Automate
11 22 (2.88%) Google Analytics
12 21 (2.75%) Amazon S3
13 19 (2.49%) AWS Step Functions
13 19 (2.49%) Azure Synapse Analytics
14 18 (2.36%) Adobe Analytics
14 18 (2.36%) GitHub
15 16 (2.10%) Google Ads
16 15 (1.97%) Amazon EC2
16 15 (1.97%) Amazon SQS
16 15 (1.97%) Boomi
Communications & Networking
1 4 (0.52%) HTTP
2 3 (0.39%) Bluetooth
3 2 (0.26%) Firewall
3 2 (0.26%) Internet
3 2 (0.26%) SMS
4 1 (0.13%) Intranet
4 1 (0.13%) LAN
4 1 (0.13%) PPP
4 1 (0.13%) Remote Desktop
4 1 (0.13%) VPN
4 1 (0.13%) WAN
Database & Business Intelligence
1 238 (31.19%) Power BI
2 115 (15.07%) Tableau
3 113 (14.81%) Big Data
4 66 (8.65%) Data Warehouse
5 65 (8.52%) Data Lake
6 29 (3.80%) SQL Server
7 27 (3.54%) Metadata
8 26 (3.41%) NoSQL
9 25 (3.28%) Hadoop
10 17 (2.23%) Relational Database
11 16 (2.10%) Amazon Redshift
11 16 (2.10%) Power Query
12 15 (1.97%) PostgreSQL
13 13 (1.70%) MongoDB
14 12 (1.57%) BigQuery
14 12 (1.57%) SQL Server Integration Services
15 11 (1.44%) Microsoft Analysis Services
16 10 (1.31%) Data Mining
16 10 (1.31%) SQL Server Reporting Services
17 9 (1.18%) SQL Server Analysis Services
Development Applications
1 23 (3.01%) Git
2 22 (2.88%) JIRA
3 7 (0.92%) Jenkins
4 5 (0.66%) SQL Server Management Studio (SSMS)
5 4 (0.52%) Subversion
6 3 (0.39%) CircleCI
7 2 (0.26%) ER Studio
7 2 (0.26%) GitLab
7 2 (0.26%) MLflow
8 1 (0.13%) Bitbucket
8 1 (0.13%) Cypress.io
8 1 (0.13%) Selenium
8 1 (0.13%) Vite
General
1 356 (46.66%) Social Skills
2 326 (42.73%) Finance
3 188 (24.64%) Analytical Skills
4 133 (17.43%) Law
5 95 (12.45%) Marketing
6 80 (10.48%) Inclusion and Diversity
6 80 (10.48%) Retail
7 67 (8.78%) Banking
8 66 (8.65%) Manufacturing
9 61 (7.99%) Organisational Skills
10 57 (7.47%) Games
11 56 (7.34%) Telecoms
12 40 (5.24%) Public Sector
13 27 (3.54%) Legal
14 26 (3.41%) Presentation Skills
15 22 (2.88%) Advertising
16 15 (1.97%) Influencing Skills
16 15 (1.97%) Pharmaceutical
17 11 (1.44%) Publishing
18 9 (1.18%) Documentation Skills
Job Titles
1 276 (36.17%) Analyst
2 137 (17.96%) Data Analyst
3 129 (16.91%) Senior
4 86 (11.27%) Lead
5 45 (5.90%) Digital Analyst
6 37 (4.85%) Data Engineer
7 31 (4.06%) Risk Manager
7 31 (4.06%) Technology Risk Manager
8 28 (3.67%) Business Analyst
9 27 (3.54%) Architect
10 26 (3.41%) Data Analytics Director
10 26 (3.41%) Procurement Analyst
11 25 (3.28%) Audit Manager
11 25 (3.28%) Data Manager
12 24 (3.15%) Graduate
13 23 (3.01%) Analytics Manager
14 21 (2.75%) Compliance Analyst
14 21 (2.75%) Graduate Analyst
14 21 (2.75%) Senior Manager
15 20 (2.62%) Senior Analyst
Libraries, Frameworks & Software Standards
1 45 (5.90%) Kafka
2 17 (2.23%) RESTful
3 16 (2.10%) JWT
3 16 (2.10%) OAuth
4 14 (1.83%) React
5 13 (1.70%) PyTorch
5 13 (1.70%) TensorFlow
6 11 (1.44%) NumPy
6 11 (1.44%) scikit-learn
7 9 (1.18%) Keras
8 8 (1.05%) CSS
8 8 (1.05%) HTML
9 7 (0.92%) JSON
9 7 (0.92%) Pandas
9 7 (0.92%) Web Services
10 6 (0.79%) Akka
10 6 (0.79%) Node.js
10 6 (0.79%) PySpark
10 6 (0.79%) RabbitMQ
10 6 (0.79%) Spring
Miscellaneous
1 73 (9.57%) Management Information System
2 65 (8.52%) Robotics
3 52 (6.82%) Blockchain
4 39 (5.11%) Product Ownership
5 38 (4.98%) Algorithms
6 27 (3.54%) FMCG
7 25 (3.28%) Cloud Native
8 18 (2.36%) Data Structures
9 17 (2.23%) Social Media
10 15 (1.97%) Legacy Systems
10 15 (1.97%) Self-Motivation
11 11 (1.44%) Analytical Mindset
11 11 (1.44%) Mobile Games
12 9 (1.18%) Mobile App
13 8 (1.05%) Hybrid Cloud
14 7 (0.92%) Credit Risk
14 7 (0.92%) Derivative
14 7 (0.92%) OTC Derivatives
14 7 (0.92%) Public Cloud
15 4 (0.52%) SCADA
Operating Systems
1 11 (1.44%) Linux
2 4 (0.52%) Windows
3 3 (0.39%) Ubuntu
4 1 (0.13%) Mac OS
4 1 (0.13%) Unix
4 1 (0.13%) Windows Server
4 1 (0.13%) Windows Server 2016
4 1 (0.13%) Windows Server 2019
4 1 (0.13%) zOS
Processes & Methodologies
1 763 (100.00%) Analytics
2 242 (31.72%) Artificial Intelligence
3 234 (30.67%) Business Intelligence
4 231 (30.28%) Agile
5 176 (23.07%) Data Analysis
6 173 (22.67%) Problem-Solving
7 172 (22.54%) Visualisation
8 164 (21.49%) Mentoring
9 132 (17.30%) Decision-Making
10 128 (16.78%) Coaching
11 123 (16.12%) Computer Science
12 112 (14.68%) Data Science
13 111 (14.55%) Machine Learning
14 107 (14.02%) Data Governance
15 102 (13.37%) Data Engineering
15 102 (13.37%) Project Management
16 101 (13.24%) Data Management
17 95 (12.45%) Business Strategy
18 93 (12.19%) Stakeholder Management
19 90 (11.80%) Risk Management
Programming Languages
1 253 (33.16%) SQL
2 207 (27.13%) Python
3 43 (5.64%) Java
4 34 (4.46%) R
5 30 (3.93%) C#
6 27 (3.54%) Data Analysis Expressions
6 27 (3.54%) JavaScript
7 12 (1.57%) Scala
8 10 (1.31%) C
8 10 (1.31%) T-SQL
9 9 (1.18%) Bash
9 9 (1.18%) PowerShell
10 8 (1.05%) TypeScript
11 7 (0.92%) C++
12 6 (0.79%) VBA
13 4 (0.52%) Julia
14 3 (0.39%) Ladder Logic
15 2 (0.26%) JCL
15 2 (0.26%) Kusto Query Language
15 2 (0.26%) Shell Script
Qualifications
1 350 (45.87%) Degree
2 47 (6.16%) Master's Degree
3 39 (5.11%) CISA
3 39 (5.11%) Security Cleared
4 33 (4.33%) Computer Science Degree
5 24 (3.15%) ACCA
5 24 (3.15%) CIMA
6 23 (3.01%) PhD
7 22 (2.88%) Azure Certification
7 22 (2.88%) DBS Check
7 22 (2.88%) ISACA
7 22 (2.88%) SC Cleared
8 19 (2.49%) CCAB
8 19 (2.49%) CIPFA
8 19 (2.49%) ICAEW
9 15 (1.97%) AWS Certification
10 9 (1.18%) Numerate Degree
11 8 (1.05%) Microsoft Certification
12 7 (0.92%) CISSP
13 6 (0.79%) Six Sigma Black Belt
Quality Assurance & Compliance
1 109 (14.29%) Data Quality
2 46 (6.03%) ITGC
3 31 (4.06%) QA
4 25 (3.28%) Accessibility
5 20 (2.62%) GDPR
6 19 (2.49%) MiFID
7 18 (2.36%) EMIR
8 16 (2.10%) Actionable Recommendations
9 12 (1.57%) Sarbanes-Oxley
10 9 (1.18%) California Consumer Privacy Act
11 8 (1.05%) Def Stans
12 6 (0.79%) GxP
12 6 (0.79%) ISO/IEC 27001
13 4 (0.52%) SLA
14 3 (0.39%) COBIT
15 2 (0.26%) HIPAA
15 2 (0.26%) PMO
16 1 (0.13%) COSO
16 1 (0.13%) GRC
16 1 (0.13%) NIST
System Software
1 13 (1.70%) Docker
2 4 (0.52%) Active Directory
3 3 (0.39%) VMware Infrastructure
4 2 (0.26%) HDFS
4 2 (0.26%) Virtual Desktop
4 2 (0.26%) Virtual Machines
5 1 (0.13%) Job Entry Subsystem
5 1 (0.13%) Time Sharing Option
Systems Management
1 23 (3.01%) Kubernetes
2 18 (2.36%) Terraform
3 3 (0.39%) Grafana
4 2 (0.26%) Ansible
4 2 (0.26%) Hadoop YARN
4 2 (0.26%) Prometheus
4 2 (0.26%) SCCM
4 2 (0.26%) Systems Management Server (SMS)
5 1 (0.13%) Argo
5 1 (0.13%) Microsoft Intune
5 1 (0.13%) Nessus
5 1 (0.13%) NetBackup
5 1 (0.13%) Single Sign-On
Vendors
1 128 (16.78%) Microsoft
2 75 (9.83%) SAP
3 68 (8.91%) Google
4 60 (7.86%) Databricks
5 55 (7.21%) Alteryx
6 46 (6.03%) ServiceNow
7 29 (3.80%) Oracle
8 21 (2.75%) Adobe
8 21 (2.75%) Informatica
8 21 (2.75%) Salesforce
9 16 (2.10%) MuleSoft
10 13 (1.70%) VMware
11 9 (1.18%) IBM
12 7 (0.92%) Cisco
12 7 (0.92%) Omniture
13 6 (0.79%) Infor
14 5 (0.66%) Talend
14 5 (0.66%) TikTok
15 4 (0.52%) Guidewire
15 4 (0.52%) Salesforce Marketing Cloud