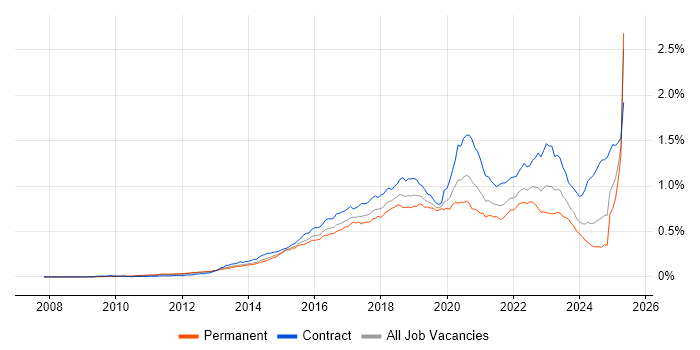
Splunk Jobs in England

Splunk
UK > England

The table below provides summary statistics for permanent job vacancies advertised in England requiring knowledge or experience of Splunk products and/or services. It includes a benchmarking guide to the annual salaries offered in vacancies that cited Splunk over the 6 months leading up to 29 May 2025, comparing them to the same period in the previous two years.

The figures below represent the IT labour market in general and are not representative of salaries within Splunk, Inc.

6 months to
29 May 2025
Same period 2024 Same period 2023
Rank 307 508 422
Rank change year-on-year +201 -86 +21
Permanent jobs citing Splunk 450 350 622
As % of all permanent jobs advertised in England 0.93% 0.39% 0.72%
As % of the Vendors category 2.37% 1.10% 1.72%
Number of salaries quoted 106 272 374
10th Percentile £42,000 £42,238 £43,250
25th Percentile £52,313 £50,000 £53,970
Median annual salary (50th Percentile) £65,000 £60,000 £70,000
Median % change year-on-year +8.33% -14.29% -5.72%
75th Percentile £80,000 £72,500 £87,500
90th Percentile £100,000 £85,420 £95,000
UK median annual salary £63,750 £60,000 £72,500
% change year-on-year +6.25% -17.24% -3.33%

All Vendors
England

Splunk falls under the Vendor Products and Services category. For comparison with the information above, the following table provides summary statistics for all permanent job vacancies requiring knowledge or experience of all vendor products and services in England.

Permanent vacancies with a requirement for knowledge or experience of vendor products and services 19,001 31,812 36,207
As % of all permanent jobs advertised in England 39.14% 35.80% 41.82%
Number of salaries quoted 10,469 22,619 21,090
10th Percentile £27,336 £26,500 £31,000
25th Percentile £37,500 £35,897 £41,250
Median annual salary (50th Percentile) £55,000 £50,000 £57,500
Median % change year-on-year +10.00% -13.04% +4.55%
75th Percentile £70,600 £68,750 £75,000
90th Percentile £90,000 £87,500 £92,500
UK median annual salary £55,000 £50,000 £57,500
% change year-on-year +10.00% -13.04% +4.55%

Splunk
Job Vacancy Trend in England

Job postings citing Splunk as a proportion of all IT jobs advertised in England.

Job vacancy trend for Splunk in England

Splunk
Salary Trend in England

3-month moving average salary quoted in jobs citing Splunk in England.

Salary trend for Splunk in England

Splunk
Salary Histogram in England

Salary distribution for jobs citing Splunk in England over the 6 months to 29 May 2025.

Salary histogram for Splunk in England

Splunk
Job Locations in England

The table below looks at the demand and provides a guide to the median salaries quoted in IT jobs citing Splunk within the England region over the 6 months to 29 May 2025. The 'Rank Change' column provides an indication of the change in demand within each location based on the same 6 month period last year.

Location Rank Change
on Same Period
Last Year
Matching
Permanent
IT Job Ads
Median Salary
Past 6 Months
Median Salary
% Change
on Same Period
Last Year
Live
Jobs
North of England +155 273 £55,000 -3.51% 182
North West +159 267 £55,000 -8.33% 93
London +71 93 £80,000 +10.34% 172
South East +75 44 £55,000 - 262
East of England +36 22 £61,500 +2.50% 128
Midlands +59 18 £64,500 +29.00% 135
West Midlands +60 9 £59,000 +18.00% 76
East Midlands +29 9 £72,500 +45.00% 50
South West +105 8 £48,000 -4.00% 100
Yorkshire +17 6 - - 70
Splunk
UK

Splunk
Co-occurring Skills and Capabilities in England by Category

The follow tables expand on the table above by listing co-occurrences grouped by category. The same employment type, locality and period is covered with up to 20 co-occurrences shown in each of the following categories:

Application Platforms
1 5 (1.11%) Confluence
1 5 (1.11%) Microsoft Exchange
2 3 (0.67%) nginx
3 2 (0.44%) Apache
3 2 (0.44%) GemFire
4 1 (0.22%) Apache Airflow
4 1 (0.22%) JBoss
Business Applications
1 1 (0.22%) Aladdin
1 1 (0.22%) thinkFolio
Cloud Services
1 79 (17.56%) AWS
2 42 (9.33%) Azure
3 26 (5.78%) GCP
4 25 (5.56%) Serverless
5 22 (4.89%) Amazon ECS
6 18 (4.00%) Amazon EC2
7 16 (3.56%) Amazon EKS
8 14 (3.11%) Azure Sentinel
9 13 (2.89%) GitHub
10 12 (2.67%) Amazon CloudWatch
10 12 (2.67%) Azure Monitor
10 12 (2.67%) SaaS
11 9 (2.00%) Datadog
12 8 (1.78%) AWS CloudFormation
13 7 (1.56%) AWS Lambda
14 5 (1.11%) Amazon S3
14 5 (1.11%) Entra ID
15 4 (0.89%) Azure DevOps
15 4 (0.89%) Azure Functions
15 4 (0.89%) BlazeMeter
Communications & Networking
1 287 (63.78%) VPN
2 262 (58.22%) Cisco IOS
3 44 (9.78%) Firewall
4 25 (5.56%) Network Security
4 25 (5.56%) TCP/IP
5 15 (3.33%) HTTP
6 12 (2.67%) FTP
6 12 (2.67%) LAN
6 12 (2.67%) SMTP
6 12 (2.67%) WAN
7 11 (2.44%) Internet
8 10 (2.22%) Intrusion Detection
9 6 (1.33%) DNS
10 5 (1.11%) Kerberos
11 4 (0.89%) Unified Communications
12 3 (0.67%) DHCP
12 3 (0.67%) SAN
12 3 (0.67%) SSL
13 2 (0.44%) Reverse Proxy
13 2 (0.44%) Wireshark
Database & Business Intelligence
1 25 (5.56%) Relational Database
2 20 (4.44%) PostgreSQL
3 14 (3.11%) RDBMS
4 12 (2.67%) SQL Server
5 11 (2.44%) MongoDB
6 8 (1.78%) Elasticsearch
7 6 (1.33%) MySQL
8 5 (1.11%) NoSQL
9 4 (0.89%) Amazon Athena
9 4 (0.89%) Data Warehouse
9 4 (0.89%) DynamoDB
10 3 (0.67%) Amazon RDS
10 3 (0.67%) Big Data
11 2 (0.44%) Apache Iceberg
11 2 (0.44%) BigQuery
11 2 (0.44%) Cloud Spanner
11 2 (0.44%) Data Lake
11 2 (0.44%) Electronic Patient Records
11 2 (0.44%) Power BI
11 2 (0.44%) Redis
Development Applications
1 39 (8.67%) Jenkins
2 19 (4.22%) Git
3 17 (3.78%) JUnit
4 15 (3.33%) JIRA
4 15 (3.33%) Mockito
5 14 (3.11%) JMeter
6 13 (2.89%) GitLab
7 5 (1.11%) Atlassian Bamboo
7 5 (1.11%) Maven
8 4 (0.89%) Bitbucket
8 4 (0.89%) Postman
9 3 (0.67%) REST Assured
9 3 (0.67%) SoapUI
9 3 (0.67%) SonarQube
10 2 (0.44%) CircleCI
10 2 (0.44%) Cucumber
10 2 (0.44%) Gradle
10 2 (0.44%) Subversion
10 2 (0.44%) Xcode
10 2 (0.44%) XCTest
General
1 296 (65.78%) Analytical Skills
2 275 (61.11%) Inclusion and Diversity
3 60 (13.33%) Social Skills
4 37 (8.22%) Finance
5 20 (4.44%) Public Sector
6 13 (2.89%) Banking
6 13 (2.89%) Law
7 7 (1.56%) Presentation Skills
8 6 (1.33%) Aerospace
8 6 (1.33%) Aviation
8 6 (1.33%) Telecoms
9 5 (1.11%) Marketing
10 4 (0.89%) Documentation Skills
10 4 (0.89%) Pharmaceutical
11 2 (0.44%) Military
12 1 (0.22%) Automotive
12 1 (0.22%) Cantonese Language
12 1 (0.22%) Games
12 1 (0.22%) Investment Banking
12 1 (0.22%) Manufacturing
Job Titles
1 264 (58.67%) Infrastructure Engineer
2 38 (8.44%) Senior
3 34 (7.56%) Analyst
4 29 (6.44%) Lead
5 26 (5.78%) Developer
6 20 (4.44%) SOC Analyst
7 17 (3.78%) Security Engineer
8 15 (3.33%) Java Developer
8 15 (3.33%) Senior Analyst
9 14 (3.11%) DevOps Engineer
10 10 (2.22%) Security Analyst
11 9 (2.00%) Cybersecurity Engineer
12 7 (1.56%) Applications Support
12 7 (1.56%) Identity and Access Management Engineer
12 7 (1.56%) Identity Management Engineer
12 7 (1.56%) Software Engineer
13 6 (1.33%) Cloud Engineer
13 6 (1.33%) SIEM Engineer
13 6 (1.33%) Site Engineer
13 6 (1.33%) Site Reliability Engineer
Libraries, Frameworks & Software Standards
1 277 (61.56%) Elastic Stack
2 24 (5.33%) REST
3 22 (4.89%) Spring
4 21 (4.67%) Spring Boot
5 19 (4.22%) Web Services
6 18 (4.00%) LDAP
7 17 (3.78%) HTML
8 16 (3.56%) Hibernate
9 14 (3.11%) Kafka
10 13 (2.89%) ActiveMQ
10 13 (2.89%) Apache Camel
10 13 (2.89%) jQuery
10 13 (2.89%) WireMock
11 10 (2.22%) JSON
11 10 (2.22%) OAuth
12 8 (1.78%) SOAP
13 7 (1.56%) OpenID
13 7 (1.56%) SAML
13 7 (1.56%) XML
14 6 (1.33%) SailPoint
Miscellaneous
1 263 (58.44%) Cyberattack
2 29 (6.44%) Security Operations Centre
3 18 (4.00%) Distributed Systems
4 16 (3.56%) Cyber Threat
5 13 (2.89%) Security Posture
6 12 (2.67%) Client/Server
7 11 (2.44%) Management Information System
8 10 (2.22%) PKI
9 8 (1.78%) Cloud Native
9 8 (1.78%) Cyber Defence
9 8 (1.78%) Onboarding
10 7 (1.56%) Data Centre
11 6 (1.33%) Robotics
12 5 (1.11%) Analytical Mindset
13 4 (0.89%) Data Protection Act
14 3 (0.67%) Equities
14 3 (0.67%) MISP
14 3 (0.67%) Product Ownership
15 2 (0.44%) Insider Threat
15 2 (0.44%) YARA
Operating Systems
1 295 (65.56%) Windows
2 293 (65.11%) Linux
3 269 (59.78%) Android
4 17 (3.78%) Windows Server
5 13 (2.89%) Unix
6 6 (1.33%) Apple iOS
7 4 (0.89%) CentOS
8 3 (0.67%) Red Hat Enterprise Linux
9 2 (0.44%) Debian
9 2 (0.44%) Ubuntu
9 2 (0.44%) Windows Server 2016
10 1 (0.22%) Mac OS
10 1 (0.22%) Windows Server 2019
Processes & Methodologies
1 314 (69.78%) Problem-Solving
2 305 (67.78%) DevOps
3 278 (61.78%) Line Management
4 269 (59.78%) Risk Management
4 269 (59.78%) Task Automation
5 267 (59.33%) Infrastructure Engineering
6 264 (58.67%) Platform Engineering
7 263 (58.44%) Mathematics
8 262 (58.22%) Storage Management
9 94 (20.89%) SIEM
10 58 (12.89%) Incident Response
11 52 (11.56%) CI/CD
12 50 (11.11%) Cybersecurity
13 44 (9.78%) Agile
14 40 (8.89%) Security Operations
15 25 (5.56%) Continuous Improvement
15 25 (5.56%) Infrastructure as Code
16 23 (5.11%) Mentoring
16 23 (5.11%) Microservices
17 22 (4.89%) Scrum
Programming Languages
1 333 (74.00%) Python
2 299 (66.44%) PowerShell
3 294 (65.33%) Bash
4 32 (7.11%) Java
5 27 (6.00%) SQL
6 24 (5.33%) Shell Script
7 20 (4.44%) JavaScript
8 10 (2.22%) Kusto Query Language
9 9 (2.00%) Go
9 9 (2.00%) Perl
10 7 (1.56%) C++
11 6 (1.33%) Search Processing Language
12 5 (1.11%) C#
12 5 (1.11%) Ruby
13 4 (0.89%) PL/SQL
14 3 (0.67%) Gremlin
14 3 (0.67%) Groovy
15 1 (0.22%) ActionScript
15 1 (0.22%) ActionScript 2.0
15 1 (0.22%) Scala
Qualifications
1 74 (16.44%) Security Cleared
2 48 (10.67%) SC Cleared
3 33 (7.33%) DV Cleared
4 27 (6.00%) Degree
5 16 (3.56%) CISSP
6 11 (2.44%) Computer Science Degree
7 10 (2.22%) CISM
8 9 (2.00%) CompTIA Security+
8 9 (2.00%) Microsoft Certification
9 8 (1.78%) CEH
9 8 (1.78%) OSCP
10 5 (1.11%) GCIH
11 4 (0.89%) AWS Certification
11 4 (0.89%) Azure Certification
11 4 (0.89%) CCNA
11 4 (0.89%) CCNP
11 4 (0.89%) Cisco Certification
11 4 (0.89%) CompTIA CySA+
11 4 (0.89%) GCFA
12 3 (0.67%) AWS Certified Solutions Architect
Quality Assurance & Compliance
1 23 (5.11%) ISO/IEC 27001
2 16 (3.56%) NIST
3 14 (3.11%) SLA
4 13 (2.89%) Cyber Essentials
5 10 (2.22%) GDPR
6 8 (1.78%) Cyber Essentials PLUS
7 6 (1.33%) HIPAA
8 4 (0.89%) NCSC
8 4 (0.89%) QA
9 2 (0.44%) SOC 2
10 1 (0.22%) Accessibility
System Software
1 305 (67.78%) Docker
2 265 (58.89%) Hyper-V
3 262 (58.22%) VMware NSX
3 262 (58.22%) vSphere
4 10 (2.22%) Active Directory
5 7 (1.56%) VMware Infrastructure
6 4 (0.89%) EMC RecoverPoint
7 1 (0.22%) Citrix Hypervisor
7 1 (0.22%) Snort
Systems Management
1 289 (64.22%) Terraform
2 285 (63.33%) Ansible
3 39 (8.67%) Kubernetes
4 37 (8.22%) Grafana
5 31 (6.89%) QRadar
6 23 (5.11%) Prometheus
7 17 (3.78%) Kibana
8 10 (2.22%) Progress Chef
9 8 (1.78%) Single Sign-On
10 7 (1.56%) Nagios
11 6 (1.33%) ArcSight ESM
12 4 (0.89%) Cisco CUCM
12 4 (0.89%) Graylog
12 4 (0.89%) VxRail
13 3 (0.67%) Active Directory Federation Services
13 3 (0.67%) Argo
13 3 (0.67%) Nessus
14 2 (0.44%) HAProxy
14 2 (0.44%) Puppet
14 2 (0.44%) SCOM
Vendors
1 270 (60.00%) Cisco
2 262 (58.22%) 3PAR
2 262 (58.22%) Juniper
3 56 (12.44%) Microsoft
4 25 (5.56%) Dynatrace
5 13 (2.89%) Google
5 13 (2.89%) Oracle
6 10 (2.22%) VMware
7 8 (1.78%) ArcSight
7 8 (1.78%) Red Hat
7 8 (1.78%) ServiceNow
8 7 (1.56%) McAfee
8 7 (1.56%) Palo Alto
9 6 (1.33%) LogLogic
9 6 (1.33%) SolarWinds
10 5 (1.11%) CrowdStrike
10 5 (1.11%) IBM
11 4 (0.89%) AlienVault
11 4 (0.89%) Sophos
11 4 (0.89%) Zscaler