Enterprise Software Jobs in the UK excluding London

Enterprise Application Software
UK > UK excluding London

The table below looks at the prevalence of the term Enterprise Software in permanent job vacancies in the UK excluding London. Included is a benchmarking guide to the salaries offered in vacancies that cited Enterprise Software over the 6 months leading up to 31 May 2025, comparing them to the same period in the previous two years.

6 months to
31 May 2025
Same period 2024 Same period 2023
Rank 209 334 329
Rank change year-on-year +125 -5 -7
Permanent jobs citing Enterprise Software 568 550 556
As % of all permanent jobs advertised in the UK excluding London 1.43% 0.73% 0.97%
As % of the Miscellaneous category 4.19% 2.24% 2.28%
Number of salaries quoted 114 386 403
10th Percentile £32,500 £36,250 £37,500
25th Percentile £46,250 £43,750 £46,250
Median annual salary (50th Percentile) £63,500 £55,000 £57,500
Median % change year-on-year +15.45% -4.35% +4.55%
75th Percentile £75,000 £73,438 £73,750
90th Percentile £86,375 £85,000 £88,750
UK median annual salary £64,875 £62,500 £65,000
% change year-on-year +3.80% -3.85% +2.36%

All Generic Skills
UK excluding London

Enterprise Software falls under the General and Transferable Skills category. For comparison with the information above, the following table provides summary statistics for all permanent job vacancies requiring generic IT skills in the UK excluding London.

Permanent vacancies with a requirement for generic IT skills 13,541 24,499 24,363
As % of all permanent jobs advertised in the UK excluding London 34.12% 32.71% 42.50%
Number of salaries quoted 5,957 15,292 10,888
10th Percentile £28,500 £26,250 £31,250
25th Percentile £36,925 £35,000 £41,125
Median annual salary (50th Percentile) £55,000 £50,000 £55,000
Median % change year-on-year +10.00% -9.09% +4.76%
75th Percentile £68,000 £65,000 £70,000
90th Percentile £80,000 £78,750 £85,000
UK median annual salary £60,000 £55,000 £65,000
% change year-on-year +9.09% -15.38% +4.00%

Enterprise Software
Job Vacancy Trend in the UK excluding London

Job postings citing Enterprise Software as a proportion of all IT jobs advertised in the UK excluding London.
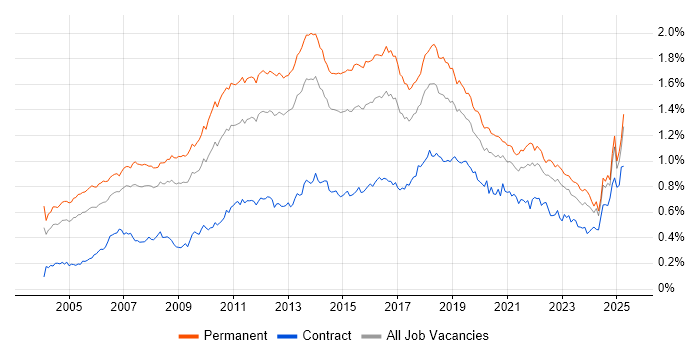
Job vacancy trend for Enterprise Software in the UK excluding London

Enterprise Software
Salary Trend in the UK excluding London

3-month moving average salary quoted in jobs citing Enterprise Software in the UK excluding London.

Salary trend for Enterprise Software in the UK excluding London

Enterprise Software
Salary Histogram in the UK excluding London

Salary distribution for jobs citing Enterprise Software in the UK excluding London over the 6 months to 31 May 2025.

Salary histogram for Enterprise Software in the UK excluding London

Enterprise Software
Job Locations in the UK excluding London

The table below looks at the demand and provides a guide to the median salaries quoted in IT jobs citing Enterprise Software within the UK excluding London region over the 6 months to 31 May 2025. The 'Rank Change' column provides an indication of the change in demand within each location based on the same 6 month period last year.

Location Rank Change
on Same Period
Last Year
Matching
Permanent
IT Job Ads
Median Salary
Past 6 Months
Median Salary
% Change
on Same Period
Last Year
Live
Jobs
North of England +81 212 £61,250 -4.13% 78
Midlands +85 161 £63,500 +1.60% 38
North West +28 126 £70,000 +11.50% 56
West Midlands +79 93 £62,500 -15.25% 25
Yorkshire +94 82 £35,000 -50.00% 15
South East +16 81 £62,500 +19.05% 58
East Midlands +61 68 £63,500 +33.68% 13
Scotland +141 58 £100,000 +110.53% 21
East of England +53 51 £66,100 +25.90% 21
North East +43 4 £60,000 -4.43% 7
South West +83 3 £46,500 -2.11% 19
Northern Ireland +37 3 - - 4
Wales +16 2 £59,520 +14.24% 7
Enterprise Software
UK

Enterprise Software
Co-occurring Skills and Capabilities in the UK excluding London by Category

The follow tables expand on the table above by listing co-occurrences grouped by category. The same employment type, locality and period is covered with up to 20 co-occurrences shown in each of the following categories:

Application Platforms
1 158 (27.82%) Confluence
2 13 (2.29%) IIS
3 10 (1.76%) Tomcat
4 5 (0.88%) SharePoint
5 4 (0.70%) JBoss
6 3 (0.53%) Apache
7 2 (0.35%) Microsoft Exchange
7 2 (0.35%) NetWeaver
7 2 (0.35%) nginx
7 2 (0.35%) OpenStack
8 1 (0.18%) BizTalk Server
8 1 (0.18%) Jupyter
8 1 (0.18%) Moodle
Applications
1 14 (2.46%) Microsoft Office
2 6 (1.06%) Chatbot
3 2 (0.35%) Microsoft Excel
3 2 (0.35%) MS Visio
Business Applications
1 8 (1.41%) SAP S/4HANA
2 3 (0.53%) Dynamics CRM
2 3 (0.53%) Oracle EBS
2 3 (0.53%) Oracle ERP
3 2 (0.35%) PeopleSoft HCM
4 1 (0.18%) Dynamics NAV
Cloud Services
1 400 (70.42%) AWS
2 278 (48.94%) Azure
3 161 (28.35%) GCP
4 34 (5.99%) Microsoft 365
5 22 (3.87%) SaaS
6 21 (3.70%) Salesforce Sales Cloud
7 17 (2.99%) Entra ID
8 13 (2.29%) Microsoft Copilot
9 10 (1.76%) Power Automate
10 7 (1.23%) Mimecast
10 7 (1.23%) Power Platform
11 5 (0.88%) Azure DevOps
11 5 (0.88%) OpenShift
12 4 (0.70%) Cloud Computing
12 4 (0.70%) PowerApps
13 3 (0.53%) AWS CloudFormation
13 3 (0.53%) Nutanix
13 3 (0.53%) OCI
14 2 (0.35%) Azure Machine Learning
14 2 (0.35%) Serverless
Communications & Networking
1 9 (1.58%) DMARC
1 9 (1.58%) DNS
1 9 (1.58%) SSL
2 8 (1.41%) Firewall
3 5 (0.88%) DHCP
4 3 (0.53%) HTTP
4 3 (0.53%) Network Security
4 3 (0.53%) VPN
5 2 (0.35%) F5 BIG-IP LTM
5 2 (0.35%) IP Telephony
5 2 (0.35%) SAN
5 2 (0.35%) TCP/IP
5 2 (0.35%) Wireless
6 1 (0.18%) Internet
6 1 (0.18%) Intranet
6 1 (0.18%) IPsec
Database & Business Intelligence
1 265 (46.65%) SQL Server
2 13 (2.29%) PostgreSQL
3 9 (1.58%) MongoDB
4 7 (1.23%) Oracle Database
5 6 (1.06%) Power BI
6 5 (0.88%) Elasticsearch
6 5 (0.88%) NoSQL
7 3 (0.53%) SQL Server Reporting Services
8 2 (0.35%) InterSystems Cache
8 2 (0.35%) SAP HANA
9 1 (0.18%) Oracle BI Publisher
9 1 (0.18%) Oracle Reports
9 1 (0.18%) RDBMS
9 1 (0.18%) Relational Database
9 1 (0.18%) SQL Server Integration Services
Development Applications
1 250 (44.01%) JIRA
2 248 (43.66%) GitLab
3 247 (43.49%) Selenium
4 246 (43.31%) Bitbucket
4 246 (43.31%) Cucumber
4 246 (43.31%) Maven
4 246 (43.31%) SonarQube
4 246 (43.31%) Sonatype Nexus
5 8 (1.41%) Git
6 5 (0.88%) Jenkins
7 4 (0.70%) TeamCity
8 3 (0.53%) MSTest
8 3 (0.53%) NUnit
8 3 (0.53%) SpecFlow
8 3 (0.53%) Subversion
9 1 (0.18%) Cypress.io
9 1 (0.18%) Jasmine
9 1 (0.18%) Karma Test Runner
9 1 (0.18%) Postman
9 1 (0.18%) SQL Server Management Studio (SSMS)
General
1 290 (51.06%) Finance
2 252 (44.37%) Inclusion and Diversity
3 250 (44.01%) Banking
4 215 (37.85%) Social Skills
5 144 (25.35%) Presentation Skills
6 100 (17.61%) Retail
7 90 (15.85%) Corporate Banking
7 90 (15.85%) Investment Banking
8 56 (9.86%) Law
9 28 (4.93%) Marketing
10 10 (1.76%) Analytical Skills
11 9 (1.58%) Czech Language
11 9 (1.58%) Organisational Skills
12 5 (0.88%) Online Betting
13 3 (0.53%) Front Office
13 3 (0.53%) Manufacturing
14 2 (0.35%) Influencing Skills
15 1 (0.18%) Back Office
15 1 (0.18%) Police
15 1 (0.18%) Public Sector
Job Titles
1 255 (44.89%) Software Engineer
2 144 (25.35%) IT Support
3 53 (9.33%) Architect
4 40 (7.04%) Enterprise Architect
5 31 (5.46%) Lead
6 29 (5.11%) Developer
7 21 (3.70%) Salesforce Architect
8 11 (1.94%) Administrator
8 11 (1.94%) Java Engineer
8 11 (1.94%) Software Developer
9 9 (1.58%) IT Administrator
10 7 (1.23%) Integration Developer
10 7 (1.23%) Solutions Architect
11 6 (1.06%) Integration Specialist
11 6 (1.06%) Lead Software Engineer
11 6 (1.06%) SAP Developer
11 6 (1.06%) Senior
11 6 (1.06%) Trainer
12 5 (0.88%) Java Developer
12 5 (0.88%) Java Software Engineer
Libraries, Frameworks & Software Standards
1 259 (45.60%) HTML
1 259 (45.60%) Spring
2 257 (45.25%) React
3 253 (44.54%) CSS
4 248 (43.66%) Kafka
4 248 (43.66%) Spring Boot
5 246 (43.31%) JPA
5 246 (43.31%) Redux
6 156 (27.46%) Hibernate
7 139 (24.47%) REST
8 97 (17.08%) HTML5
9 96 (16.90%) CSS3
10 93 (16.37%) Sass
11 91 (16.02%) RESTful
12 90 (15.85%) Jest
13 38 (6.69%) SOAP
14 29 (5.11%) Middleware
15 21 (3.70%) Lightning Web Components
16 17 (2.99%) .NET
17 15 (2.64%) JSON
Miscellaneous
1 248 (43.66%) Product Ownership
2 16 (2.82%) Cloud Native
3 14 (2.46%) Self-Motivation
4 7 (1.23%) Smartphone
5 4 (0.70%) Legacy Systems
5 4 (0.70%) Onboarding
5 4 (0.70%) Public Cloud
5 4 (0.70%) Virtual Team
6 3 (0.53%) Credit Derivative
6 3 (0.53%) Derivative
6 3 (0.53%) Equities
6 3 (0.53%) Fixed Income
6 3 (0.53%) Foreign Exchange (FX)
6 3 (0.53%) Legacy Code
6 3 (0.53%) PKI
6 3 (0.53%) Private Cloud
7 2 (0.35%) Data Centre
7 2 (0.35%) Driving Licence
7 2 (0.35%) LIMS
7 2 (0.35%) Management Information System
Operating Systems
1 155 (27.29%) Windows
2 11 (1.94%) Linux
3 9 (1.58%) Unix
4 4 (0.70%) Windows Server
5 2 (0.35%) Android
5 2 (0.35%) Mac OS X
5 2 (0.35%) Windows 10
5 2 (0.35%) Windows Server 2016
6 1 (0.18%) Oracle Linux
Processes & Methodologies
1 307 (54.05%) Agile
2 302 (53.17%) Microservices
3 286 (50.35%) DevOps
4 273 (48.06%) CI/CD
5 268 (47.18%) Software Engineering
6 257 (45.25%) Test Automation
7 256 (45.07%) SDLC
8 253 (44.54%) Containerisation
9 249 (43.84%) Full-Stack Development
10 248 (43.66%) Performance Optimisation
11 247 (43.49%) Front End Development
12 194 (34.15%) Continuous Improvement
13 164 (28.87%) Clean Code
14 160 (28.17%) TDD
15 157 (27.64%) Problem-Solving
16 135 (23.77%) Line Management
17 133 (23.42%) Mathematics
18 109 (19.19%) Mentoring
19 102 (17.96%) Migration
20 95 (16.73%) User Experience
Programming Languages
1 284 (50.00%) SQL
2 280 (49.30%) JavaScript
3 275 (48.42%) Java
4 97 (17.08%) TypeScript
5 21 (3.70%) Apex Code
6 20 (3.52%) C#
7 15 (2.64%) PowerShell
8 9 (1.58%) VBA
9 7 (1.23%) C++
9 7 (1.23%) Python
10 4 (0.70%) Rust
11 2 (0.35%) ABAP
11 2 (0.35%) PL/SQL
12 1 (0.18%) C
12 1 (0.18%) R
12 1 (0.18%) SAPscript
Qualifications
1 61 (10.74%) Degree
2 26 (4.58%) Computer Science Degree
3 23 (4.05%) Master's Degree
4 5 (0.88%) PMP
5 4 (0.70%) Security Cleared
6 3 (0.53%) AWS Certification
6 3 (0.53%) Azure Certification
7 2 (0.35%) CCNA
7 2 (0.35%) CCNP
7 2 (0.35%) Cisco Certification
7 2 (0.35%) DV Cleared
7 2 (0.35%) ITIL Foundation Certificate
7 2 (0.35%) PMI Certification
7 2 (0.35%) SC Cleared
8 1 (0.18%) CISSP
8 1 (0.18%) DBS Check
8 1 (0.18%) ITIL Certification
8 1 (0.18%) Microsoft Certification
8 1 (0.18%) Oracle Certification
8 1 (0.18%) SAP Certification
Quality Assurance & Compliance
1 249 (43.84%) QA
2 95 (16.73%) Accessibility
3 21 (3.70%) Data Quality
4 10 (1.76%) ISO/IEC 27001
5 3 (0.53%) SLA
6 2 (0.35%) COBIT
7 1 (0.18%) Cyber Essentials
7 1 (0.18%) NIST
System Software
1 252 (44.37%) Docker
2 21 (3.70%) Active Directory
3 6 (1.06%) Hyper-V
4 1 (0.18%) VMware Infrastructure
Systems Management
1 253 (44.54%) Kubernetes
2 13 (2.29%) Microsoft Intune
3 12 (2.11%) Single Sign-On
4 6 (1.06%) Ansible
5 5 (0.88%) Terraform
6 2 (0.35%) Active Directory Federation Services
7 1 (0.18%) Failover Clustering
Vendors
1 246 (43.31%) Solace
2 29 (5.11%) Microsoft
3 22 (3.87%) Salesforce
4 21 (3.70%) Oracle
4 21 (3.70%) Salesforce Marketing Cloud
5 14 (2.46%) SAP
6 9 (1.58%) IBM
7 6 (1.06%) PayPal
8 5 (0.88%) Google
9 4 (0.70%) ServiceNow
10 3 (0.53%) Cisco
10 3 (0.53%) Dell
10 3 (0.53%) Palo Alto
10 3 (0.53%) SolarWinds
11 2 (0.35%) Apple
11 2 (0.35%) Avaya
11 2 (0.35%) HP
11 2 (0.35%) Hyperion
11 2 (0.35%) JD Edwards
11 2 (0.35%) PeopleSoft