Line Management Jobs

Line Management
UK

The table below provides summary statistics for permanent job vacancies requiring Line Management skills. It includes a benchmarking guide to the annual salaries offered in vacancies that cited Line Management over the 6 months leading up to 9 October 2024, comparing them to the same period in the previous two years.

6 months to
9 Oct 2024
Same period 2023 Same period 2022
Rank 116 140 99
Rank change year-on-year +24 -41 +42
Permanent jobs citing Line Management 1,770 1,498 4,885
As % of all permanent jobs advertised in the UK 2.24% 2.45% 3.39%
As % of the Processes & Methodologies category 2.69% 2.60% 3.53%
Number of salaries quoted 739 982 2,305
10th Percentile £35,000 £36,775 £35,125
25th Percentile £47,500 £47,500 £45,000
Median annual salary (50th Percentile) £65,000 £65,000 £60,000
Median % change year-on-year - +8.33% -
75th Percentile £112,500 £81,250 £77,500
90th Percentile £142,500 £107,375 £97,290
UK excluding London median annual salary £56,000 £57,291 £55,000
% change year-on-year -2.25% +4.16% -

All Process and Methodology Skills
UK

Line Management falls under the Processes and Methodologies category. For comparison with the information above, the following table provides summary statistics for all permanent job vacancies requiring process or methodology skills.

Permanent vacancies with a requirement for process or methodology skills 65,830 57,664 138,578
As % of all permanent jobs advertised in the UK 83.49% 94.50% 96.17%
Number of salaries quoted 32,576 41,209 76,946
10th Percentile £32,500 £32,500 £33,950
25th Percentile £43,750 £45,000 £45,000
Median annual salary (50th Percentile) £59,500 £60,000 £60,000
Median % change year-on-year -0.83% - +4.35%
75th Percentile £77,500 £80,000 £80,000
90th Percentile £96,250 £98,750 £97,500
UK excluding London median annual salary £52,500 £54,000 £52,500
% change year-on-year -2.78% +2.86% +5.00%

Line Management
Job Vacancy Trend

Job postings citing Line Management as a proportion of all IT jobs advertised.
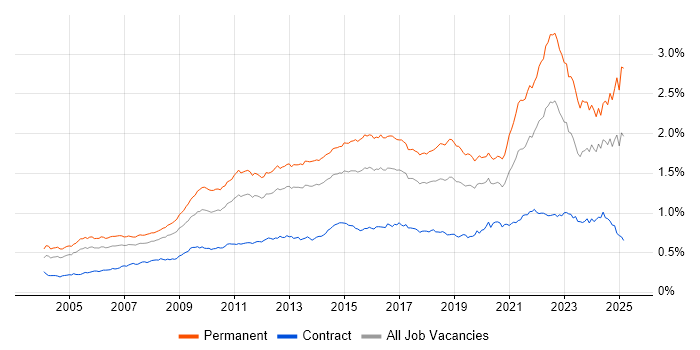
Job vacancy trend for Line Management in the UK

Line Management
Salary Trend

3-month moving average salary quoted in jobs citing Line Management.

Salary trend for Line Management in the UK

Line Management
Salary Histogram

Salary distribution for jobs citing Line Management over the 6 months to 9 October 2024.

Salary histogram for Line Management in the UK

Line Management
Top 17 Job Locations

The table below looks at the demand and provides a guide to the median salaries quoted in IT jobs citing Line Management within the UK over the 6 months to 9 October 2024. The 'Rank Change' column provides an indication of the change in demand within each location based on the same 6 month period last year.

Location Rank Change
on Same Period
Last Year
Matching
Permanent
IT Job Ads
Median Salary
Past 6 Months
Median Salary
% Change
on Same Period
Last Year
Live
Jobs
England +5 1,408 £65,000 - 495
UK excluding London +11 1,200 £56,000 -2.25% 391
Work from Home +33 885 £75,000 +15.38% 164
London +44 495 £105,000 +40.00% 133
North of England +23 293 £56,000 -6.67% 101
Scotland +90 265 £55,000 -7.65% 25
South East -64 207 £48,745 -27.79% 87
Midlands -27 175 £50,000 -9.09% 77
North West +25 171 £56,000 +12.00% 57
South West +1 162 £63,500 +6.62% 46
Yorkshire +19 97 £62,500 -4.36% 26
West Midlands -51 89 £56,891 +11.27% 44
East Midlands +10 86 £45,000 -30.77% 33
East of England -54 54 £27,117 +116.94% 42
Wales +22 35 £60,000 +12.96% 17
North East -28 25 £55,965 -13.90% 18
Northern Ireland +31 12 £59,430 -3.44% 7

Line Management
Co-occurring Skills and Capabilities by Category

The follow tables expand on the table above by listing co-occurrences grouped by category. The same employment type, locality and period is covered with up to 20 co-occurrences shown in each of the following categories:

Application Platforms
1 165 (9.32%) Apache
2 164 (9.27%) Apache Airflow
3 38 (2.15%) Microsoft Exchange
4 33 (1.86%) SharePoint
5 18 (1.02%) CMS
6 11 (0.62%) Confluence
7 4 (0.23%) Umbraco
8 3 (0.17%) Skype for Business
9 2 (0.11%) Office Communications Server
9 2 (0.11%) Oracle Application Server
9 2 (0.11%) Oracle SOA Suite
9 2 (0.11%) Site Server
9 2 (0.11%) WebLogic
9 2 (0.11%) WordPress
10 1 (0.056%) Cloud Foundry
10 1 (0.056%) IIS
10 1 (0.056%) SharePoint 2013
10 1 (0.056%) Sitecore CMS
10 1 (0.056%) Strapi
10 1 (0.056%) Tomcat
Applications
1 119 (6.72%) Microsoft Excel
2 95 (5.37%) Microsoft Office
3 46 (2.60%) Microsoft PowerPoint
4 12 (0.68%) MS Visio
5 8 (0.45%) Photoshop
6 5 (0.28%) EPLAN
7 3 (0.17%) Microsoft Project
8 2 (0.11%) Adobe Creative Suite
9 1 (0.056%) AutoCAD
9 1 (0.056%) EngageOne
9 1 (0.056%) InfoPath
9 1 (0.056%) MadCap Flare
9 1 (0.056%) Simulink
Business Applications
1 16 (0.90%) Dynamics CRM
2 9 (0.51%) SDL Web 8
3 4 (0.23%) NEC Housing
4 3 (0.17%) Elite 3E
4 3 (0.17%) Oracle EBS
4 3 (0.17%) Sage X3
5 2 (0.11%) PlanetPress Connect
5 2 (0.11%) SAP MDM
5 2 (0.11%) SAP PM
5 2 (0.11%) SAP S/4HANA
6 1 (0.056%) Academy Housing
6 1 (0.056%) Dynamics AX
6 1 (0.056%) Dynamics NAV
6 1 (0.056%) Oracle Payables
6 1 (0.056%) Oracle Procure-to-Pay
6 1 (0.056%) Oracle Receivables
6 1 (0.056%) PeopleSoft HCM
6 1 (0.056%) Raiser’s Edge
6 1 (0.056%) SAP ERP
6 1 (0.056%) TIBCO iProcess
Cloud Services
1 282 (15.93%) AWS
2 214 (12.09%) Azure
3 206 (11.64%) GCP
4 200 (11.30%) dbt
5 165 (9.32%) Snowflake
6 101 (5.71%) Microsoft 365
7 79 (4.46%) Power Platform
8 70 (3.95%) Amazon EC2
9 64 (3.62%) SaaS
10 62 (3.50%) Amazon ECS
11 61 (3.45%) Amazon EKS
12 58 (3.28%) Azure DevOps
13 37 (2.09%) Cloud Computing
14 27 (1.53%) Dynamics 365
15 25 (1.41%) Google Sheets
16 22 (1.24%) Google Docs
17 17 (0.96%) Entra ID
18 13 (0.73%) PowerApps
19 12 (0.68%) PaaS
20 11 (0.62%) IaaS
Communications & Networking
1 266 (15.03%) Broadband
2 40 (2.26%) DHCP
2 40 (2.26%) DNS
3 31 (1.75%) Firewall
3 31 (1.75%) Wi-Fi
4 20 (1.13%) Structured Cabling
5 19 (1.07%) Unified Communications
6 18 (1.02%) WAN
7 17 (0.96%) LAN
8 16 (0.90%) SAN
9 15 (0.85%) Internet
10 11 (0.62%) HTTP
10 11 (0.62%) TCP/IP
10 11 (0.62%) VoIP
10 11 (0.62%) VPN
11 9 (0.51%) Wireless
12 8 (0.45%) MPLS
12 8 (0.45%) Network Security
13 6 (0.34%) SD-WAN
13 6 (0.34%) SSL
Database & Business Intelligence
1 165 (9.32%) Data Lake
1 165 (9.32%) Dremio
2 164 (9.27%) Amazon Athena
2 164 (9.27%) Apache Arrow
2 164 (9.27%) Apache Ignite
3 73 (4.12%) SQL Server
4 59 (3.33%) Power BI
5 46 (2.60%) Data Warehouse
6 33 (1.86%) Tableau
7 32 (1.81%) Looker
8 30 (1.69%) BigQuery
9 26 (1.47%) Qlik Sense
9 26 (1.47%) SQL Server Integration Services
10 13 (0.73%) MongoDB
11 12 (0.68%) MySQL
12 11 (0.62%) Metadata
12 11 (0.62%) Relational Database
12 11 (0.62%) SQL Server Reporting Services
13 10 (0.56%) Metadata Repository
13 10 (0.56%) PostgreSQL
Development Applications
1 34 (1.92%) JIRA
2 23 (1.30%) Git
3 13 (0.73%) Rational DOORS
4 10 (0.56%) Visual Studio
5 9 (0.51%) TeamCity
6 8 (0.45%) git-flow
6 8 (0.45%) Moq
6 8 (0.45%) NUnit
6 8 (0.45%) Octopus Deploy
6 8 (0.45%) Sourcetree
6 8 (0.45%) SpecFlow
7 7 (0.40%) Jenkins
8 6 (0.34%) GitLab
9 5 (0.28%) Axure RP
10 4 (0.23%) Cucumber
10 4 (0.23%) Rational Rhapsody
11 3 (0.17%) Rational Statemate
11 3 (0.17%) Selenium
11 3 (0.17%) TestRail
11 3 (0.17%) Zephyr
General
1 764 (43.16%) Social Skills
2 454 (25.65%) Finance
3 419 (23.67%) Inclusion and Diversity
4 262 (14.80%) Telecoms
5 230 (12.99%) Games
6 187 (10.56%) Analytical Skills
7 175 (9.89%) Banking
8 166 (9.38%) Front Office
8 166 (9.38%) Investment Banking
9 157 (8.87%) Retail
10 145 (8.19%) Legal
11 103 (5.82%) Manufacturing
12 89 (5.03%) Pharmaceutical
13 64 (3.62%) Organisational Skills
14 63 (3.56%) Law
15 59 (3.33%) Public Sector
16 54 (3.05%) Marketing
17 39 (2.20%) Influencing Skills
18 32 (1.81%) Billing
19 30 (1.69%) Presentation Skills
Job Titles
1 390 (22.03%) Architect
2 313 (17.68%) Lead
3 246 (13.90%) Principal Architect
4 237 (13.39%) Senior
5 183 (10.34%) Systems Architect
6 179 (10.11%) Developer
7 173 (9.77%) Solutions Architect
8 125 (7.06%) Lead Developer
9 120 (6.78%) Analyst
9 120 (6.78%) Team Leader
10 104 (5.88%) Software Developer
11 102 (5.76%) Project Manager
12 100 (5.65%) Software Engineer
13 97 (5.48%) Lead Software Developer
14 90 (5.08%) Software Team Leader
15 86 (4.86%) Lead Software Engineer
16 82 (4.63%) Developer/Software Engineer
17 75 (4.24%) Senior Data Warehouse Specialist
18 74 (4.18%) QA Specialist
19 66 (3.73%) IT Manager
Libraries, Frameworks & Software Standards
1 164 (9.27%) gRPC
1 164 (9.27%) NumPy
1 164 (9.27%) Pandas
1 164 (9.27%) Protocol Buffers
1 164 (9.27%) SciPy
2 83 (4.69%) .NET
3 66 (3.73%) HTML
4 61 (3.45%) PySpark
5 34 (1.92%) React
6 32 (1.81%) CSS
7 30 (1.69%) .NET Framework
8 28 (1.58%) .NET Core
9 25 (1.41%) Web Services
10 22 (1.24%) AngularJS
10 22 (1.24%) RESTful
11 19 (1.07%) ASP.NET
11 19 (1.07%) Django
11 19 (1.07%) Entity Framework
12 18 (1.02%) Node.js
13 16 (0.90%) XML
Miscellaneous
1 171 (9.66%) Equities
2 166 (9.38%) Foreign Exchange (FX)
3 164 (9.27%) Derivative
3 164 (9.27%) Fixed Income
3 164 (9.27%) Hedge funds
4 79 (4.46%) Management Information System
5 69 (3.90%) Product Ownership
6 51 (2.88%) Self-Motivation
7 44 (2.49%) Onboarding
8 42 (2.37%) Cyberattack
9 26 (1.47%) Video Conferencing
10 25 (1.41%) Social Media
11 23 (1.30%) Data Centre
11 23 (1.30%) Public Cloud
12 22 (1.24%) Cloud Native
12 22 (1.24%) Housing Association
13 17 (0.96%) Driving Licence
13 17 (0.96%) e-Learning
13 17 (0.96%) Virtual Team
14 15 (0.85%) Enterprise Software
Operating Systems
1 80 (4.52%) Windows
2 36 (2.03%) Linux
3 34 (1.92%) Windows Server
4 10 (0.56%) Windows 10
5 9 (0.51%) Red Hat Enterprise Linux
6 7 (0.40%) Unix
7 6 (0.34%) Mac OS
8 5 (0.28%) Android
9 4 (0.23%) Apple iOS
9 4 (0.23%) Windows Vista
10 3 (0.17%) Windows 7
11 2 (0.11%) Debian
11 2 (0.11%) SUSE
11 2 (0.11%) Windows Server 2016
12 1 (0.056%) VMS
12 1 (0.056%) Windows Server 2012
12 1 (0.056%) Windows Server 2019
Processes & Methodologies
1 716 (40.45%) Agile
2 412 (23.28%) Mentoring
3 376 (21.24%) Coaching
4 322 (18.19%) Roadmaps
5 313 (17.68%) Problem-Solving
6 262 (14.80%) Software Engineering
7 254 (14.35%) IT Strategy
8 251 (14.18%) Project Management
9 247 (13.95%) Technology Roadmap
10 239 (13.50%) Scaled Agile Framework
11 235 (13.28%) Technology Strategy
12 233 (13.16%) TOGAF
13 226 (12.77%) Enterprise Architecture
14 225 (12.71%) Architecture Governance
14 225 (12.71%) Release Train
15 197 (11.13%) Continuous Improvement
16 185 (10.45%) Asset Management
17 162 (9.15%) Project Delivery
18 139 (7.85%) DevOps
19 122 (6.89%) Service Management
Programming Languages
1 262 (14.80%) SQL
2 244 (13.79%) Python
3 236 (13.33%) JavaScript
4 211 (11.92%) Java
5 179 (10.11%) TypeScript
6 79 (4.46%) C#
7 38 (2.15%) PowerShell
8 32 (1.81%) C++
9 28 (1.58%) T-SQL
10 27 (1.53%) VBA
11 17 (0.96%) Go
11 17 (0.96%) Ruby
12 11 (0.62%) PL/SQL
13 9 (0.51%) Bicep
14 8 (0.45%) C
14 8 (0.45%) XPath
15 7 (0.40%) R
15 7 (0.40%) Scala
16 5 (0.28%) Bash
17 4 (0.23%) PHP
Qualifications
1 374 (21.13%) Degree
2 121 (6.84%) Security Cleared
3 65 (3.67%) SC Cleared
4 59 (3.33%) DBS Check
5 38 (2.15%) CIPD
5 38 (2.15%) DV Cleared
6 29 (1.64%) CISA
7 26 (1.47%) CCAB
8 21 (1.19%) Microsoft Certification
9 20 (1.13%) RIBA
10 16 (0.90%) HND
11 15 (0.85%) Azure Certification
11 15 (0.85%) BPSS Clearance
12 12 (0.68%) Computer Science Degree
13 11 (0.62%) Cisco Certification
13 11 (0.62%) ITIL Certification
14 10 (0.56%) HNC
15 9 (0.51%) CCNA
15 9 (0.51%) MCSA
16 8 (0.45%) MCSE
Quality Assurance & Compliance
1 191 (10.79%) QA
2 81 (4.58%) GMP
3 32 (1.81%) SLA
4 26 (1.47%) Data Quality
4 26 (1.47%) ITGC
5 25 (1.41%) GDPR
6 20 (1.13%) Accessibility
7 18 (1.02%) ISO/IEC 27001
8 11 (0.62%) Cyber Essentials
9 10 (0.56%) Cyber Essentials PLUS
10 9 (0.51%) PMO
11 8 (0.45%) NCSC
12 7 (0.40%) NIST
13 6 (0.34%) GLP
14 5 (0.28%) Def Stans
14 5 (0.28%) IEC 61508
15 3 (0.17%) COBIT
15 3 (0.17%) ISO 9001
15 3 (0.17%) PCI DSS
16 2 (0.11%) Sarbanes-Oxley
System Software
1 57 (3.22%) Active Directory
2 19 (1.07%) VMware Infrastructure
3 18 (1.02%) Firmware
4 16 (0.90%) Docker
5 10 (0.56%) Hyper-V
6 8 (0.45%) Virtual Servers
7 4 (0.23%) vSphere
8 3 (0.17%) Virtual Machines
9 2 (0.11%) Embedded Firmware
9 2 (0.11%) Virtual Desktop
9 2 (0.11%) VMware Workstation
10 1 (0.056%) pfSense
Systems Management
1 19 (1.07%) Kubernetes
2 13 (0.73%) Terraform
3 10 (0.56%) Ansible
4 9 (0.51%) Puppet
5 6 (0.34%) Microsoft Intune
6 5 (0.28%) SCCM
7 3 (0.17%) WSUS
8 2 (0.11%) Backup Exec
8 2 (0.11%) Data Guard
8 2 (0.11%) EMC NetWorker
8 2 (0.11%) Norton AntiVirus
8 2 (0.11%) Oracle Enterprise Manager
8 2 (0.11%) Oracle RMAN
9 1 (0.056%) cPanel
9 1 (0.056%) HP ALM
9 1 (0.056%) logstash
9 1 (0.056%) Statseeker
Vendors
1 218 (12.32%) Microsoft
2 72 (4.07%) Google
3 60 (3.39%) Bloomberg
3 60 (3.39%) Reuters
4 35 (1.98%) BT
5 29 (1.64%) SAP
6 28 (1.58%) ServiceNow
7 23 (1.30%) VMware
8 21 (1.19%) Cisco
9 13 (0.73%) Adobe
10 12 (0.68%) Oracle
11 9 (0.51%) Facebook
11 9 (0.51%) Salesforce
12 8 (0.45%) Cognizant
12 8 (0.45%) Meraki
13 7 (0.40%) Apple
13 7 (0.40%) Atlassian
13 7 (0.40%) HP
13 7 (0.40%) SolarWinds
14 6 (0.34%) NEC