SQL Developer
UK
The median SQL Developer salary in the UK is £57,500 per year, according to job vacancies posted during the 6 months leading to 4 May 2025.
The table below provides salary benchmarking and summary statistics, comparing them to the same period in the previous two years.
| 6 months to 4 May 2025 |
Same period 2024 | Same period 2023 | |
|---|---|---|---|
| Rank | 553 | 637 | 541 |
| Rank change year-on-year | +84 | -96 | -15 |
| Permanent jobs requiring a SQL Developer | 147 | 273 | 517 |
| As % of all permanent jobs advertised in the UK | 0.28% | 0.28% | 0.50% |
| As % of the Job Titles category | 0.31% | 0.29% | 0.54% |
| Number of salaries quoted | 137 | 240 | 469 |
| 10th Percentile | £28,050 | £34,775 | £36,750 |
| 25th Percentile | £44,000 | £42,375 | £45,000 |
| Median annual salary (50th Percentile) | £57,500 | £55,000 | £57,500 |
| Median % change year-on-year | +4.55% | -4.35% | +4.55% |
| 75th Percentile | £62,500 | £65,000 | £73,750 |
| 90th Percentile | £71,250 | £73,750 | £87,750 |
| UK excluding London median annual salary | £57,500 | £50,000 | £50,000 |
| % change year-on-year | +15.00% | - | - |
All Permanent IT Job Vacancies
UK
For comparison with the information above, the following table provides summary statistics for all permanent IT job vacancies. Most job vacancies include a discernible job title that can be normalized. As such, the figures in the second row provide an indication of the number of permanent jobs in our overall sample.
| Permanent vacancies in the UK with a recognized job title | 47,541 | 93,322 | 94,998 |
| % of permanent jobs with a recognized job title | 90.35% | 94.63% | 91.54% |
| Number of salaries quoted | 27,467 | 66,921 | 59,760 |
| 10th Percentile | £30,000 | £28,500 | £32,500 |
| 25th Percentile | £42,000 | £38,500 | £45,000 |
| Median annual salary (50th Percentile) | £57,500 | £52,550 | £60,000 |
| Median % change year-on-year | +9.42% | -12.42% | - |
| 75th Percentile | £75,000 | £71,250 | £81,250 |
| 90th Percentile | £97,500 | £90,000 | £100,000 |
| UK excluding London median annual salary | £52,000 | £50,000 | £53,000 |
| % change year-on-year | +4.00% | -5.66% | +6.00% |
SQL Developer
Job Vacancy Trend
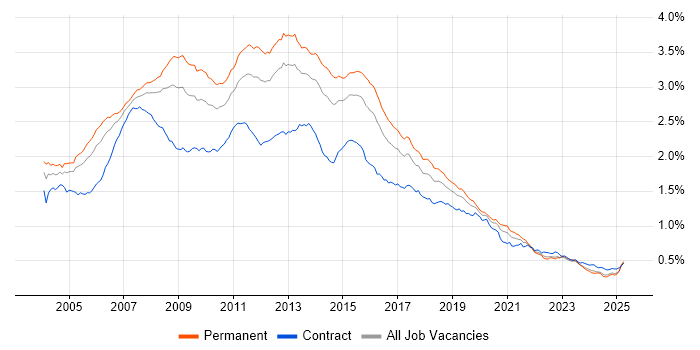
Job postings that featured SQL Developer in the job title as a proportion of all IT jobs advertised.

SQL Developer
Salary Trend
3-month moving average salary quoted in jobs citing SQL Developer.
SQL Developer
Salary Histogram
Salary distribution for jobs citing SQL Developer over the 6 months to 4 May 2025.
SQL Developer
Top 16 Job Locations
The table below looks at the demand and provides a guide to the median salaries quoted in IT jobs citing SQL Developer within the UK over the 6 months to 4 May 2025. The 'Rank Change' column provides an indication of the change in demand within each location based on the same 6 month period last year.
| Location | Rank Change on Same Period Last Year |
Matching Permanent IT Job Ads |
Median Salary Past 6 Months |
Median Salary % Change on Same Period Last Year |
Live Jobs |
|---|---|---|---|---|---|
| England | +66 | 140 | £57,500 | +4.55% | 51 |
| UK excluding London | +148 | 126 | £57,500 | +15.00% | 33 |
| Work from Home | +106 | 73 | £53,688 | -10.52% | 30 |
| North of England | +61 | 52 | £60,000 | +26.32% | 10 |
| Yorkshire | +92 | 33 | £60,000 | +9.09% | 3 |
| Midlands | +54 | 33 | £50,000 | +2.56% | 9 |
| West Midlands | +62 | 26 | £47,500 | +5.56% | 8 |
| South East | +89 | 19 | £67,500 | +22.73% | 4 |
| London | +45 | 18 | £67,500 | +3.85% | 22 |
| North West | -4 | 14 | £57,500 | +27.78% | 5 |
| East of England | +45 | 13 | £30,500 | -6.15% | 2 |
| East Midlands | +26 | 7 | £52,500 | -4.55% | |
| South West | +110 | 5 | £50,000 | -9.09% | 6 |
| North East | +52 | 5 | £57,500 | - | 2 |
| Scotland | +126 | 2 | £50,000 | -7.41% | 2 |
| Northern Ireland | - | 2 | £69,000 | - | 1 |
SQL Developer Skill Set
Top 30 Co-occurring Skills and Capabilities
For the 6 months to 4 May 2025, SQL Developer job roles required the following skills and capabilities in order of popularity. The figures indicate the absolute number co-occurrences and as a proportion of all permanent job ads featuring SQL Developer in the job title.
|
|
SQL Developer Skill Set
Co-occurring Skills and Capabilities by Category
The follow tables expand on the table above by listing co-occurrences grouped by category. The same employment type, locality and period is covered with up to 20 co-occurrences shown in each of the following categories:
|
|
||||||||||||||||||||||||||||||||||||||||||||||||||||||||||||||||||||||||||||||||||||||||||||||||
|
|
||||||||||||||||||||||||||||||||||||||||||||||||||||||||||||||||||||||||||||||||||||||||||||||||
|
|
||||||||||||||||||||||||||||||||||||||||||||||||||||||||||||||||||||||||||||||||||||||||||||||||
|
|
||||||||||||||||||||||||||||||||||||||||||||||||||||||||||||||||||||||||||||||||||||||||||||||||
|
|
||||||||||||||||||||||||||||||||||||||||||||||||||||||||||||||||||||||||||||||||||||||||||||||||
|
|
||||||||||||||||||||||||||||||||||||||||||||||||||||||||||||||||||||||||||||||||||||||||||||||||
|
|
||||||||||||||||||||||||||||||||||||||||||||||||||||||||||||||||||||||||||||||||||||||||||||||||
|
|
||||||||||||||||||||||||||||||||||||||||||||||||||||||||||||||||||||||||||||||||||||||||||||||||
|
|
||||||||||||||||||||||||||||||||||||||||||||||||||||||||||||||||||||||||||||||||||||||||||||||||
