Wealth Management Jobs

Wealth Management
UK

The table below provides summary statistics for permanent job vacancies requiring Wealth Management skills. It includes a benchmarking guide to the annual salaries offered in vacancies that cited Wealth Management over the 6 months leading up to 26 July 2024, comparing them to the same period in the previous two years.

6 months to
26 Jul 2024
Same period 2023 Same period 2022
Rank 589 420 642
Rank change year-on-year -169 +222 +66
Permanent jobs citing Wealth Management 262 589 794
As % of all permanent jobs advertised in the UK 0.29% 0.73% 0.45%
As % of the Processes & Methodologies category 0.35% 0.77% 0.47%
Number of salaries quoted 112 441 414
10th Percentile £41,250 £41,250 £40,375
25th Percentile £53,750 £52,500 £52,500
Median annual salary (50th Percentile) £70,000 £65,000 £67,500
Median % change year-on-year +7.69% -3.70% +12.50%
75th Percentile £89,063 £87,500 £85,000
90th Percentile £110,000 £112,500 £95,000
UK excluding London median annual salary £67,500 £65,000 £60,000
% change year-on-year +3.85% +8.33% +1.69%

All Process and Methodology Skills
UK

Wealth Management falls under the Processes and Methodologies category. For comparison with the information above, the following table provides summary statistics for all permanent job vacancies requiring process or methodology skills.

Permanent vacancies with a requirement for process or methodology skills 73,969 76,929 168,958
As % of all permanent jobs advertised in the UK 81.84% 95.34% 96.40%
Number of salaries quoted 48,628 50,249 85,709
10th Percentile £30,000 £33,750 £33,750
25th Percentile £40,000 £45,000 £44,250
Median annual salary (50th Percentile) £55,000 £60,000 £60,000
Median % change year-on-year -8.33% - +9.09%
75th Percentile £73,750 £80,000 £80,000
90th Percentile £93,750 £100,000 £96,250
UK excluding London median annual salary £50,000 £55,000 £52,500
% change year-on-year -9.09% +4.76% +6.06%

Wealth Management
Job Vacancy Trend

Job postings citing Wealth Management as a proportion of all IT jobs advertised.
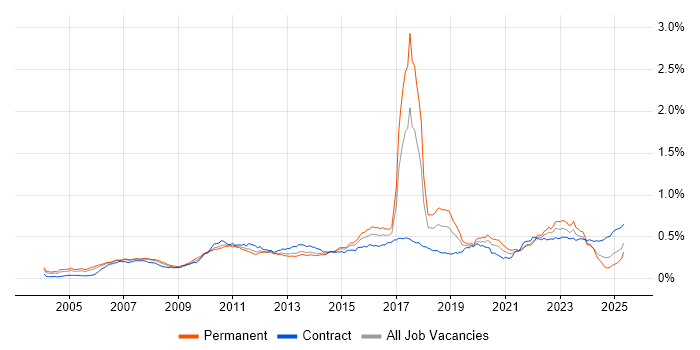
Job vacancy trend for Wealth Management in the UK

Wealth Management
Salary Trend

3-month moving average salary quoted in jobs citing Wealth Management.

Salary trend for Wealth Management in the UK

Wealth Management
Salary Histogram

Salary distribution for jobs citing Wealth Management over the 6 months to 26 July 2024.

Salary histogram for Wealth Management in the UK

Wealth Management
Top 15 Job Locations

The table below looks at the demand and provides a guide to the median salaries quoted in IT jobs citing Wealth Management within the UK over the 6 months to 26 July 2024. The 'Rank Change' column provides an indication of the change in demand within each location based on the same 6 month period last year.

Location Rank Change
on Same Period
Last Year
Matching
Permanent
IT Job Ads
Median Salary
Past 6 Months
Median Salary
% Change
on Same Period
Last Year
Live
Jobs
UK excluding London -146 180 £67,500 +3.85% 31
England -253 157 £70,000 +7.69% 38
Scotland +30 95 £85,000 +30.77% 4
London -59 81 £81,250 +20.37% 22
Work from Home -79 69 £67,500 +3.85% 22
South East -95 49 £67,500 -3.57% 13
South West -13 12 £50,000 -20.00% 2
North West -16 9 £85,000 +78.95% 5
North of England -71 9 £85,000 +61.90% 6
Isle of Man -8 5 £82,500 +37.50%
Northern Ireland +23 4 £56,250 - 3
East of England -4 3 £67,500 +20.00% 1
Midlands -65 3 £42,500 -22.73% 2
West Midlands -11 2 £35,000 - 2
East Midlands -64 1 £50,000 -9.09%

Wealth Management
Co-occurring Skills and Capabilities by Category

The follow tables expand on the table above by listing co-occurrences grouped by category. The same employment type, locality and period is covered with up to 20 co-occurrences shown in each of the following categories:

Application Platforms
1 30 (11.45%) Apache Spark
2 9 (3.44%) SharePoint
3 3 (1.15%) Confluence
4 1 (0.38%) Adobe Experience Manager
4 1 (0.38%) Apache
4 1 (0.38%) Apache Airflow
4 1 (0.38%) Apache Pulsar
4 1 (0.38%) JBoss
4 1 (0.38%) Microsoft Exchange
4 1 (0.38%) Oracle SOA Suite
4 1 (0.38%) Umbraco
Applications
1 6 (2.29%) Microsoft Office
2 1 (0.38%) Microsoft Excel
2 1 (0.38%) Microsoft PowerPoint
Business Applications
1 3 (1.15%) Dynamics CRM
Cloud Services
1 91 (34.73%) AWS
2 47 (17.94%) Azure
3 23 (8.78%) Microsoft 365
4 8 (3.05%) GCP
5 6 (2.29%) BlazeMeter
6 5 (1.91%) Power Platform
6 5 (1.91%) SaaS
7 4 (1.53%) Salesforce Service Cloud
8 3 (1.15%) AWS CloudFormation
8 3 (1.15%) Azure Data Factory
8 3 (1.15%) Azure DevOps
8 3 (1.15%) Cloud Computing
8 3 (1.15%) Dynamics 365
8 3 (1.15%) OneDrive
8 3 (1.15%) Salesforce Sales Cloud
8 3 (1.15%) Snowflake
9 2 (0.76%) Amazon EKS
9 2 (0.76%) AWS KMS
9 2 (0.76%) Azure Monitor
9 2 (0.76%) Azure Synapse Analytics
Communications & Networking
1 9 (3.44%) Firewall
2 6 (2.29%) Cisco ASA
2 6 (2.29%) VPN
3 4 (1.53%) DNS
4 3 (1.15%) Wi-Fi
5 2 (0.76%) Asterisk PBX
5 2 (0.76%) Intranet
5 2 (0.76%) Network Security
5 2 (0.76%) Unified Communications
5 2 (0.76%) VoIP
6 1 (0.38%) DHCP
6 1 (0.38%) Intrusion Detection
6 1 (0.38%) LAN
6 1 (0.38%) TCP/IP
6 1 (0.38%) WAN
Database & Business Intelligence
1 36 (13.74%) NoSQL
2 29 (11.07%) Apache Hive
2 29 (11.07%) Big Data
2 29 (11.07%) HBase
3 12 (4.58%) MongoDB
3 12 (4.58%) SQL Server
4 6 (2.29%) Apache Cassandra
4 6 (2.29%) SQL Server Integration Services
5 5 (1.91%) Elasticsearch
5 5 (1.91%) Power BI
6 4 (1.53%) Spark SQL
6 4 (1.53%) Tableau
7 3 (1.15%) Data Warehouse
8 2 (0.76%) Azure SQL Database
8 2 (0.76%) Data Lake
8 2 (0.76%) Relational Database
9 1 (0.38%) Amazon Athena
9 1 (0.38%) Amazon Redshift
9 1 (0.38%) Delta Lake
9 1 (0.38%) Semantic Layer
Development Applications
1 48 (18.32%) Git
2 34 (12.98%) Jenkins
3 29 (11.07%) Bitbucket Server
4 12 (4.58%) JUnit
5 4 (1.53%) JIRA
5 4 (1.53%) Maven
6 1 (0.38%) Ant
6 1 (0.38%) Eclipse
6 1 (0.38%) IntelliJ
6 1 (0.38%) Mercurial
6 1 (0.38%) SonarQube
6 1 (0.38%) Team Foundation Server
6 1 (0.38%) Visual Studio Code
General
1 233 (88.93%) Finance
2 130 (49.62%) Inclusion and Diversity
3 87 (33.21%) Social Skills
4 82 (31.30%) Law
5 70 (26.72%) Marketing
6 39 (14.89%) Banking
7 34 (12.98%) Legal
8 30 (11.45%) Analytical Skills
9 25 (9.54%) Billing
10 12 (4.58%) Investment Banking
11 11 (4.20%) Private Banking
12 7 (2.67%) Organisational Skills
13 5 (1.91%) Retail
14 4 (1.53%) Financial Institution
15 3 (1.15%) Automotive
15 3 (1.15%) Back Office
15 3 (1.15%) Brand Awareness
15 3 (1.15%) Documentation Skills
15 3 (1.15%) Manufacturing
16 2 (0.76%) Retail Banking
Job Titles
1 41 (15.65%) Software Engineer
2 37 (14.12%) Audit Manager
2 37 (14.12%) Data Engineer
3 35 (13.36%) Architect
3 35 (13.36%) Senior
4 30 (11.45%) AWS Engineer
5 29 (11.07%) AWS Software Engineer
5 29 (11.07%) Big Data Engineer
5 29 (11.07%) Big Data Software Engineer
6 24 (9.16%) Software Engineering Director
7 17 (6.49%) Lead
8 16 (6.11%) Developer
9 13 (4.96%) Cloud Architect
10 12 (4.58%) Cloud Solutions Architect
10 12 (4.58%) Principal Architect
10 12 (4.58%) Principal Solutions Architect
11 10 (3.82%) Analyst
12 9 (3.44%) Java Engineer
12 9 (3.44%) Java Software Engineer
13 8 (3.05%) Senior Architect
Libraries, Frameworks & Software Standards
1 25 (9.54%) .NET
2 21 (8.02%) .NET Core
2 21 (8.02%) .NET Framework
3 15 (5.73%) SignalR
3 15 (5.73%) WCF
3 15 (5.73%) WF
4 14 (5.34%) React
5 11 (4.20%) AngularJS
6 10 (3.82%) Kafka
6 10 (3.82%) Spring
7 7 (2.67%) Node.js
8 6 (2.29%) Entity Framework
8 6 (2.29%) LDAP
8 6 (2.29%) OAuth
8 6 (2.29%) SAML
9 5 (1.91%) ASP.NET
9 5 (1.91%) ASP.NET MVC
9 5 (1.91%) ASP.NET Web API
9 5 (1.91%) PySpark
9 5 (1.91%) Vue
Miscellaneous
1 37 (14.12%) Cloud Native
2 31 (11.83%) Algorithms
3 7 (2.67%) Public Cloud
4 6 (2.29%) Greenfield Project
5 5 (1.91%) Data Centre
5 5 (1.91%) Hedge funds
6 4 (1.53%) Self-Motivation
7 3 (1.15%) PKI
7 3 (1.15%) Product Ownership
8 2 (0.76%) Linux Command Line
8 2 (0.76%) Security Posture
9 1 (0.38%) Data Protection Act
9 1 (0.38%) Enterprise Software
9 1 (0.38%) Low-Code
9 1 (0.38%) Management Information System
9 1 (0.38%) Mobile App
9 1 (0.38%) Onboarding
9 1 (0.38%) Reference Data
9 1 (0.38%) Virtual Team
Operating Systems
1 30 (11.45%) Unix
2 20 (7.63%) Windows
3 13 (4.96%) Linux
4 6 (2.29%) Red Hat Enterprise Linux
5 4 (1.53%) Android
6 2 (0.76%) Windows 10
6 2 (0.76%) Windows Server
7 1 (0.38%) Apple iOS
7 1 (0.38%) Solaris
7 1 (0.38%) VMS
Processes & Methodologies
1 90 (34.35%) Agile
2 82 (31.30%) Machine Learning
2 82 (31.30%) Software Engineering
3 81 (30.92%) Artificial Intelligence
4 62 (23.66%) Visualisation
5 52 (19.85%) Problem-Solving
6 51 (19.47%) TDD
7 50 (19.08%) Operational Stability
8 48 (18.32%) Decision-Making
9 42 (16.03%) CI/CD
10 40 (15.27%) Asset Management
11 39 (14.89%) SDLC
12 38 (14.50%) Test Automation
13 37 (14.12%) Continuous Improvement
14 35 (13.36%) Community of Practice
15 30 (11.45%) Open Source
15 30 (11.45%) Risk Management
16 29 (11.07%) Batch Processing
16 29 (11.07%) Computer Science
17 28 (10.69%) Business Development
Programming Languages
1 68 (25.95%) SQL
2 57 (21.76%) Python
3 31 (11.83%) PL/SQL
4 22 (8.40%) Java
5 21 (8.02%) C#
6 17 (6.49%) JavaScript
7 10 (3.82%) TypeScript
8 8 (3.05%) T-SQL
9 7 (2.67%) Bash
10 6 (2.29%) Perl
11 5 (1.91%) PowerShell
12 4 (1.53%) Kotlin
12 4 (1.53%) R
13 2 (0.76%) Apex Code
13 2 (0.76%) Go
Qualifications
1 46 (17.56%) ACCA
2 16 (6.11%) Degree
3 9 (3.44%) CISM
3 9 (3.44%) CISSP
4 6 (2.29%) AWS Certified Cloud Practitioner
5 3 (1.15%) CRISC
5 3 (1.15%) GIAC
5 3 (1.15%) ISSMP
5 3 (1.15%) ITIL Certification
6 2 (0.76%) AWS Certification
6 2 (0.76%) Computer Science Degree
6 2 (0.76%) Numerate Degree
7 1 (0.38%) Azure Certification
7 1 (0.38%) Master's Degree
Quality Assurance & Compliance
1 15 (5.73%) IFRS
2 6 (2.29%) NIST
3 4 (1.53%) Data Quality
3 4 (1.53%) GDPR
4 3 (1.15%) COBIT
5 2 (0.76%) SLA
6 1 (0.38%) QA
System Software
1 29 (11.07%) HDFS
2 7 (2.67%) Active Directory
2 7 (2.67%) Docker
3 3 (1.15%) VMware Infrastructure
4 2 (0.76%) Hyper-V
Systems Management
1 38 (14.50%) Terraform
2 20 (7.63%) Kubernetes
3 10 (3.82%) Ansible
4 6 (2.29%) Grafana
4 6 (2.29%) Single Sign-On
5 4 (1.53%) Puppet
6 2 (0.76%) Microsoft Intune
6 2 (0.76%) SCOM
7 1 (0.38%) Hadoop YARN
7 1 (0.38%) Progress Chef
7 1 (0.38%) SCCM
Vendors
1 46 (17.56%) CA
2 34 (12.98%) Databricks
3 30 (11.45%) Microsoft
4 29 (11.07%) Informatica
5 8 (3.05%) VMware
6 7 (2.67%) Citrix
6 7 (2.67%) Red Hat
7 6 (2.29%) Cisco
7 6 (2.29%) Dynatrace
7 6 (2.29%) Fortinet
7 6 (2.29%) Palo Alto
7 6 (2.29%) Splunk
8 5 (1.91%) Google
9 4 (1.53%) Avaloq
9 4 (1.53%) Salesforce
10 3 (1.15%) Alibaba
10 3 (1.15%) Alteryx
11 2 (0.76%) ServiceNow
11 2 (0.76%) Veeam
12 1 (0.38%) Adobe