Critical Thinking Jobs

Critical Thinking
UK

The table below provides summary statistics for permanent job vacancies requiring Critical Thinking skills. It includes a benchmarking guide to the annual salaries offered in vacancies that cited Critical Thinking over the 6 months leading up to 26 October 2024, comparing them to the same period in the previous two years.

6 months to
26 Oct 2024
Same period 2023 Same period 2022
Rank 474 288 394
Rank change year-on-year -186 +106 +119
Permanent jobs citing Critical Thinking 338 673 1,253
As % of all permanent jobs advertised in the UK 0.44% 1.15% 0.89%
As % of the Processes & Methodologies category 0.53% 1.21% 0.92%
Number of salaries quoted 157 257 494
10th Percentile £33,750 £32,650 £35,000
25th Percentile £42,500 £46,000 £45,250
Median annual salary (50th Percentile) £59,430 £62,500 £60,000
Median % change year-on-year -4.91% +4.17% -
75th Percentile £75,000 £82,500 £78,750
90th Percentile £82,500 £87,600 £97,290
UK excluding London median annual salary £55,000 £52,500 £57,500
% change year-on-year +4.76% -8.70% +17.95%

All Process and Methodology Skills
UK

Critical Thinking falls under the Processes and Methodologies category. For comparison with the information above, the following table provides summary statistics for all permanent job vacancies requiring process or methodology skills.

Permanent vacancies with a requirement for process or methodology skills 63,908 55,391 135,614
As % of all permanent jobs advertised in the UK 84.07% 94.35% 96.13%
Number of salaries quoted 30,608 39,736 76,629
10th Percentile £34,000 £32,500 £34,000
25th Percentile £45,000 £44,497 £45,000
Median annual salary (50th Percentile) £60,000 £60,000 £60,000
Median % change year-on-year - - +4.35%
75th Percentile £77,500 £80,000 £81,000
90th Percentile £97,250 £97,500 £98,750
UK excluding London median annual salary £54,125 £52,500 £52,500
% change year-on-year +3.10% - +5.00%

Critical Thinking
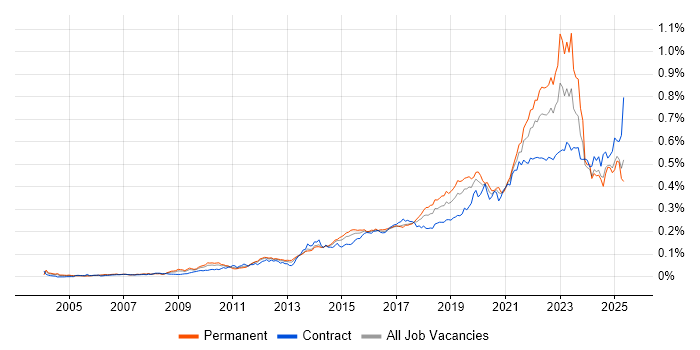
Job Vacancy Trend

Job postings citing Critical Thinking as a proportion of all IT jobs advertised.

Job vacancy trend for Critical Thinking in the UK

Critical Thinking
Salary Trend

3-month moving average salary quoted in jobs citing Critical Thinking.

Salary trend for Critical Thinking in the UK

Critical Thinking
Salary Histogram

Salary distribution for jobs citing Critical Thinking over the 6 months to 26 October 2024.

Salary histogram for Critical Thinking in the UK

Critical Thinking
Top 17 Job Locations

The table below looks at the demand and provides a guide to the median salaries quoted in IT jobs citing Critical Thinking within the UK over the 6 months to 26 October 2024. The 'Rank Change' column provides an indication of the change in demand within each location based on the same 6 month period last year.

Location Rank Change
on Same Period
Last Year
Matching
Permanent
IT Job Ads
Median Salary
Past 6 Months
Median Salary
% Change
on Same Period
Last Year
Live
Jobs
England -210 296 £55,000 -12.00% 203
UK excluding London -190 205 £55,000 +4.76% 151
Work from Home +31 150 £59,430 -1.36% 202
London -61 101 £62,500 -10.71% 66
South East -61 56 £50,000 -9.09% 31
South West -4 53 £70,000 -1.69% 23
Midlands -65 37 £42,500 -15.00% 36
North of England -107 37 £50,000 +5.26% 36
North West -72 24 £59,430 +13.20% 18
West Midlands -54 23 £51,250 +2.50% 17
East Midlands -30 14 £39,500 -41.48% 19
Scotland -25 9 £42,500 -3.48% 13
North East -45 8 £47,148 +45.07% 3
East of England -64 7 £67,500 - 11
Yorkshire -25 5 £46,000 -20.04% 15
Northern Ireland +26 3 £60,000 -25.00% 1
Wales +15 3 £57,215 +70.79% 3

Critical Thinking
Co-occurring Skills and Capabilities by Category

The follow tables expand on the table above by listing co-occurrences grouped by category. The same employment type, locality and period is covered with up to 20 co-occurrences shown in each of the following categories:

Application Platforms
1 25 (7.40%) SharePoint
2 16 (4.73%) Microsoft Exchange
3 13 (3.85%) nginx
4 6 (1.78%) Confluence
5 4 (1.18%) Apache Airflow
5 4 (1.18%) ArcGIS
6 3 (0.89%) Apache Spark
6 3 (0.89%) Luigi
7 2 (0.59%) CMS
8 1 (0.30%) Apache
8 1 (0.30%) Exchange Server 2013
8 1 (0.30%) Jupyter
Applications
1 38 (11.24%) Microsoft Excel
2 16 (4.73%) Microsoft Office
3 6 (1.78%) Microsoft Project
4 5 (1.48%) MS Visio
5 4 (1.18%) Microsoft PowerPoint
6 1 (0.30%) Adobe XD
6 1 (0.30%) InVision
6 1 (0.30%) Sketch
Business Applications
1 13 (3.85%) Dynamics CRM
2 9 (2.66%) Dynamics AX
3 3 (0.89%) Maximo
4 2 (0.59%) SAP S/4HANA
5 1 (0.30%) Oracle General Ledger
5 1 (0.30%) Oracle Subledger Accounting
5 1 (0.30%) ReMetrica
5 1 (0.30%) SimCorp Dimension
Cloud Services
1 103 (30.47%) Azure
2 49 (14.50%) Power Platform
3 40 (11.83%) Azure DevOps
4 36 (10.65%) AWS
5 26 (7.69%) Dynamics 365
5 26 (7.69%) GCP
6 18 (5.33%) Microsoft 365
7 14 (4.14%) Amazon S3
8 13 (3.85%) Azure Monitor
8 13 (3.85%) MinIO
9 12 (3.55%) Azure Synapse Analytics
9 12 (3.55%) Cloud Computing
9 12 (3.55%) Snowflake
10 11 (3.25%) Azure API Management
10 11 (3.25%) Entra ID
11 10 (2.96%) GitHub
12 9 (2.66%) Azure Data Factory
12 9 (2.66%) GitHub Actions
13 7 (2.07%) SaaS
14 6 (1.78%) PaaS
Communications & Networking
1 11 (3.25%) Firewall
2 8 (2.37%) DNS
3 7 (2.07%) DHCP
4 6 (1.78%) LAN
4 6 (1.78%) Remote Desktop
4 6 (1.78%) WAN
4 6 (1.78%) Wi-Fi
5 5 (1.48%) BGP
5 5 (1.48%) Network Security
5 5 (1.48%) VPN
6 4 (1.18%) Cisco ISE
6 4 (1.18%) OSPF
7 3 (0.89%) EIGRP
7 3 (0.89%) Intrusion Detection
7 3 (0.89%) MPLS
7 3 (0.89%) SD-WAN
8 2 (0.59%) AMQP
8 2 (0.59%) Internet
8 2 (0.59%) Skype
8 2 (0.59%) Wireless
Database & Business Intelligence
1 37 (10.95%) Data Warehouse
2 27 (7.99%) Power BI
3 22 (6.51%) Tableau
4 16 (4.73%) Qlik Sense
5 14 (4.14%) Azure SQL Database
5 14 (4.14%) Big Data
6 9 (2.66%) Data Lake
7 8 (2.37%) SQL Server
8 7 (2.07%) Amazon Redshift
8 7 (2.07%) NoSQL
9 5 (1.48%) DB2
9 5 (1.48%) Enterprise Data Warehouse
9 5 (1.48%) PostgreSQL
10 4 (1.18%) RDBMS
10 4 (1.18%) Relational Database
11 3 (0.89%) Apache Hive
11 3 (0.89%) BigQuery
11 3 (0.89%) Hadoop
11 3 (0.89%) Metadata
12 2 (0.59%) SAP HANA
Development Applications
1 33 (9.76%) Git
2 16 (4.73%) Subversion
3 15 (4.44%) Team Foundation Server
4 14 (4.14%) Visual Studio
5 12 (3.55%) JIRA
6 10 (2.96%) Artifactory
6 10 (2.96%) Selenium
6 10 (2.96%) SonarQube
7 6 (1.78%) Jenkins
8 5 (1.48%) Visual Studio Code
9 2 (0.59%) JUnit
10 1 (0.30%) Axure RP
10 1 (0.30%) GitLab
10 1 (0.30%) Octopus Deploy
10 1 (0.30%) Rational Performance Tester
10 1 (0.30%) TeamCity
10 1 (0.30%) XCTest
General
1 164 (48.52%) Social Skills
2 162 (47.93%) Analytical Skills
3 101 (29.88%) Finance
4 43 (12.72%) Retail
5 42 (12.43%) Law
6 39 (11.54%) Legal
6 39 (11.54%) Organisational Skills
7 25 (7.40%) Inclusion and Diversity
8 18 (5.33%) Games
9 13 (3.85%) Japanese Language
10 12 (3.55%) Influencing Skills
10 12 (3.55%) Marketing
11 11 (3.25%) Banking
12 10 (2.96%) Automotive
12 10 (2.96%) Public Sector
13 9 (2.66%) Pharmaceutical
14 8 (2.37%) Documentation Skills
14 8 (2.37%) Presentation Skills
15 7 (2.07%) Local Government
16 6 (1.78%) Telecoms
Job Titles
1 97 (28.70%) Analyst
2 59 (17.46%) Architect
3 47 (13.91%) Senior
4 34 (10.06%) Lead
5 29 (8.58%) Financial Analyst
6 28 (8.28%) Governance Analyst
6 28 (8.28%) Risk Analyst
7 25 (7.40%) Solutions Architect
8 22 (6.51%) Consultant
9 16 (4.73%) Technical Architect
10 13 (3.85%) Azure Engineer
10 13 (3.85%) Compliance Analyst
10 13 (3.85%) Monitoring Analyst
10 13 (3.85%) Software Engineer
11 12 (3.55%) Data Engineer
11 12 (3.55%) Dynamics 365 Analyst
11 12 (3.55%) Dynamics 365 Architect
11 12 (3.55%) Dynamics 365 Solution Architect
11 12 (3.55%) Senior Analyst
11 12 (3.55%) Systems Analyst
Libraries, Frameworks & Software Standards
1 22 (6.51%) HTML
2 20 (5.92%) CSS
3 17 (5.03%) React
4 15 (4.44%) .NET
4 15 (4.44%) XML
5 14 (4.14%) AngularJS
6 13 (3.85%) Middleware
6 13 (3.85%) REST
6 13 (3.85%) WebSockets
7 9 (2.66%) ADO
8 7 (2.07%) Loki
9 5 (1.48%) DHTML
9 5 (1.48%) J2EE
9 5 (1.48%) JDBC
9 5 (1.48%) JSON
9 5 (1.48%) JSP
9 5 (1.48%) Servlets
9 5 (1.48%) YAML
10 4 (1.18%) Elastic Stack
10 4 (1.18%) RabbitMQ
Miscellaneous
1 27 (7.99%) Product Ownership
2 21 (6.21%) Analytical Mindset
3 20 (5.92%) Public Cloud
4 19 (5.62%) Management Information System
5 16 (4.73%) Cloud Native
5 16 (4.73%) Data Structures
5 16 (4.73%) Self-Motivation
6 15 (4.44%) Data Centre
6 15 (4.44%) Onboarding
7 13 (3.85%) Mobile Games
8 10 (2.96%) Cyber Threat
9 6 (1.78%) Operational Technology
10 3 (0.89%) Distributed Systems
10 3 (0.89%) Driving Licence
10 3 (0.89%) Enterprise Software
10 3 (0.89%) NHS
10 3 (0.89%) PKI
11 2 (0.59%) Algorithms
11 2 (0.59%) CCTV
11 2 (0.59%) Social Media
Operating Systems
1 19 (5.62%) Windows
2 18 (5.33%) Linux
3 13 (3.85%) Windows Server
4 11 (3.25%) Unix
5 7 (2.07%) VMS
6 6 (1.78%) Apple iOS
7 5 (1.48%) Android
8 4 (1.18%) Windows Server 2012
9 3 (0.89%) Windows 10
Processes & Methodologies
1 157 (46.45%) Problem-Solving
2 95 (28.11%) Agile
3 63 (18.64%) Decision-Making
4 55 (16.27%) Analytical Thinking
5 52 (15.38%) Analytics
5 52 (15.38%) Customer Experience
6 49 (14.50%) Roadmaps
7 48 (14.20%) DevOps
8 46 (13.61%) CI/CD
8 46 (13.61%) Data Analysis
8 46 (13.61%) Mentoring
9 44 (13.02%) Coaching
9 44 (13.02%) Continuous Improvement
10 43 (12.72%) Infrastructure as Code
11 42 (12.43%) Data Modelling
11 42 (12.43%) Project Management
12 41 (12.13%) Software Engineering
12 41 (12.13%) Stakeholder Management
13 35 (10.36%) Risk Management
14 33 (9.76%) Stakeholder Engagement
Programming Languages
1 79 (23.37%) Python
2 60 (17.75%) SQL
3 30 (8.88%) C#
4 26 (7.69%) JavaScript
5 24 (7.10%) PowerShell
6 19 (5.62%) R
7 16 (4.73%) Bash
7 16 (4.73%) Julia
8 15 (4.44%) TypeScript
9 9 (2.66%) Java
10 6 (1.78%) VBA
11 5 (1.48%) C++
12 4 (1.18%) Perl
13 3 (0.89%) PL/SQL
14 2 (0.59%) Go
14 2 (0.59%) Shell Script
15 1 (0.30%) Bicep
15 1 (0.30%) Clipper
15 1 (0.30%) Objective-C
15 1 (0.30%) Swift
Qualifications
1 111 (32.84%) Degree
2 32 (9.47%) Microsoft Certification
3 31 (9.17%) Security Cleared
4 22 (6.51%) Azure Certification
5 20 (5.92%) Computer Science Degree
5 20 (5.92%) SC Cleared
6 15 (4.44%) Master's Degree
7 8 (2.37%) HND
7 8 (2.37%) MBA
8 7 (2.07%) DV Cleared
8 7 (2.07%) ITIL Foundation Certificate
8 7 (2.07%) PMI Certification
9 6 (1.78%) BPSS Clearance
9 6 (1.78%) PMP
10 3 (0.89%) CBAP
10 3 (0.89%) ISTQB
10 3 (0.89%) MCSE
11 2 (0.59%) CompTIA Security+
11 2 (0.59%) Numerate Degree
11 2 (0.59%) SANS
Quality Assurance & Compliance
1 35 (10.36%) QA
2 30 (8.88%) Data Quality
3 25 (7.40%) ISO/IEC 27001
4 17 (5.03%) Cyber Essentials
4 17 (5.03%) GDPR
5 14 (4.14%) Accessibility
6 10 (2.96%) Solvency II
7 9 (2.66%) Cyber Essentials PLUS
7 9 (2.66%) PCI DSS
8 8 (2.37%) GLP
9 7 (2.07%) ISO 9001
10 6 (1.78%) SLA
11 3 (0.89%) ISO 20022
11 3 (0.89%) NIST
12 1 (0.30%) GAAP
12 1 (0.30%) IFRS
12 1 (0.30%) PMBOK
System Software
1 25 (7.40%) Active Directory
2 7 (2.07%) Docker
2 7 (2.07%) Hyper-V
3 6 (1.78%) vSphere
4 4 (1.18%) Lustre
4 4 (1.18%) Slurm Workload Manager
5 3 (0.89%) HDFS
5 3 (0.89%) VMware Infrastructure
6 1 (0.30%) Virtual Machines
Systems Management
1 30 (8.88%) Terraform
2 28 (8.28%) Kubernetes
3 13 (3.85%) Istio
4 11 (3.25%) Prometheus
5 6 (1.78%) Ansible
5 6 (1.78%) Microsoft Intune
6 5 (1.48%) SCCM
7 4 (1.18%) Grafana
8 3 (0.89%) FortiGate
9 2 (0.59%) Docker Swarm
9 2 (0.59%) WSUS
Vendors
1 81 (23.96%) Microsoft
2 31 (9.17%) Google
3 22 (6.51%) Databricks
4 17 (5.03%) SAP
5 10 (2.96%) SolarWinds
5 10 (2.96%) Veracode
6 6 (1.78%) Cisco
6 6 (1.78%) Nimble Storage
6 6 (1.78%) Salesforce
6 6 (1.78%) Splunk
6 6 (1.78%) Veeam
6 6 (1.78%) Zscaler
7 5 (1.48%) Citrix
7 5 (1.48%) Palo Alto
7 5 (1.48%) Sony
8 4 (1.18%) ESRI
8 4 (1.18%) Juniper
8 4 (1.18%) Oracle
9 3 (0.89%) IBM
9 3 (0.89%) VMware