Object-Oriented (OO)
UK

The following table provides summary statistics for permanent job vacancies with a requirement for OO skills. Included is a benchmarking guide to the salaries offered in vacancies that have cited OO over the 6 months to 7 December 2023 with a comparison to the same period in the previous 2 years.

6 months to
7 Dec 2023
Same period 2022 Same period 2021
Rank 230 124 101
Rank change year-on-year -106 -23 -18
Permanent jobs citing OO 794 3,470 4,264
As % of all permanent jobs advertised in the UK 1.50% 2.82% 3.33%
As % of the Processes & Methodologies category 1.59% 2.95% 3.49%
Number of salaries quoted 593 2,048 2,573
10th Percentile £41,500 £42,500 £33,750
25th Percentile £51,750 £51,250 £43,750
Median annual salary (50th Percentile) £65,000 £67,500 £57,500
Median % change year-on-year -3.70% +17.39% +4.55%
75th Percentile £83,750 £86,250 £75,000
90th Percentile £110,000 £106,250 £90,000
UK excluding London median annual salary £55,000 £60,000 £50,000
% change year-on-year -8.33% +20.00% +5.26%

All Process and Methodology Skills
UK

OO is in the Processes and Methodologies category. The following table is for comparison with the above and provides summary statistics for all permanent job vacancies with a requirement for process or methodology skills.

Permanent vacancies with a requirement for process or methodology skills 49,863 117,613 122,319
As % of all permanent jobs advertised in the UK 94.11% 95.75% 95.45%
Number of salaries quoted 36,022 72,003 82,155
10th Percentile £32,500 £34,700 £32,500
25th Percentile £43,750 £45,000 £42,500
Median annual salary (50th Percentile) £60,000 £61,000 £60,000
Median % change year-on-year -1.64% +1.67% +9.09%
75th Percentile £80,000 £82,500 £77,500
90th Percentile £99,680 £100,000 £95,000
UK excluding London median annual salary £52,500 £53,500 £50,000
% change year-on-year -1.87% +7.00% +4.17%

OO
Job Vacancy Trend

Job postings citing OO as a proportion of all IT jobs advertised.
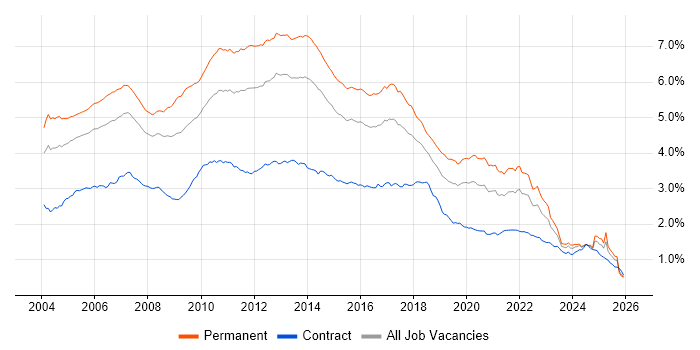
Job vacancy trend for OO in the UK

OO
Salary Trend

3-month moving average salary quoted in jobs citing OO.

Salary trend for OO in the UK

OO
Salary Histogram

Salary distribution for jobs citing OO over the 6 months to 7 December 2023.

Salary histogram for OO in the UK

OO
Top 17 Job Locations

The table below looks at the demand and provides a guide to the median salaries quoted in IT jobs citing OO within the UK over the 6 months to 7 December 2023. The 'Rank Change' column provides an indication of the change in demand within each location based on the same 6 month period last year.

Location Rank Change
on Same Period
Last Year
Matching
Permanent
IT Job Ads
Median Salary
Past 6 Months
Median Salary
% Change
on Same Period
Last Year
Live
Jobs
England -97 703 £66,056 -5.64% 462
UK excluding London -101 393 £55,000 -8.33% 354
London -46 361 £75,000 -9.09% 167
Work from Home -103 323 £63,750 +2.00% 302
South East -81 102 £55,000 -8.33% 108
North of England -71 82 £52,500 -22.22% 79
South West +22 74 £55,000 - 37
Midlands +34 57 £55,000 -8.33% 46
North West -35 45 £55,000 -31.25% 39
Scotland -55 41 £65,000 +18.18% 33
East Midlands +37 29 £49,750 -15.32% 25
Yorkshire -24 29 £53,750 -17.31% 25
West Midlands +41 28 £66,250 +10.42% 21
Wales +1 19 £47,500 -24.00% 11
East of England +7 16 £70,000 +16.67% 41
North East +26 8 £43,500 -4.40% 17
Northern Ireland -20 7 - - 4

OO
Co-occurring Skills and Capabilities by Category

The follow tables expand on the table above by listing co-occurrences grouped by category. The same employment type, locality and period is covered with up to 20 co-occurrences shown in each of the following categories:

Application Platforms
1 22 (2.77%) Confluence
2 21 (2.64%) Apache Airflow
3 8 (1.01%) CMS
4 7 (0.88%) Apache Spark
4 7 (0.88%) IIS
5 6 (0.76%) WordPress
6 5 (0.63%) SharePoint
7 4 (0.50%) Drupal
7 4 (0.50%) NetWeaver
7 4 (0.50%) Tomcat
8 3 (0.38%) Apache
8 3 (0.38%) Apache Pig
8 3 (0.38%) Oracle SOA Suite
9 2 (0.25%) JBoss
10 1 (0.13%) Kentico
10 1 (0.13%) SAS
10 1 (0.13%) Sitecore CMS
10 1 (0.13%) Umbraco
Applications
1 2 (0.25%) OrCAD
2 1 (0.13%) Microsoft Excel
2 1 (0.13%) SPSS
Business Applications
1 7 (0.88%) Dynamics CRM
2 5 (0.63%) JDE EnterpriseOne
2 5 (0.63%) JDE OneWorld
2 5 (0.63%) SAP S/4HANA
3 2 (0.25%) Payment Gateway
4 1 (0.13%) Dynamics AX
4 1 (0.13%) osCommerce
4 1 (0.13%) SAP CO
4 1 (0.13%) SAP FI
4 1 (0.13%) SAP FI/CO
4 1 (0.13%) SAP SD
Cloud Services
1 170 (21.41%) Azure
2 146 (18.39%) AWS
3 62 (7.81%) Azure DevOps
4 60 (7.56%) GCP
5 48 (6.05%) SaaS
6 44 (5.54%) Power Platform
6 44 (5.54%) Serverless
7 36 (4.53%) GitHub
8 21 (2.64%) Azure Service Bus
8 21 (2.64%) Cloud Computing
8 21 (2.64%) Dagster
9 18 (2.27%) PowerApps
10 16 (2.02%) Azure Data Factory
11 14 (1.76%) Azure Functions
12 12 (1.51%) PaaS
13 10 (1.26%) Azure Logic Apps
14 9 (1.13%) Azure API Management
15 8 (1.01%) Dynamics 365
16 7 (0.88%) Amazon EKS
16 7 (0.88%) OpenShift
Communications & Networking
1 13 (1.64%) Internet
2 10 (1.26%) WAN
3 9 (1.13%) 5G
3 9 (1.13%) HTTP
3 9 (1.13%) SD-WAN
4 4 (0.50%) DNS
5 3 (0.38%) FTP
5 3 (0.38%) SMTP
5 3 (0.38%) SSH
5 3 (0.38%) Wireless
6 2 (0.25%) AMQP
6 2 (0.25%) Firewall
6 2 (0.25%) Intranet
6 2 (0.25%) RFID
6 2 (0.25%) TCP/IP
7 1 (0.13%) ATM
7 1 (0.13%) Modbus
7 1 (0.13%) Tactical Data Link
Database & Business Intelligence
1 161 (20.28%) SQL Server
2 76 (9.57%) Relational Database
3 71 (8.94%) MySQL
4 44 (5.54%) NoSQL
5 30 (3.78%) Big Data
5 30 (3.78%) MongoDB
6 28 (3.53%) PostgreSQL
6 28 (3.53%) Power BI
7 17 (2.14%) RDBMS
8 16 (2.02%) Data Lake
8 16 (2.02%) Elasticsearch
8 16 (2.02%) SQL Server Integration Services
9 14 (1.76%) MariaDB
10 13 (1.64%) Azure SQL Database
10 13 (1.64%) Hadoop
10 13 (1.64%) Tableau
11 10 (1.26%) Data Warehouse
12 7 (0.88%) Redis
13 6 (0.76%) Apache Hive
13 6 (0.76%) DB2
Development Applications
1 149 (18.77%) Git
2 49 (6.17%) Jenkins
3 46 (5.79%) Visual Studio
4 45 (5.67%) JIRA
5 27 (3.40%) Subversion
6 22 (2.77%) JUnit
7 21 (2.64%) Selenium
8 20 (2.52%) Postman
9 19 (2.39%) GitLab
10 17 (2.14%) Cucumber
11 13 (1.64%) NUnit
12 12 (1.51%) JMeter
13 11 (1.39%) SQL Server Management Studio (SSMS)
14 10 (1.26%) Maven
14 10 (1.26%) Team Foundation Server
15 9 (1.13%) Moq
16 7 (0.88%) MSTest
16 7 (0.88%) Octopus Deploy
16 7 (0.88%) WebDriver
17 6 (0.76%) SpecFlow
General
1 163 (20.53%) Finance
2 147 (18.51%) Social Skills
3 71 (8.94%) Analytical Skills
4 45 (5.67%) Aerospace
5 38 (4.79%) Banking
6 34 (4.28%) Retail
7 28 (3.53%) Inclusion and Diversity
7 28 (3.53%) Marketing
8 22 (2.77%) Games
8 22 (2.77%) Public Sector
9 17 (2.14%) Front Office
10 16 (2.02%) Legal
11 14 (1.76%) Manufacturing
11 14 (1.76%) Organisational Skills
12 12 (1.51%) Law
13 11 (1.39%) Electronics
13 11 (1.39%) Financial Institution
13 11 (1.39%) Investment Banking
13 11 (1.39%) Military
13 11 (1.39%) Presentation Skills
Job Titles
1 435 (54.79%) Developer
2 167 (21.03%) Senior
3 130 (16.37%) Software Engineer
4 106 (13.35%) Java Developer
5 94 (11.84%) Senior Developer
6 68 (8.56%) .NET Developer
7 67 (8.44%) Full Stack Developer
8 57 (7.18%) C# Developer
9 56 (7.05%) Lead
10 53 (6.68%) Python Engineer
11 51 (6.42%) PHP Developer
12 38 (4.79%) Junior
13 37 (4.66%) Architect
13 37 (4.66%) Python Software Engineer
14 36 (4.53%) Java Engineer
14 36 (4.53%) Python Developer
15 33 (4.16%) Analyst
15 33 (4.16%) Java Software Engineer
16 32 (4.03%) C# Software Engineer
16 32 (4.03%) Software Developer
Libraries, Frameworks & Software Standards
1 227 (28.59%) .NET
2 144 (18.14%) CSS
3 143 (18.01%) HTML
4 141 (17.76%) React
5 107 (13.48%) AngularJS
6 89 (11.21%) REST
7 82 (10.33%) ASP.NET
8 80 (10.08%) .NET Framework
9 66 (8.31%) RESTful
10 65 (8.19%) Spring
11 62 (7.81%) ASP.NET MVC
11 62 (7.81%) jQuery
12 54 (6.80%) .NET Core
12 54 (6.80%) Web Services
13 51 (6.42%) HTML5
14 49 (6.17%) Laravel
14 49 (6.17%) SOAP
15 46 (5.79%) XML
16 45 (5.67%) Entity Framework
16 45 (5.67%) JSON
Miscellaneous
1 38 (4.79%) Algorithms
2 31 (3.90%) Product Ownership
3 26 (3.27%) Distributed Systems
3 26 (3.27%) Greenfield Project
4 21 (2.64%) Data Structures
4 21 (2.64%) Self-Motivation
5 15 (1.89%) Mobile App
6 13 (1.64%) Cloud Native
7 12 (1.51%) Enterprise Software
7 12 (1.51%) Foreign Exchange (FX)
7 12 (1.51%) Housing Association
7 12 (1.51%) IoT
7 12 (1.51%) Sports Betting
8 11 (1.39%) Derivative
9 10 (1.26%) Client/Server
10 9 (1.13%) Fixed Income
10 9 (1.13%) GNSS
10 9 (1.13%) Low-Code
11 8 (1.01%) Embedded Systems
11 8 (1.01%) Management Information System
Operating Systems
1 69 (8.69%) Linux
2 45 (5.67%) Windows
3 11 (1.39%) Android
4 9 (1.13%) Unix
5 5 (0.63%) Apple iOS
6 4 (0.50%) Ubuntu
6 4 (0.50%) Windows Server
7 3 (0.38%) Red Hat Enterprise Linux
8 2 (0.25%) VMS
9 1 (0.13%) Embedded Linux
9 1 (0.13%) Windows 10
Processes & Methodologies
1 372 (46.85%) Agile
2 285 (35.89%) OOP
3 250 (31.49%) Problem-Solving
4 241 (30.35%) Software Engineering
5 191 (24.06%) Design Patterns
6 187 (23.55%) SDLC
7 170 (21.41%) DevOps
8 142 (17.88%) Computer Science
9 140 (17.63%) CI/CD
9 140 (17.63%) Microservices
10 129 (16.25%) Full Stack Development
11 106 (13.35%) Test Automation
12 104 (13.10%) MVC
13 98 (12.34%) Project Management
14 92 (11.59%) Actionable Insight
14 92 (11.59%) TDD
15 84 (10.58%) OOD
16 80 (10.08%) OOA/OOD
17 75 (9.45%) Mentoring
18 73 (9.19%) Web Development
Programming Languages
1 335 (42.19%) C#
2 305 (38.41%) Java
3 253 (31.86%) JavaScript
4 220 (27.71%) SQL
5 219 (27.58%) Python
6 124 (15.62%) C++
7 69 (8.69%) PHP
8 43 (5.42%) TypeScript
9 34 (4.28%) C
9 34 (4.28%) T-SQL
10 29 (3.65%) PowerShell
11 28 (3.53%) Bash
11 28 (3.53%) Perl
12 23 (2.90%) Go
13 18 (2.27%) Ruby
14 16 (2.02%) VB
15 12 (1.51%) VB.NET
16 9 (1.13%) Apex Code
17 8 (1.01%) Scala
18 7 (0.88%) R
Qualifications
1 166 (20.91%) Degree
2 73 (9.19%) Computer Science Degree
3 56 (7.05%) Security Cleared
4 40 (5.04%) Master's Degree
5 36 (4.53%) SC Cleared
6 26 (3.27%) PhD
7 9 (1.13%) Microsoft Certification
8 4 (0.50%) BPSS Clearance
9 3 (0.38%) Azure Certification
9 3 (0.38%) DV Cleared
10 2 (0.25%) AWS Certification
10 2 (0.25%) ISEB
10 2 (0.25%) ISTQB
10 2 (0.25%) ITIL Foundation Certificate
11 1 (0.13%) CFA
11 1 (0.13%) ISTQB Foundation Certification
11 1 (0.13%) MCP
Quality Assurance & Compliance
1 43 (5.42%) QA
2 13 (1.64%) Data Quality
3 12 (1.51%) PMO
4 6 (0.76%) Accessibility
5 4 (0.50%) ISO/IEC 27001
5 4 (0.50%) PCI DSS
5 4 (0.50%) WCAG
6 3 (0.38%) MISRA
6 3 (0.38%) Software Quality Assurance
7 2 (0.25%) MISRA C
System Software
1 112 (14.11%) Docker
2 5 (0.63%) Firmware
3 3 (0.38%) HDFS
4 2 (0.25%) Active Directory
5 1 (0.13%) Embedded Firmware
Systems Management
1 109 (13.73%) Kubernetes
2 33 (4.16%) Terraform
3 21 (2.64%) Ansible
4 16 (2.02%) Grafana
5 13 (1.64%) Prometheus
6 6 (0.76%) Puppet
7 5 (0.63%) Kibana
8 3 (0.38%) Istio
8 3 (0.38%) Single Sign-On
9 2 (0.25%) Kustomize
9 2 (0.25%) Nagios
10 1 (0.13%) cPanel
10 1 (0.13%) Fortio
10 1 (0.13%) Kiali
10 1 (0.13%) MIIS
10 1 (0.13%) Plesk
10 1 (0.13%) Progress Chef
Vendors
1 121 (15.24%) Microsoft
2 29 (3.65%) Oracle
3 19 (2.39%) Google
4 13 (1.64%) SAP
5 12 (1.51%) Salesforce
6 10 (1.26%) Alteryx
7 6 (0.76%) IBM
8 5 (0.63%) Confluent
8 5 (0.63%) JD Edwards
8 5 (0.63%) ServiceNow
8 5 (0.63%) Xamarin
9 4 (0.50%) Dynatrace
9 4 (0.50%) MuleSoft
9 4 (0.50%) Zend
10 3 (0.38%) Adobe
10 3 (0.38%) Databricks
10 3 (0.38%) SnapLogic
11 2 (0.25%) Atlassian
11 2 (0.25%) Cadence
11 2 (0.25%) Okta