Impact Assessments Jobs with Work from Home Options

Impact Assessments
UK > Work from Home

The table below provides summary statistics for permanent job vacancies with an option to work from home (WFH) and a requirement for Impact Assessments skills. Included is a benchmarking guide to the salaries offered in vacancies that have cited Impact Assessments over the 6 months to 19 May 2024 with a comparison to the same period in the previous 2 years.

6 months to
19 May 2024
Same period 2023 Same period 2022
Rank 373 402 558
Rank change year-on-year +29 +156 -46
Permanent jobs citing Impact Assessments 231 270 331
As % of all permanent jobs with a WFH option 0.68% 0.67% 0.47%
As % of the Processes & Methodologies category 0.75% 0.69% 0.48%
Number of salaries quoted 90 166 231
10th Percentile £35,000 - £38,635
25th Percentile £36,750 £46,570 £45,000
Median annual salary (50th Percentile) £48,875 £49,343 £57,500
Median % change year-on-year -0.95% -14.19% +9.52%
75th Percentile £77,500 £67,000 £73,750
90th Percentile £92,500 £87,500 £90,000
UK median annual salary £50,000 £51,573 £55,000
% change year-on-year -3.05% -6.23% +4.76%

All Process and Methodology Skills
Work from Home

Impact Assessments is in the Processes and Methodologies category. The following table is for comparison with the above and provides summary statistics for all permanent job vacancies with a WFH option and a requirement for process or methodology skills.

Permanent vacancies with a requirement for process or methodology skills 30,860 38,962 68,422
As % of all permanent jobs with a WFH option 91.20% 96.03% 97.03%
Number of salaries quoted 23,358 27,133 41,275
10th Percentile £33,750 £37,500 £36,250
25th Percentile £42,500 £47,500 £45,750
Median annual salary (50th Percentile) £57,500 £62,500 £60,000
Median % change year-on-year -8.00% +4.17% +9.09%
75th Percentile £75,000 £82,500 £80,000
90th Percentile £95,000 £100,000 £95,000
UK median annual salary £55,000 £61,180 £60,000
% change year-on-year -10.10% +1.97% +9.09%

Impact Assessments
Trend for Jobs with a WFH Option

Job vacancies with a work from home option citing Impact Assessments as a proportion of all IT jobs advertised.
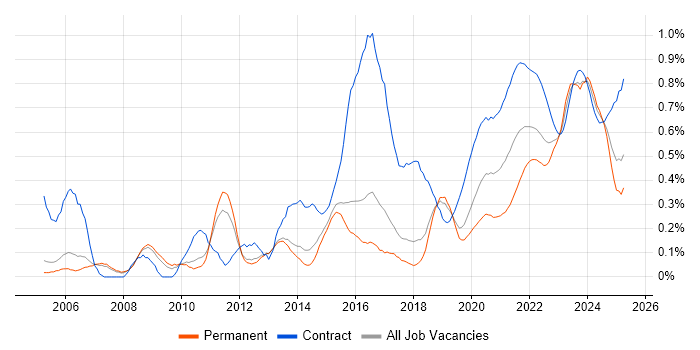
Impact Assessments trend for jobs with a WFH option

Impact Assessments
Salary Trend for Jobs with a WFH Option

3-month moving average salary quoted in job vacancies with a work from home option citing Impact Assessments.

Impact Assessments salary trend for jobs with a WFH option

Impact Assessments
Salary Histogram for Jobs with a WFH Option

Salary distribution for jobs with a work from home option citing Impact Assessments over the 6 months to 19 May 2024.

Impact Assessments salary histogram for jobs with a WFH option

Impact Assessments
Co-occurring Skills and Capabilities with WFH Options by Category

The follow tables expand on the table above by listing co-occurrences grouped by category. The same employment type, locality and period is covered with up to 20 co-occurrences shown in each of the following categories:

Application Platforms
1 13 (5.63%) Documentum
2 3 (1.30%) SharePoint
3 1 (0.43%) Confluence
Applications
1 19 (8.23%) Microsoft Excel
2 18 (7.79%) Microsoft Office
3 9 (3.90%) Microsoft PowerPoint
Business Applications
1 13 (5.63%) TrackWise
2 6 (2.60%) Oracle EBS
3 4 (1.73%) NEC Housing
4 1 (0.43%) Dynamics CRM
4 1 (0.43%) SAP ERP
4 1 (0.43%) SAP HCM
Cloud Services
1 25 (10.82%) Azure
2 17 (7.36%) PaaS
3 13 (5.63%) AWS
3 13 (5.63%) Azure DevOps
4 12 (5.19%) Power Platform
5 10 (4.33%) Azure Cognitive Services
5 10 (4.33%) Microsoft 365
6 8 (3.46%) SaaS
7 7 (3.03%) IaaS
8 4 (1.73%) OCI
9 2 (0.87%) Azure Logic Apps
9 2 (0.87%) Azure Monitor
9 2 (0.87%) Azure Sentinel
9 2 (0.87%) Microsoft Purview
9 2 (0.87%) OneDrive
9 2 (0.87%) Power Automate
10 1 (0.43%) Azure Synapse Analytics
10 1 (0.43%) Dynamics 365
10 1 (0.43%) Miro
10 1 (0.43%) SuccessFactors
Communications & Networking
1 11 (4.76%) Firewall
2 10 (4.33%) LAN
2 10 (4.33%) WAN
2 10 (4.33%) Wireless
3 6 (2.60%) Cisco IPT
4 4 (1.73%) Network Security
5 3 (1.30%) Radio Access Network
5 3 (1.30%) TCP/IP
6 2 (0.87%) Broadband
6 2 (0.87%) Converged Networks
6 2 (0.87%) VPN
7 1 (0.43%) DNS
Database & Business Intelligence
1 1 (0.43%) Big Data
1 1 (0.43%) Metadata
1 1 (0.43%) Power BI
1 1 (0.43%) SAP BW
1 1 (0.43%) SAP HANA
Development Applications
1 6 (2.60%) Git
1 6 (2.60%) JIRA
General
1 132 (57.14%) Social Skills
2 87 (37.66%) Finance
3 59 (25.54%) Marketing
4 37 (16.02%) Public Sector
5 30 (12.99%) Legal
6 29 (12.55%) Retail
7 23 (9.96%) Presentation Skills
8 19 (8.23%) Police
9 16 (6.93%) Analytical Skills
9 16 (6.93%) Inclusion and Diversity
9 16 (6.93%) Pharmaceutical
10 15 (6.49%) Manufacturing
11 12 (5.19%) Law
12 11 (4.76%) Banking
13 7 (3.03%) Telecoms
14 4 (1.73%) Local Government
15 3 (1.30%) Games
15 3 (1.30%) Organisational Skills
15 3 (1.30%) Wearables
16 2 (0.87%) Influencing Skills
Job Titles
1 71 (30.74%) Analyst
2 61 (26.41%) Consultant
3 50 (21.65%) Business Analyst
4 21 (9.09%) Lead
5 19 (8.23%) Systems Manager
6 17 (7.36%) IT Manager
7 14 (6.06%) Senior
8 13 (5.63%) Data Integrity Manager
8 13 (5.63%) QA Manager
9 12 (5.19%) Developer
10 8 (3.46%) Architect
10 8 (3.46%) Automation Developer
10 8 (3.46%) Senior Analyst
11 6 (2.60%) Change Manager
11 6 (2.60%) Data Protection Specialist
11 6 (2.60%) Senior Test Analyst
11 6 (2.60%) Test Analyst
12 5 (2.16%) Business Process Analyst
12 5 (2.16%) Process Analyst
12 5 (2.16%) Solutions Architect
Libraries, Frameworks & Software Standards
1 10 (4.33%) .NET
1 10 (4.33%) .NET Framework
1 10 (4.33%) HTML
1 10 (4.33%) JSON
1 10 (4.33%) REST
2 7 (3.03%) XML
3 6 (2.60%) Oracle Fusion
4 4 (1.73%) CSS
5 2 (0.87%) Microsoft Graph
5 2 (0.87%) SPFx
6 1 (0.43%) PySpark
Miscellaneous
1 13 (5.63%) Life Science
1 13 (5.63%) LIMS
2 12 (5.19%) Management Information System
3 10 (4.33%) Data Structures
3 10 (4.33%) Self-Motivation
4 6 (2.60%) Data Protection Act
4 6 (2.60%) Onboarding
5 5 (2.16%) Freedom of Information
6 4 (1.73%) Product Ownership
6 4 (1.73%) Security Operations Centre
7 3 (1.30%) Cyber Kill Chain
7 3 (1.30%) EPoS
7 3 (1.30%) FMCG
7 3 (1.30%) Hackathon
7 3 (1.30%) Low-Code
8 2 (0.87%) Mobile App
8 2 (0.87%) NHS
8 2 (0.87%) Replication
9 1 (0.43%) Insider Threat
9 1 (0.43%) Smart Meter
Operating Systems
1 8 (3.46%) Windows
1 8 (3.46%) Windows Server
Processes & Methodologies
1 68 (29.44%) Roadmaps
2 65 (28.14%) Service Delivery
3 61 (26.41%) Strategic Roadmap
4 60 (25.97%) Enterprise Architecture
4 60 (25.97%) Financial Analysis
5 59 (25.54%) Data Architecture
6 50 (21.65%) Business Analysis
7 39 (16.88%) ITIL
8 35 (15.15%) Actionable Insight
9 32 (13.85%) Coaching
9 32 (13.85%) Feasibility Study
10 29 (12.55%) Business Case
11 28 (12.12%) Process Improvement
11 28 (12.12%) Programme Management
12 27 (11.69%) Self-Awareness
13 26 (11.26%) Agile
13 26 (11.26%) Continuous Improvement
14 25 (10.82%) Data Protection
14 25 (10.82%) GAP Analysis
15 23 (9.96%) Stakeholder Management
Programming Languages
1 12 (5.19%) PowerShell
2 11 (4.76%) Python
3 10 (4.33%) JavaScript
4 1 (0.43%) SQL
Qualifications
1 38 (16.45%) Degree
2 29 (12.55%) Security Cleared
3 19 (8.23%) SC Cleared
4 6 (2.60%) ISEB
5 5 (2.16%) APMP
6 4 (1.73%) BPSS Clearance
7 2 (0.87%) CCNA
7 2 (0.87%) CISA
7 2 (0.87%) Cisco Certification
7 2 (0.87%) CISM
8 1 (0.43%) Azure Certification
8 1 (0.43%) CISSP
8 1 (0.43%) CRISC
8 1 (0.43%) Master's Degree
Quality Assurance & Compliance
1 34 (14.72%) QA
2 15 (6.49%) GDPR
3 13 (5.63%) GMP
3 13 (5.63%) Good Clinical Practice
3 13 (5.63%) GxP
4 7 (3.03%) ISO/IEC 27001
5 6 (2.60%) PCI DSS
6 4 (1.73%) Accessibility
6 4 (1.73%) Cyber Essentials
7 3 (1.30%) GRC
7 3 (1.30%) NIST
7 3 (1.30%) SLA
8 2 (0.87%) NCSC
System Software
1 4 (1.73%) Active Directory
Systems Management
1 4 (1.73%) Ansible
1 4 (1.73%) Terraform
Vendors
1 33 (14.29%) Microsoft
2 10 (4.33%) Automation Anywhere
2 10 (4.33%) Blue Prism
2 10 (4.33%) Oracle
2 10 (4.33%) UiPath
3 4 (1.73%) NEC
4 2 (0.87%) Cisco
4 2 (0.87%) Salesforce
4 2 (0.87%) SAP
5 1 (0.43%) CrowdStrike
5 1 (0.43%) Marketo
5 1 (0.43%) OneTrust
5 1 (0.43%) Palo Alto
5 1 (0.43%) SnapLogic
5 1 (0.43%) Splunk