Computer Science Degree Jobs in the UK excluding London

Computer Science Degree
UK > UK excluding London

The table below provides summary statistics for permanent job vacancies advertised in the UK excluding London with a requirement for Computer Science Degree qualifications. It includes a benchmarking guide to the salaries offered over the 6 months leading up to 2 June 2025, comparing them to the same period in the previous two years.

6 months to
2 Jun 2025
Same period 2024 Same period 2023
Rank 115 128 164
Rank change year-on-year +13 +36 -7
Permanent jobs citing Computer Science Degree 1,074 1,588 1,234
As % of all permanent jobs advertised in the UK excluding London 2.70% 2.09% 2.18%
As % of the Qualifications category 5.02% 7.97% 5.79%
Number of salaries quoted 456 1,219 755
10th Percentile £29,875 £31,250 £33,750
25th Percentile £37,313 £37,500 £41,250
Median annual salary (50th Percentile) £55,000 £52,500 £60,800
Median % change year-on-year +4.76% -13.65% +21.60%
75th Percentile £73,000 £72,500 £70,000
90th Percentile £82,500 £85,000 £85,000
UK median annual salary £63,000 £60,000 £60,899
% change year-on-year +5.00% -1.48% +1.50%

All Academic and Professional Certifications
UK excluding London

Computer Science Degree falls under the Academic Qualifications and Professional Certifications category. For comparison with the information above, the following table provides summary statistics for all permanent job vacancies requiring academic qualifications or professional certifications in the UK excluding London.

Permanent vacancies requiring academic qualifications or professional certifications 21,389 19,915 21,308
As % of all permanent jobs advertised in the UK excluding London 53.76% 26.21% 37.69%
Number of salaries quoted 8,724 12,282 7,936
10th Percentile £30,500 £27,500 £28,750
25th Percentile £41,000 £36,250 £37,500
Median annual salary (50th Percentile) £52,500 £50,000 £52,500
Median % change year-on-year +5.00% -4.76% +5.00%
75th Percentile £63,900 £65,000 £67,500
90th Percentile £73,708 £80,000 £80,000
UK median annual salary £55,000 £53,772 £60,000
% change year-on-year +2.28% -10.38% +9.09%

Computer Science Degree
Job Vacancy Trend in the UK excluding London

Job postings citing Computer Science Degree as a proportion of all IT jobs advertised in the UK excluding London.
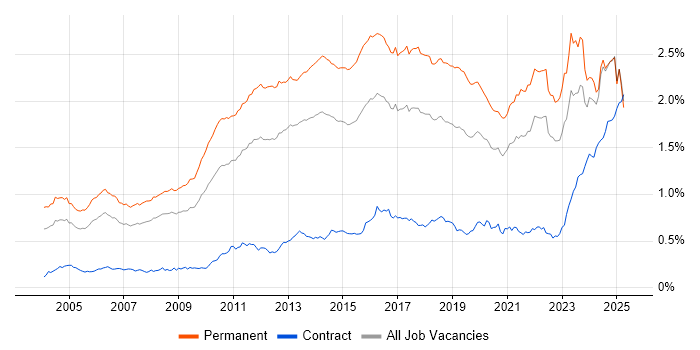
Job vacancy trend for Computer Science Degree in the UK excluding London

Computer Science Degree
Salary Trend in the UK excluding London

3-month moving average salary quoted in jobs citing Computer Science Degree in the UK excluding London.

Salary trend for Computer Science Degree in the UK excluding London

Computer Science Degree
Salary Histogram in the UK excluding London

Salary distribution for jobs citing Computer Science Degree in the UK excluding London over the 6 months to 2 June 2025.

Salary histogram for Computer Science Degree in the UK excluding London

Computer Science Degree
Job Locations in the UK excluding London

The table below looks at the demand and provides a guide to the median salaries quoted in IT jobs citing Computer Science Degree within the UK excluding London region over the 6 months to 2 June 2025. The 'Rank Change' column provides an indication of the change in demand within each location based on the same 6 month period last year.

Location Rank Change
on Same Period
Last Year
Matching
Permanent
IT Job Ads
Median Salary
Past 6 Months
Median Salary
% Change
on Same Period
Last Year
Live
Jobs
South East +23 396 £70,000 +16.67% 1,883
North of England -41 226 £56,500 +13.00% 1,487
Midlands +51 203 £35,000 -30.00% 1,308
West Midlands +63 149 £35,000 -33.33% 718
East of England +41 128 £52,000 +30.00% 1,084
Yorkshire +12 105 £60,000 +33.33% 592
North West -72 99 £55,000 +10.00% 695
South West +38 67 £55,000 +15.79% 767
East Midlands +19 51 £35,000 -25.28% 509
North East +48 22 £56,500 +7.62% 204
Scotland +8 20 £51,914 -9.71% 344
Wales +37 18 £73,000 +114.71% 192
Northern Ireland +37 15 £110,000 +171.60% 123
Isle of Man +6 1 - - 1
Computer Science Degree
UK

Computer Science Degree
Co-occurring Skills and Capabilities in the UK excluding London by Category

The follow tables expand on the table above by listing co-occurrences grouped by category. The same employment type, locality and period is covered with up to 20 co-occurrences shown in each of the following categories:

Application Platforms
1 23 (2.14%) Jupyter
2 15 (1.40%) Apache Spark
3 14 (1.30%) CMS
4 13 (1.21%) WordPress
5 10 (0.93%) SharePoint
6 7 (0.65%) Microsoft Exchange
7 6 (0.56%) IIS
8 5 (0.47%) Apache Airflow
8 5 (0.47%) SAS
9 4 (0.37%) Apache
9 4 (0.37%) Confluence
10 3 (0.28%) Umbraco
11 2 (0.19%) NServiceBus
11 2 (0.19%) SharePoint Server
11 2 (0.19%) ThingWorx
Applications
1 19 (1.77%) Microsoft Office
2 12 (1.12%) Microsoft Excel
3 7 (0.65%) Revit
4 6 (0.56%) MS Visio
5 2 (0.19%) Microsoft Project
6 1 (0.093%) AutoCAD
Business Applications
1 9 (0.84%) Shopify
2 6 (0.56%) Dynamics NAV
2 6 (0.56%) Remedy ITSM
3 5 (0.47%) SAP Business One
4 4 (0.37%) Dynamics CRM
5 3 (0.28%) NetSuite
5 3 (0.28%) Oracle EBS
5 3 (0.28%) SAP S/4HANA
6 2 (0.19%) SAP ERP
7 1 (0.093%) Oracle Applications
7 1 (0.093%) Oracle EBS R12
7 1 (0.093%) Oracle ERP
7 1 (0.093%) Sage 200
7 1 (0.093%) SAP EWM
7 1 (0.093%) SAP GRC
7 1 (0.093%) SAP MM
7 1 (0.093%) SAP WM
Cloud Services
1 189 (17.60%) Azure
2 116 (10.80%) AWS
3 44 (4.10%) GCP
4 34 (3.17%) Azure DevOps
5 27 (2.51%) Microsoft 365
6 22 (2.05%) Power Platform
7 21 (1.96%) Salesforce Sales Cloud
8 20 (1.86%) Serverless
9 19 (1.77%) PaaS
10 16 (1.49%) Google Workspace
11 15 (1.40%) AWS Lambda
12 14 (1.30%) Amazon ECS
12 14 (1.30%) Azure Monitor
12 14 (1.30%) GitHub
13 13 (1.21%) Dynamics 365
14 12 (1.12%) Entra ID
14 12 (1.12%) SaaS
15 9 (0.84%) Amazon S3
15 9 (0.84%) Slack
15 9 (0.84%) Zapier
Communications & Networking
1 182 (16.95%) Broadband
2 54 (5.03%) Network Security
3 41 (3.82%) Firewall
4 40 (3.72%) WLAN
5 37 (3.45%) Internet
6 35 (3.26%) TCP/IP
7 29 (2.70%) DNS
8 20 (1.86%) DHCP
9 18 (1.68%) VLAN
10 16 (1.49%) BGP
11 15 (1.40%) OSPF
12 14 (1.30%) SAN
13 10 (0.93%) LAN
13 10 (0.93%) WAN
14 9 (0.84%) NAS
14 9 (0.84%) VPN
14 9 (0.84%) Wi-Fi
15 7 (0.65%) DWDM
16 6 (0.56%) Cisco Nexus
16 6 (0.56%) Intrusion Detection
Database & Business Intelligence
1 76 (7.08%) SQL Server
2 49 (4.56%) MySQL
3 38 (3.54%) Big Data
4 26 (2.42%) NoSQL
5 25 (2.33%) Data Warehouse
6 22 (2.05%) Relational Database
7 17 (1.58%) Power BI
8 16 (1.49%) Data Lake
9 12 (1.12%) Hadoop
10 10 (0.93%) PostgreSQL
10 10 (0.93%) SQL Server Reporting Services
11 9 (0.84%) Amazon RDS
11 9 (0.84%) Oracle Database
11 9 (0.84%) SQL Server Integration Services
12 8 (0.74%) Azure SQL Database
13 7 (0.65%) MongoDB
14 5 (0.47%) BigQuery
14 5 (0.47%) FileMaker
15 4 (0.37%) Amazon Redshift
15 4 (0.37%) Elasticsearch
Development Applications
1 46 (4.28%) Git
2 24 (2.23%) JIRA
3 9 (0.84%) Visual Studio
4 7 (0.65%) Jenkins
5 6 (0.56%) Burp Suite
5 6 (0.56%) Sonatype Nexus
6 5 (0.47%) Metasploit
6 5 (0.47%) Moq
6 5 (0.47%) Octopus Deploy
6 5 (0.47%) SpecFlow
7 4 (0.37%) Bitbucket
7 4 (0.37%) Vite
8 3 (0.28%) AppScan
8 3 (0.28%) GitLab
8 3 (0.28%) TeamCity
8 3 (0.28%) Visual Studio Code
9 2 (0.19%) Cypress.io
9 2 (0.19%) Maven
9 2 (0.19%) Oracle Forms
9 2 (0.19%) SonarQube
General
1 492 (45.81%) Social Skills
2 153 (14.25%) Finance
3 107 (9.96%) Analytical Skills
4 67 (6.24%) Law
5 42 (3.91%) Manufacturing
6 41 (3.82%) Inclusion and Diversity
7 36 (3.35%) Retail
8 33 (3.07%) Marketing
9 26 (2.42%) Games
10 25 (2.33%) Legal
10 25 (2.33%) Multimedia
11 20 (1.86%) Electronics
12 17 (1.58%) Advertising
13 15 (1.40%) Automotive
14 14 (1.30%) Organisational Skills
15 10 (0.93%) Documentation Skills
15 10 (0.93%) Pharmaceutical
16 9 (0.84%) Telecoms
17 8 (0.74%) Aviation
18 7 (0.65%) Military
Job Titles
1 162 (15.08%) Developer
2 140 (13.04%) Lead
3 135 (12.57%) IT Manager
4 132 (12.29%) Architect
5 101 (9.40%) Senior
6 74 (6.89%) Software Architect
7 60 (5.59%) Graduate
8 59 (5.49%) Systems Engineer
9 51 (4.75%) Software Engineer
10 50 (4.66%) Engineering Manager
11 45 (4.19%) IT Engineer
12 44 (4.10%) Graduate Developer
13 42 (3.91%) Support Engineer
14 39 (3.63%) IT Support
15 36 (3.35%) Senior Manager
16 35 (3.26%) Software Developer
16 35 (3.26%) Team Leader
17 34 (3.17%) IT Graduate
17 34 (3.17%) IT Support Engineer
18 32 (2.98%) Analyst
Libraries, Frameworks & Software Standards
1 108 (10.06%) .NET
2 96 (8.94%) Middleware
3 95 (8.85%) HTML
4 72 (6.70%) CSS
5 44 (4.10%) REST
6 43 (4.00%) ASP.NET
6 43 (4.00%) React
7 37 (3.45%) jQuery
8 22 (2.05%) Node.js
8 22 (2.05%) RESTful
8 22 (2.05%) SOAP
9 21 (1.96%) Lightning Web Components
10 20 (1.86%) .NET Framework
11 19 (1.77%) .NET Core
11 19 (1.77%) AngularJS
11 19 (1.77%) Kafka
12 18 (1.68%) PyTorch
12 18 (1.68%) TensorFlow
12 18 (1.68%) WinForms
13 15 (1.40%) YAML
Miscellaneous
1 86 (8.01%) Management Information System
2 39 (3.63%) Algorithms
2 39 (3.63%) Product Ownership
3 33 (3.07%) Security Posture
4 29 (2.70%) Driving Licence
5 26 (2.42%) Enterprise Software
6 24 (2.23%) Cyberattack
7 23 (2.14%) Self-Motivation
7 23 (2.14%) Video\Live Streaming
8 18 (1.68%) Cloud Native
9 17 (1.58%) Mobile App
10 12 (1.12%) Virtual Team
11 11 (1.02%) Onboarding
11 11 (1.02%) Robotics
11 11 (1.02%) Smartphone
12 9 (0.84%) Hybrid Cloud
13 8 (0.74%) Greenfield Project
13 8 (0.74%) IoT
13 8 (0.74%) Life Science
14 7 (0.65%) Social Media
Operating Systems
1 98 (9.12%) Windows
2 88 (8.19%) Linux
3 24 (2.23%) Windows Server
4 16 (1.49%) Windows Server 2016
5 13 (1.21%) Windows Server 2019
6 11 (1.02%) Mac OS X
6 11 (1.02%) Ubuntu
6 11 (1.02%) Windows 10
7 10 (0.93%) Android
8 8 (0.74%) Apple iOS
9 7 (0.65%) Mac OS
10 6 (0.56%) Windows Vista
11 4 (0.37%) Red Hat Enterprise Linux
12 3 (0.28%) Kali Linux
13 2 (0.19%) Unix
Processes & Methodologies
1 1,067 (99.35%) Computer Science
2 444 (41.34%) Problem-Solving
3 356 (33.15%) Mentoring
4 255 (23.74%) Agile
5 220 (20.48%) DevOps
6 217 (20.20%) Roadmaps
7 201 (18.72%) High Availability
8 199 (18.53%) Continuous Improvement
9 182 (16.95%) Product Management
10 167 (15.55%) Software Engineering
11 159 (14.80%) Broadcast Engineering
12 131 (12.20%) Artificial Intelligence
13 125 (11.64%) Customer-Centricity
14 115 (10.71%) Design Patterns
15 109 (10.15%) Machine Learning
16 107 (9.96%) SDLC
17 94 (8.75%) CI/CD
18 89 (8.29%) Configuration Management
19 87 (8.10%) Data Privacy
20 80 (7.45%) Open Source
Programming Languages
1 185 (17.23%) Java
2 184 (17.13%) SQL
3 182 (16.95%) Python
4 180 (16.76%) C#
5 151 (14.06%) JavaScript
6 115 (10.71%) C++
7 103 (9.59%) PHP
8 90 (8.38%) TypeScript
9 60 (5.59%) C
10 55 (5.12%) PowerShell
11 50 (4.66%) R
12 49 (4.56%) Ruby
12 49 (4.56%) Rust
13 48 (4.47%) Dart
13 48 (4.47%) MATLAB
14 22 (2.05%) Apex Code
15 12 (1.12%) Bash
15 12 (1.12%) PL/SQL
15 12 (1.12%) T-SQL
16 11 (1.02%) Kotlin
Qualifications
1 1,074 (100.00%) Degree
2 103 (9.59%) Master's Degree
3 90 (8.38%) BPSS Clearance
4 88 (8.19%) Chartered Engineer
5 64 (5.96%) Microsoft Certification
6 61 (5.68%) Security Cleared
7 46 (4.28%) Cisco Certification
8 45 (4.19%) MCSE
9 37 (3.45%) CCNP
10 36 (3.35%) CCNA
11 30 (2.79%) LPIC
12 29 (2.70%) MCP
12 29 (2.70%) SC Cleared
13 26 (2.42%) Azure Certification
14 25 (2.33%) DV Cleared
15 22 (2.05%) CISSP
16 19 (1.77%) AWS Certification
17 17 (1.58%) HND
18 16 (1.49%) DBS Check
19 11 (1.02%) HNC
Quality Assurance & Compliance
1 74 (6.89%) ISO/IEC 12207
2 37 (3.45%) ISO/IEC 27001
3 34 (3.17%) Data Quality
4 33 (3.07%) GDPR
5 29 (2.70%) NIST
6 25 (2.33%) QA
7 15 (1.40%) NCSC
8 11 (1.02%) Accessibility
9 10 (0.93%) California Consumer Privacy Act
10 8 (0.74%) HIPAA
11 7 (0.65%) Cyber Essentials
12 6 (0.56%) Cyber Essentials PLUS
13 5 (0.47%) 21 CFR Part 11
13 5 (0.47%) Def Stans
14 3 (0.28%) Actionable Recommendations
14 3 (0.28%) Good Clinical Practice
14 3 (0.28%) SOC 2
15 2 (0.19%) CDISC
15 2 (0.19%) GMP
15 2 (0.19%) PCI DSS
System Software
1 54 (5.03%) Docker
2 29 (2.70%) Active Directory
3 15 (1.40%) VMware Infrastructure
4 6 (0.56%) Hyper-V
5 5 (0.47%) VMware NSX
6 4 (0.37%) VMware ESXi
7 3 (0.28%) HDFS
8 2 (0.19%) Firmware
8 2 (0.19%) GPFS
8 2 (0.19%) Lustre
8 2 (0.19%) NFS
8 2 (0.19%) Virtual Machines
9 1 (0.093%) Embedded Firmware
9 1 (0.093%) KVM
9 1 (0.093%) vSphere
Systems Management
1 63 (5.87%) Kubernetes
2 35 (3.26%) Grafana
3 28 (2.61%) Prometheus
4 25 (2.33%) Terraform
5 13 (1.21%) Ansible
6 10 (0.93%) Microsoft Intune
7 6 (0.56%) ArcSight ESM
7 6 (0.56%) QRadar
8 4 (0.37%) Kibana
9 3 (0.28%) Docker Swarm
9 3 (0.28%) Nessus
10 2 (0.19%) CASB
10 2 (0.19%) Kubeflow
10 2 (0.19%) Nmap
11 1 (0.093%) Argo
11 1 (0.093%) Control-M
11 1 (0.093%) logstash
11 1 (0.093%) Oracle RMAN
11 1 (0.093%) Single Sign-On
Vendors
1 146 (13.59%) Microsoft
2 58 (5.40%) Cisco
3 35 (3.26%) Google
4 27 (2.51%) Salesforce
5 23 (2.14%) ServiceNow
6 21 (1.96%) Salesforce Marketing Cloud
7 20 (1.86%) Oracle
8 17 (1.58%) VMware
9 14 (1.30%) OpenAI
10 13 (1.21%) Dell
10 13 (1.21%) SAP
11 11 (1.02%) Apple
11 11 (1.02%) Fortinet
11 11 (1.02%) McAfee
11 11 (1.02%) Ubiquiti
12 10 (0.93%) WooCommerce
13 9 (0.84%) Splunk
14 8 (0.74%) Informatica
14 8 (0.74%) Veeam
15 7 (0.65%) Remedy