Apple iOS Jobs in England

Apple iOS
UK > England

The table below provides summary statistics for permanent job vacancies advertised in England requiring Apple iOS skills. It includes a benchmarking guide to the annual salaries offered in vacancies that cited Apple iOS over the 6 months leading up to 29 May 2025, comparing them to the same period in the previous two years.

6 months to
29 May 2025
Same period 2024 Same period 2023
Rank 363 246 293
Rank change year-on-year -117 +47 -124
Permanent jobs citing Apple iOS 333 1,004 1,030
As % of all permanent jobs advertised in England 0.69% 1.13% 1.19%
As % of the Operating Systems category 5.00% 8.02% 7.36%
Number of salaries quoted 201 634 684
10th Percentile £26,500 £25,000 £27,750
25th Percentile £32,500 £30,500 £35,000
Median annual salary (50th Percentile) £52,500 £45,000 £55,000
Median % change year-on-year +16.67% -18.18% -8.33%
75th Percentile £72,500 £62,500 £80,000
90th Percentile £87,500 £80,000 £101,185
UK median annual salary £55,000 £45,000 £55,000
% change year-on-year +22.22% -18.18% -8.33%

All Operating Systems
England

Apple iOS falls under the Operating Systems category. For comparison with the information above, the following table provides summary statistics for all permanent job vacancies requiring operating system skills in England.

Permanent vacancies with a requirement for operating system skills 6,655 12,516 14,003
As % of all permanent jobs advertised in England 13.71% 14.09% 16.17%
Number of salaries quoted 3,862 9,804 9,588
10th Percentile £27,000 £25,759 £27,000
25th Percentile £32,000 £31,250 £35,000
Median annual salary (50th Percentile) £45,000 £45,000 £52,500
Median % change year-on-year - -14.29% -
75th Percentile £65,000 £62,500 £72,500
90th Percentile £82,500 £80,000 £93,750
UK median annual salary £45,000 £45,000 £52,500
% change year-on-year - -14.29% -

Apple iOS
Job Vacancy Trend in England

Job postings citing Apple iOS as a proportion of all IT jobs advertised in England.
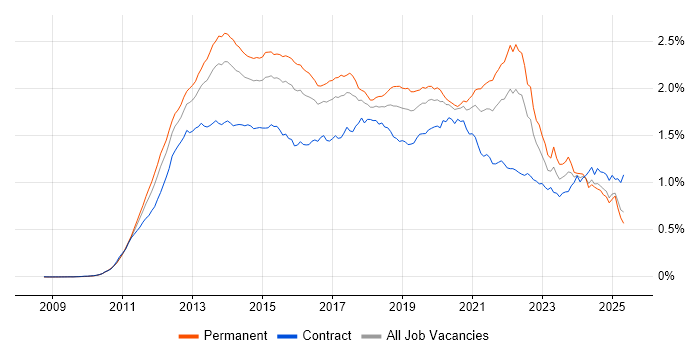
Job vacancy trend for Apple iOS in England

Apple iOS
Salary Trend in England

3-month moving average salary quoted in jobs citing Apple iOS in England.

Salary trend for Apple iOS in England

Apple iOS
Salary Histogram in England

Salary distribution for jobs citing Apple iOS in England over the 6 months to 29 May 2025.

Salary histogram for Apple iOS in England

Apple iOS
Job Locations in England

The table below looks at the demand and provides a guide to the median salaries quoted in IT jobs citing Apple iOS within the England region over the 6 months to 29 May 2025. The 'Rank Change' column provides an indication of the change in demand within each location based on the same 6 month period last year.

Location Rank Change
on Same Period
Last Year
Matching
Permanent
IT Job Ads
Median Salary
Past 6 Months
Median Salary
% Change
on Same Period
Last Year
Live
Jobs
London +22 131 £63,500 -2.31% 180
South East -20 71 £57,500 +64.29% 400
Midlands -40 52 £35,000 +7.69% 235
South West +64 40 £67,500 +50.00% 140
West Midlands +39 37 £47,500 +46.15% 131
East of England -20 20 £32,500 -7.14% 186
North of England -143 16 £65,000 +44.44% 295
East Midlands -52 15 £35,000 +12.90% 90
North West -140 13 £75,000 +57.89% 156
North East +47 2 £45,000 -18.18% 33
Yorkshire +1 1 £50,000 +40.85% 107
Apple iOS
UK

Apple iOS
Co-occurring Skills and Capabilities in England by Category

The follow tables expand on the table above by listing co-occurrences grouped by category. The same employment type, locality and period is covered with up to 20 co-occurrences shown in each of the following categories:

Application Platforms
1 38 (11.41%) SharePoint
2 22 (6.61%) Microsoft Exchange
3 4 (1.20%) IBM Domino
4 2 (0.60%) CMS
4 2 (0.60%) Confluence
5 1 (0.30%) Drupal
5 1 (0.30%) SharePoint Server
5 1 (0.30%) WordPress
Applications
1 34 (10.21%) Microsoft Office
2 8 (2.40%) Microsoft Excel
3 7 (2.10%) Microsoft PowerPoint
4 3 (0.90%) UserZoom
5 2 (0.60%) Acrobat
6 1 (0.30%) Adobe XD
6 1 (0.30%) Sketch
Business Applications
1 6 (1.80%) Dynamics NAV
1 6 (1.80%) NetSuite
1 6 (1.80%) SAP ERP
2 2 (0.60%) Shopify
Cloud Services
1 103 (30.93%) Microsoft 365
2 86 (25.83%) Azure
3 50 (15.02%) Entra ID
4 27 (8.11%) OneDrive
5 26 (7.81%) GitHub
6 18 (5.41%) AWS
7 14 (4.20%) Figma
8 11 (3.30%) Mimecast
9 8 (2.40%) Firebase
9 8 (2.40%) Google Workspace
10 7 (2.10%) GitHub Actions
11 6 (1.80%) Apigee
11 6 (1.80%) Google Docs
11 6 (1.80%) PaaS
12 5 (1.50%) Cloud Computing
13 4 (1.20%) Bitrise
13 4 (1.20%) Kibo
13 4 (1.20%) Nutanix
13 4 (1.20%) Power Platform
13 4 (1.20%) Vercel
Communications & Networking
1 36 (10.81%) Firewall
2 27 (8.11%) TCP/IP
3 24 (7.21%) DHCP
3 24 (7.21%) LAN
4 22 (6.61%) WAN
5 19 (5.71%) DNS
6 15 (4.50%) VPN
7 14 (4.20%) Wireless
8 10 (3.00%) Network Security
8 10 (3.00%) WLAN
9 9 (2.70%) Wi-Fi
10 8 (2.40%) HTTP
10 8 (2.40%) VoIP
11 7 (2.10%) SSL
11 7 (2.10%) VLAN
12 5 (1.50%) Internet
13 4 (1.20%) HTTPS
13 4 (1.20%) IPv4
13 4 (1.20%) WebEx
14 3 (0.90%) Remote Desktop
Database & Business Intelligence
1 17 (5.11%) NoSQL
2 15 (4.50%) PostgreSQL
3 12 (3.60%) DB2
3 12 (3.60%) MongoDB
4 6 (1.80%) GIS
4 6 (1.80%) SQL Server
5 4 (1.20%) MySQL
6 3 (0.90%) Relational Database
7 2 (0.60%) Amazon RDS
8 1 (0.30%) BigQuery
8 1 (0.30%) DynamoDB
8 1 (0.30%) Power BI
8 1 (0.30%) SQLite
Development Applications
1 25 (7.51%) Git
2 14 (4.20%) Appium
3 13 (3.90%) Xcode
4 12 (3.60%) Jenkins
5 8 (2.40%) GitLab
5 8 (2.40%) JIRA
6 7 (2.10%) Android Studio
6 7 (2.10%) Gradle
6 7 (2.10%) SonarQube
7 5 (1.50%) Cucumber
7 5 (1.50%) XCUITest
8 4 (1.20%) Selenium
8 4 (1.20%) SpecFlow
9 3 (0.90%) XCTest
10 2 (0.60%) Crashlytics
10 2 (0.60%) fastlane
11 1 (0.30%) Charles Proxy
11 1 (0.30%) git-flow
11 1 (0.30%) UI Automator
11 1 (0.30%) Visual Studio Code
General
1 122 (36.64%) Social Skills
2 60 (18.02%) Finance
3 36 (10.81%) Inclusion and Diversity
4 24 (7.21%) Games
5 21 (6.31%) Analytical Skills
6 20 (6.01%) Public Sector
7 16 (4.80%) Aviation
8 14 (4.20%) Law
9 13 (3.90%) Banking
10 12 (3.60%) Telecoms
11 11 (3.30%) Electronics
12 9 (2.70%) Marketing
13 7 (2.10%) Influencing Skills
14 5 (1.50%) Automotive
14 5 (1.50%) Documentation Skills
14 5 (1.50%) Legal
14 5 (1.50%) Pharmaceutical
14 5 (1.50%) Private Banking
15 4 (1.20%) Organisational Skills
15 4 (1.20%) Publishing
Job Titles
1 75 (22.52%) Developer
2 58 (17.42%) Senior
3 48 (14.41%) IT Support
4 44 (13.21%) Analyst
5 37 (11.11%) Lead
6 29 (8.71%) iOS Developer
7 23 (6.91%) Support Analyst
8 19 (5.71%) Android Developer
9 18 (5.41%) IT Engineer
9 18 (5.41%) Support Engineer
10 16 (4.80%) Software Engineer
11 15 (4.50%) Azure Engineer
11 15 (4.50%) IT Analyst
11 15 (4.50%) IT Support Analyst
11 15 (4.50%) IT Support Engineer
11 15 (4.50%) Senior Developer
12 13 (3.90%) Mobile Engineer
13 12 (3.60%) 3rd Line Engineer
13 12 (3.60%) Development Manager
13 12 (3.60%) Full-Stack Engineer
Libraries, Frameworks & Software Standards
1 38 (11.41%) React
2 31 (9.31%) React Native
3 23 (6.91%) SwiftUI
4 22 (6.61%) AngularJS
4 22 (6.61%) RESTful
5 18 (5.41%) REST
6 15 (4.50%) .NET
7 13 (3.90%) .NET Core
7 13 (3.90%) HTML
7 13 (3.90%) jQuery
8 12 (3.60%) Backbone.js
8 12 (3.60%) Bootstrap
8 12 (3.60%) Ember.js
8 12 (3.60%) UIKit
9 11 (3.30%) Android Jetpack
9 11 (3.30%) CSS
9 11 (3.30%) Flutter
9 11 (3.30%) Jetpack Compose
10 9 (2.70%) ASP.NET
10 9 (2.70%) Web Services
Miscellaneous
1 101 (30.33%) Mobile App
2 24 (7.21%) Algorithms
3 23 (6.91%) Data Structures
4 18 (5.41%) Product Ownership
5 17 (5.11%) Mobile Games
6 16 (4.80%) Greenfield Project
7 15 (4.50%) Self-Motivation
8 13 (3.90%) Hybrid Cloud
8 13 (3.90%) Onboarding
9 12 (3.60%) Educational Technology
10 11 (3.30%) e-Learning
11 10 (3.00%) Management Information System
12 9 (2.70%) iPad
12 9 (2.70%) iPhone
12 9 (2.70%) Video Conferencing
13 8 (2.40%) Driving Licence
14 7 (2.10%) Legacy Systems
14 7 (2.10%) Virtual Team
15 6 (1.80%) DataPower
15 6 (1.80%) Robotics
Operating Systems
1 214 (64.26%) Android
2 147 (44.14%) Windows
3 51 (15.32%) Mac OS
4 47 (14.11%) Windows 10
5 38 (11.41%) Windows Server
6 31 (9.31%) Linux
7 5 (1.50%) Windows Server 2016
8 4 (1.20%) Windows Server 2012
8 4 (1.20%) Windows Server 2019
9 2 (0.60%) Unix
10 1 (0.30%) VMS
Processes & Methodologies
1 98 (29.43%) Agile
2 89 (26.73%) Problem-Solving
3 87 (26.13%) User Experience
4 83 (24.92%) iOS Development
5 63 (18.92%) Mobile Development
6 55 (16.52%) Android Development
7 50 (15.02%) Customer Service
8 49 (14.71%) Mentoring
9 47 (14.11%) ITIL
10 42 (12.61%) CI/CD
11 41 (12.31%) Software Engineering
12 38 (11.41%) DevOps
13 35 (10.51%) Coaching
13 35 (10.51%) Test Automation
14 34 (10.21%) Computer Science
15 33 (9.91%) Migration
15 33 (9.91%) Roadmaps
16 28 (8.41%) Artificial Intelligence
16 28 (8.41%) SOLID
17 27 (8.11%) UX Design
Programming Languages
1 76 (22.82%) Swift
2 49 (14.71%) Java
3 39 (11.71%) Kotlin
4 36 (10.81%) JavaScript
5 29 (8.71%) TypeScript
6 27 (8.11%) Objective-C
7 24 (7.21%) SQL
8 21 (6.31%) C#
8 21 (6.31%) PowerShell
9 16 (4.80%) C++
10 15 (4.50%) Python
11 10 (3.00%) PHP
12 9 (2.70%) Dart
13 7 (2.10%) C
14 3 (0.90%) Go
15 2 (0.60%) Rust
16 1 (0.30%) BrightScript
16 1 (0.30%) VB
16 1 (0.30%) VBScript
Qualifications
1 40 (12.01%) Degree
2 16 (4.80%) Computer Science Degree
3 13 (3.90%) Microsoft Certification
4 11 (3.30%) DBS Check
4 11 (3.30%) SC Cleared
4 11 (3.30%) Security Cleared
5 7 (2.10%) Azure Certification
6 6 (1.80%) A+ Certification
6 6 (1.80%) ITIL Certification
7 4 (1.20%) Master's Degree
7 4 (1.20%) MCSA
7 4 (1.20%) Network+ Certification
8 3 (0.90%) BPSS Clearance
9 2 (0.60%) CompTIA Security+
9 2 (0.60%) ITIL Foundation Certificate
9 2 (0.60%) MCSE
9 2 (0.60%) NVQ Level 3
10 1 (0.30%) MCP
10 1 (0.30%) VMware Certified Professional (VCP)
Quality Assurance & Compliance
1 47 (14.11%) QA
2 26 (7.81%) ISO/IEC 27001
3 24 (7.21%) Accessibility
4 16 (4.80%) SLA
5 15 (4.50%) GDPR
6 9 (2.70%) Cyber Essentials
6 9 (2.70%) Cyber Essentials PLUS
6 9 (2.70%) WCAG
7 2 (0.60%) ISO 13485
7 2 (0.60%) ISO 9001
8 1 (0.30%) NCSC
System Software
1 83 (24.92%) Active Directory
2 12 (3.60%) VMware Infrastructure
3 10 (3.00%) Hyper-V
4 9 (2.70%) Virtual Desktop
5 6 (1.80%) Virtual Machines
6 5 (1.50%) Firmware
7 4 (1.20%) BitLocker
7 4 (1.20%) Docker
8 3 (0.90%) LXC
9 2 (0.60%) Embedded Firmware
10 1 (0.30%) Microsoft App-V
10 1 (0.30%) vSphere
Systems Management
1 52 (15.62%) Microsoft Intune
2 18 (5.41%) SCCM
3 8 (2.40%) AirWatch
4 7 (2.10%) Terraform
5 6 (1.80%) ArcSight ESM
5 6 (1.80%) QRadar
6 5 (1.50%) Jamf Pro
7 4 (1.20%) Failover Clustering
7 4 (1.20%) Kubernetes
8 1 (0.30%) Active Directory Federation Services
Vendors
1 109 (32.73%) Microsoft
2 67 (20.12%) Apple
3 18 (5.41%) IBM
3 18 (5.41%) VMware
4 16 (4.80%) Sophos
5 13 (3.90%) ServiceNow
6 12 (3.60%) Citrix
6 12 (3.60%) Red Hat
7 11 (3.30%) Samsung
8 10 (3.00%) Google
9 7 (2.10%) HP
9 7 (2.10%) McAfee
9 7 (2.10%) New Relic
9 7 (2.10%) SAP
10 6 (1.80%) ArcSight
10 6 (1.80%) LogLogic
10 6 (1.80%) OpenAI
10 6 (1.80%) Splunk
11 5 (1.50%) Barracuda Networks
12 4 (1.20%) MobileIron