Load Balancing Jobs in England

Load Balancing
UK > England

The table below provides summary statistics for permanent job vacancies advertised in England requiring Load Balancing skills. It includes a benchmarking guide to the annual salaries offered in vacancies that cited Load Balancing over the 6 months leading up to 27 May 2025, comparing them to the same period in the previous two years.

6 months to
27 May 2025
Same period 2024 Same period 2023
Rank 600 597 517
Rank change year-on-year -3 -80 +128
Permanent jobs citing Load Balancing 68 259 444
As % of all permanent jobs advertised in England 0.14% 0.29% 0.51%
As % of the Processes & Methodologies category 0.15% 0.35% 0.53%
Number of salaries quoted 47 194 220
10th Percentile £44,000 £41,250 £37,410
25th Percentile £50,750 £50,000 £46,250
Median annual salary (50th Percentile) £60,000 £62,500 £57,500
Median % change year-on-year -4.00% +8.70% -7.26%
75th Percentile £85,000 £80,000 £83,375
90th Percentile £95,250 £92,500 £92,300
UK median annual salary £61,250 £62,500 £57,500
% change year-on-year -2.00% +8.70% -8.00%

All Process and Methodology Skills
England

Load Balancing falls under the Processes and Methodologies category. For comparison with the information above, the following table provides summary statistics for all permanent job vacancies requiring process or methodology skills in England.

Permanent vacancies with a requirement for process or methodology skills 45,377 74,348 83,355
As % of all permanent jobs advertised in England 94.05% 84.31% 95.58%
Number of salaries quoted 22,410 54,380 49,711
10th Percentile £29,750 £29,000 £34,452
25th Percentile £41,250 £40,000 £46,105
Median annual salary (50th Percentile) £57,500 £55,000 £62,500
Median % change year-on-year +4.55% -12.00% +4.17%
75th Percentile £75,000 £72,500 £82,500
90th Percentile £98,750 £93,750 £102,500
UK median annual salary £57,500 £55,000 £61,000
% change year-on-year +4.55% -9.84% +1.67%

Load Balancing
Job Vacancy Trend in England

Job postings citing Load Balancing as a proportion of all IT jobs advertised in England.
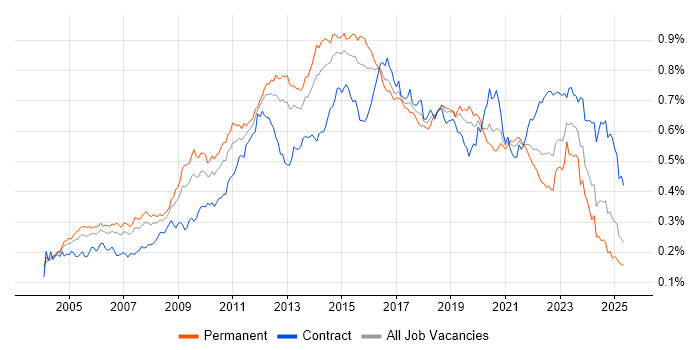
Job vacancy trend for Load Balancing in England

Load Balancing
Salary Trend in England

3-month moving average salary quoted in jobs citing Load Balancing in England.

Salary trend for Load Balancing in England

Load Balancing
Salary Histogram in England

Salary distribution for jobs citing Load Balancing in England over the 6 months to 27 May 2025.

Salary histogram for Load Balancing in England

Load Balancing
Job Locations in England

The table below looks at the demand and provides a guide to the median salaries quoted in IT jobs citing Load Balancing within the England region over the 6 months to 27 May 2025. The 'Rank Change' column provides an indication of the change in demand within each location based on the same 6 month period last year.

Location Rank Change
on Same Period
Last Year
Matching
Permanent
IT Job Ads
Median Salary
Past 6 Months
Median Salary
% Change
on Same Period
Last Year
Live
Jobs
London +60 34 £65,000 -18.75% 62
South East +58 11 £67,500 +20.00% 56
Midlands +17 10 £49,844 -5.06% 29
West Midlands +30 9 £46,000 -12.38% 20
North of England +21 6 £75,000 +25.00% 52
Yorkshire +53 5 £75,000 +22.45% 22
South West +86 3 £46,250 +2.78% 26
East of England +27 2 £65,000 +26.83% 21
East Midlands +28 1 £60,000 +20.00% 7
North West -16 1 £47,500 -20.83% 26
Load Balancing
UK

Load Balancing
Co-occurring Skills and Capabilities in England by Category

The follow tables expand on the table above by listing co-occurrences grouped by category. The same employment type, locality and period is covered with up to 20 co-occurrences shown in each of the following categories:

Application Platforms
1 7 (10.29%) Microsoft Exchange
2 5 (7.35%) nginx
3 4 (5.88%) Apache
3 4 (5.88%) SharePoint
3 4 (5.88%) Tomcat
4 2 (2.94%) Skype for Business
5 1 (1.47%) Apache Spark
5 1 (1.47%) IIS
5 1 (1.47%) JBoss
5 1 (1.47%) WebSphere
Applications
1 8 (11.76%) Microsoft Office
1 8 (11.76%) MS Visio
2 1 (1.47%) AutoCAD
Business Applications
1 1 (1.47%) Payment Gateway
Cloud Services
1 30 (44.12%) AWS
1 30 (44.12%) Azure
2 16 (23.53%) GCP
3 10 (14.71%) Entra ID
4 8 (11.76%) Microsoft 365
5 7 (10.29%) SaaS
6 6 (8.82%) Amazon EC2
6 6 (8.82%) IaaS
6 6 (8.82%) PaaS
7 5 (7.35%) Azure Storage
8 4 (5.88%) AWS CloudFormation
8 4 (5.88%) Azure App Service
8 4 (5.88%) Azure Sentinel
8 4 (5.88%) Azure Table
8 4 (5.88%) Microsoft Purview
8 4 (5.88%) OCI
8 4 (5.88%) Route 53
9 3 (4.41%) Amazon CloudWatch
9 3 (4.41%) Virtual Private Cloud
10 2 (2.94%) OneDrive
Communications & Networking
1 33 (48.53%) Firewall
2 25 (36.76%) VPN
3 19 (27.94%) DNS
4 17 (25.00%) Network Security
5 16 (23.53%) WAN
6 14 (20.59%) LAN
6 14 (20.59%) VLAN
7 13 (19.12%) SD-WAN
8 10 (14.71%) TCP/IP
9 8 (11.76%) BGP
9 8 (11.76%) OSPF
10 7 (10.29%) Ethernet VPN
10 7 (10.29%) Wi-Fi
11 6 (8.82%) DHCP
11 6 (8.82%) MPLS
12 5 (7.35%) HTTPS
12 5 (7.35%) Wireless
13 4 (5.88%) Internet
13 4 (5.88%) IPsec
13 4 (5.88%) Multicast
Database & Business Intelligence
1 7 (10.29%) MySQL
2 6 (8.82%) SQL Server
3 5 (7.35%) PostgreSQL
4 4 (5.88%) BigQuery
5 3 (4.41%) Amazon RDS
6 1 (1.47%) Azure SQL Database
6 1 (1.47%) Endeca
6 1 (1.47%) KDB
6 1 (1.47%) Kdb+
6 1 (1.47%) NoSQL
6 1 (1.47%) Power BI
6 1 (1.47%) RDBMS
6 1 (1.47%) Relational Database
6 1 (1.47%) SQL Server Integration Services
6 1 (1.47%) SQL Server Reporting Services
Development Applications
1 11 (16.18%) Git
2 6 (8.82%) Jenkins
3 3 (4.41%) GitLab
4 2 (2.94%) Maven
5 1 (1.47%) Ant
5 1 (1.47%) Artifactory
5 1 (1.47%) Atlassian Bamboo
5 1 (1.47%) Gradle
5 1 (1.47%) JIRA
5 1 (1.47%) Selenium
5 1 (1.47%) Sonatype Nexus
General
1 15 (22.06%) Banking
1 15 (22.06%) Social Skills
2 12 (17.65%) Finance
3 8 (11.76%) Documentation Skills
4 7 (10.29%) Telecoms
5 6 (8.82%) Inclusion and Diversity
6 5 (7.35%) Analytical Skills
7 4 (5.88%) Law
8 2 (2.94%) Marketing
8 2 (2.94%) Public Sector
8 2 (2.94%) Retail
9 1 (1.47%) Police
Job Titles
1 22 (32.35%) Network Engineer
2 14 (20.59%) Cloud Engineer
3 13 (19.12%) Senior
4 10 (14.71%) Infrastructure Engineer
4 10 (14.71%) Lead
5 8 (11.76%) Azure Engineer
6 7 (10.29%) Cloud Infrastructure Engineer
7 6 (8.82%) Azure Infrastructure Engineer
8 5 (7.35%) 3rd Line Engineer
8 5 (7.35%) Lead Network Engineer
8 5 (7.35%) Support Engineer
9 4 (5.88%) 3rd Line Support
9 4 (5.88%) 3rd Line Support Engineer
9 4 (5.88%) Administrator
9 4 (5.88%) Architect
9 4 (5.88%) AWS Engineer
9 4 (5.88%) Platform Engineer
9 4 (5.88%) Systems Administrator
10 3 (4.41%) Cloud Platform Engineer
10 3 (4.41%) Senior Network Engineer
Libraries, Frameworks & Software Standards
1 5 (7.35%) .NET
1 5 (7.35%) Node.js
2 4 (5.88%) JSON
2 4 (5.88%) LAMP
3 3 (4.41%) LEMP Stack
4 2 (2.94%) .NET Framework
4 2 (2.94%) Elastic Stack
4 2 (2.94%) LAPP Stack
4 2 (2.94%) React
4 2 (2.94%) RESTful
4 2 (2.94%) XML
5 1 (1.47%) Classic ASP
5 1 (1.47%) CSS
5 1 (1.47%) HTML
5 1 (1.47%) LDAP
5 1 (1.47%) Middleware
5 1 (1.47%) OAuth
5 1 (1.47%) SAML
5 1 (1.47%) SOAP
5 1 (1.47%) Web Services
Miscellaneous
1 7 (10.29%) Data Centre
1 7 (10.29%) Public Cloud
2 5 (7.35%) Hybrid Cloud
3 4 (5.88%) Greenfield Project
4 3 (4.41%) Management Information System
5 2 (2.94%) Cloud Native
5 2 (2.94%) Onboarding
5 2 (2.94%) Self-Motivation
5 2 (2.94%) Virtual Team
6 1 (1.47%) Clustering
6 1 (1.47%) Distributed Applications
6 1 (1.47%) Driving Licence
6 1 (1.47%) Legacy Applications
6 1 (1.47%) Legacy Code
6 1 (1.47%) Legacy Systems
6 1 (1.47%) Operational Technology
6 1 (1.47%) PKI
6 1 (1.47%) SCADA
6 1 (1.47%) Taxonomies
Operating Systems
1 17 (25.00%) Windows
2 14 (20.59%) Linux
3 11 (16.18%) Windows Server
4 3 (4.41%) CentOS
4 3 (4.41%) Rocky
5 2 (2.94%) Unix
5 2 (2.94%) Windows Server 2003
5 2 (2.94%) Windows Server 2019
6 1 (1.47%) Red Hat Enterprise Linux
6 1 (1.47%) Ubuntu
Processes & Methodologies
1 16 (23.53%) Problem-Solving
2 14 (20.59%) Change Management
2 14 (20.59%) CI/CD
2 14 (20.59%) DevOps
3 12 (17.65%) Infrastructure Engineering
4 10 (14.71%) Infrastructure as Code
4 10 (14.71%) Validation
5 8 (11.76%) Collaborative Culture
5 8 (11.76%) Disaster Recovery
5 8 (11.76%) Technical Leadership
6 7 (10.29%) Change Control
6 7 (10.29%) Configuration Management
6 7 (10.29%) Data Management
6 7 (10.29%) High Availability
6 7 (10.29%) Identity Access Management
6 7 (10.29%) Inventory Management
6 7 (10.29%) Network Design
6 7 (10.29%) Storage Management
7 6 (8.82%) Low Latency
7 6 (8.82%) Mentoring
Programming Languages
1 19 (27.94%) Python
2 16 (23.53%) SQL
3 13 (19.12%) PowerShell
4 8 (11.76%) Bash
5 5 (7.35%) Java
6 4 (5.88%) Go
6 4 (5.88%) JavaScript
7 3 (4.41%) PHP
8 2 (2.94%) C#
8 2 (2.94%) TypeScript
9 1 (1.47%) C
9 1 (1.47%) C++
9 1 (1.47%) Groovy
9 1 (1.47%) Scala
9 1 (1.47%) Shell Script
9 1 (1.47%) T-SQL
9 1 (1.47%) VB.NET
9 1 (1.47%) VBScript
Qualifications
1 14 (20.59%) Cisco Certification
2 13 (19.12%) Degree
3 12 (17.65%) CCNP
3 12 (17.65%) Security Cleared
4 9 (13.24%) Microsoft Certification
5 5 (7.35%) AWS Certification
5 5 (7.35%) Check Point Certification
5 5 (7.35%) CompTIA Security+
5 5 (7.35%) SC Cleared
6 4 (5.88%) Azure Certification
6 4 (5.88%) CCNA
7 3 (4.41%) CCIE
7 3 (4.41%) Computer Science Degree
7 3 (4.41%) DV Cleared
8 2 (2.94%) CCSA
8 2 (2.94%) CCSE
9 1 (1.47%) CEH
9 1 (1.47%) CISSP
9 1 (1.47%) DBS Check
9 1 (1.47%) OSCP
Quality Assurance & Compliance
1 4 (5.88%) QA
1 4 (5.88%) SLA
2 2 (2.94%) PCI DSS
3 1 (1.47%) GDPR
System Software
1 16 (23.53%) Active Directory
2 14 (20.59%) VMware Infrastructure
3 9 (13.24%) Docker
4 5 (7.35%) Virtual Machines
5 3 (4.41%) Hyper-V
6 2 (2.94%) Firmware
6 2 (2.94%) KVM
6 2 (2.94%) ProxySG
6 2 (2.94%) VMware ESXi
6 2 (2.94%) Xen
7 1 (1.47%) Squid
7 1 (1.47%) Virtual Desktop
7 1 (1.47%) VMware NSX
7 1 (1.47%) VMware Server
7 1 (1.47%) vSphere
Systems Management
1 15 (22.06%) Terraform
2 13 (19.12%) Ansible
3 12 (17.65%) Kubernetes
4 7 (10.29%) Microsoft Intune
5 4 (5.88%) FortiGate
5 4 (5.88%) SCCM
6 3 (4.41%) Nagios
6 3 (4.41%) Puppet
6 3 (4.41%) Red Hat Satellite
6 3 (4.41%) SCOM
7 2 (2.94%) CFEngine
7 2 (2.94%) Dell DRAC
7 2 (2.94%) Grafana
7 2 (2.94%) Progress Chef
7 2 (2.94%) SCOrch
7 2 (2.94%) SCSM
7 2 (2.94%) Single Sign-On
8 1 (1.47%) Podman
8 1 (1.47%) Prometheus
8 1 (1.47%) Proxmox
Vendors
1 17 (25.00%) Cisco
2 16 (23.53%) Microsoft
3 15 (22.06%) VMware
4 12 (17.65%) F5
5 11 (16.18%) CheckPoint
6 9 (13.24%) Fortinet
7 7 (10.29%) Google
8 5 (7.35%) SolarWinds
8 5 (7.35%) Veeam
9 4 (5.88%) Arista
9 4 (5.88%) Citrix
9 4 (5.88%) Palo Alto
10 3 (4.41%) Oracle
10 3 (4.41%) Red Hat
11 2 (2.94%) AlgoSec
11 2 (2.94%) Blue Coat
11 2 (2.94%) HP
11 2 (2.94%) Meraki
11 2 (2.94%) Rapid7
11 2 (2.94%) Riverbed