Bitbucket Jobs with Work from Home Options

Bitbucket
UK > Work from Home

The table below provides summary statistics for permanent job vacancies with an option to work from home (WFH) and a requirement for Bitbucket skills. Included is a benchmarking guide to the salaries offered in vacancies that have cited Bitbucket over the 6 months to 24 May 2024 with a comparison to the same period in the previous 2 years.

6 months to
24 May 2024
Same period 2023 Same period 2022
Rank 488 401 356
Rank change year-on-year -87 -45 +4
Permanent jobs citing Bitbucket 92 274 703
As % of all permanent jobs with a WFH option 0.27% 0.69% 0.98%
As % of the Development Applications category 2.41% 4.45% 3.99%
Number of salaries quoted 79 159 364
10th Percentile £42,250 £42,819 £38,750
25th Percentile £47,375 £55,625 £49,688
Median annual salary (50th Percentile) £58,500 £67,500 £60,000
Median % change year-on-year -13.33% +12.50% +4.35%
75th Percentile £67,500 £82,500 £83,000
90th Percentile £77,500 £95,000 £96,250
UK median annual salary £50,000 £70,000 £65,000
% change year-on-year -28.57% +7.69% +4.00%

All Development Application Skills
Work from Home

Bitbucket is in the Development Applications category. The following table is for comparison with the above and provides summary statistics for all permanent job vacancies with a WFH option and a requirement for development application skills.

Permanent vacancies with a requirement for development application skills 3,825 6,156 17,627
As % of all permanent jobs with a WFH option 11.24% 15.42% 24.51%
Number of salaries quoted 2,939 4,312 8,412
10th Percentile £37,500 £41,250 £37,750
25th Percentile £46,250 £50,000 £46,250
Median annual salary (50th Percentile) £60,000 £64,500 £60,000
Median % change year-on-year -6.98% +7.50% +9.09%
75th Percentile £75,772 £80,000 £78,563
90th Percentile £91,934 £95,000 £92,500
UK median annual salary £59,925 £65,000 £62,500
% change year-on-year -7.81% +4.00% +9.65%

Bitbucket
Trend for Jobs with a WFH Option

Job vacancies with a work from home option citing Bitbucket as a proportion of all IT jobs advertised.
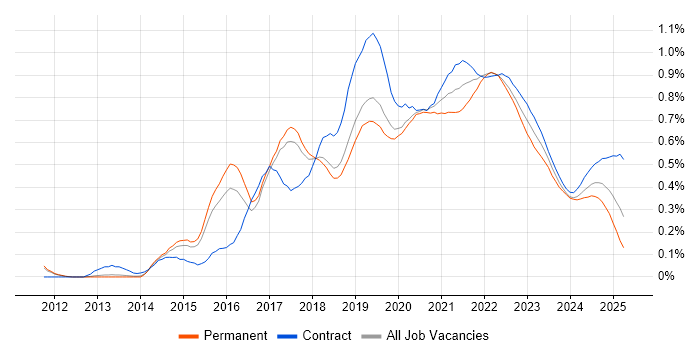
Bitbucket trend for jobs with a WFH option

Bitbucket
Salary Trend for Jobs with a WFH Option

3-month moving average salary quoted in job vacancies with a work from home option citing Bitbucket.

Bitbucket salary trend for jobs with a WFH option

Bitbucket
Salary Histogram for Jobs with a WFH Option

Salary distribution for jobs with a work from home option citing Bitbucket over the 6 months to 24 May 2024.

Bitbucket salary histogram for jobs with a WFH option

Bitbucket
Co-occurring Skills and Capabilities with WFH Options by Category

The follow tables expand on the table above by listing co-occurrences grouped by category. The same employment type, locality and period is covered with up to 20 co-occurrences shown in each of the following categories:

Application Platforms
1 36 (39.13%) Confluence
2 4 (4.35%) Apache
2 4 (4.35%) Apache Airflow
2 4 (4.35%) Apache Spark
3 3 (3.26%) IIS
4 2 (2.17%) Adobe Experience Manager
5 1 (1.09%) CMS
5 1 (1.09%) Umbraco
Applications
1 2 (2.17%) Microsoft Office
2 1 (1.09%) 1Password
2 1 (1.09%) Simulink
Business Applications
1 1 (1.09%) Magento
Cloud Services
1 48 (52.17%) AWS
2 25 (27.17%) GitHub
3 18 (19.57%) AWS Lambda
3 18 (19.57%) Azure
3 18 (19.57%) Serverless
4 16 (17.39%) AWS CloudFormation
5 14 (15.22%) Amazon S3
6 11 (11.96%) Amazon Kinesis
7 10 (10.87%) Amazon EC2
8 7 (7.61%) Route 53
8 7 (7.61%) Virtual Private Cloud
9 6 (6.52%) Amazon EKS
10 5 (5.43%) Azure DevOps
10 5 (5.43%) GCP
10 5 (5.43%) Microsoft 365
10 5 (5.43%) SaaS
11 4 (4.35%) Amazon CloudWatch
11 4 (4.35%) Amazon SQS
11 4 (4.35%) AWS CodePipeline
11 4 (4.35%) AWS KMS
Communications & Networking
1 5 (5.43%) VPN
2 3 (3.26%) DNS
2 3 (3.26%) HTTPS
2 3 (3.26%) MQTT
3 2 (2.17%) Firewall
3 2 (2.17%) Internet
4 1 (1.09%) OpenVPN
4 1 (1.09%) Wi-Fi
Database & Business Intelligence
1 23 (25.00%) MySQL
2 11 (11.96%) DynamoDB
3 10 (10.87%) Amazon RDS
4 4 (4.35%) MongoDB
4 4 (4.35%) PostgreSQL
5 3 (3.26%) Amazon Aurora
6 2 (2.17%) SQL Server
7 1 (1.09%) Redis
7 1 (1.09%) SQL Server Integration Services
Development Applications
1 48 (52.17%) JIRA
2 35 (38.04%) Git
3 28 (30.43%) Jenkins
4 10 (10.87%) Sonatype Nexus
5 9 (9.78%) Subversion
6 7 (7.61%) Android Studio
6 7 (7.61%) SonarQube
7 6 (6.52%) Selenium
8 5 (5.43%) Cucumber
8 5 (5.43%) GitLab
8 5 (5.43%) JMeter
9 4 (4.35%) Eclipse
9 4 (4.35%) Octopus Deploy
10 3 (3.26%) Bitbucket Server
10 3 (3.26%) Cypress.io
10 3 (3.26%) PHPUnit
10 3 (3.26%) Robot Framework
10 3 (3.26%) Serenity BDD
10 3 (3.26%) SoapUI
11 2 (2.17%) REST Assured
General
1 28 (30.43%) Social Skills
2 5 (5.43%) Finance
2 5 (5.43%) Law
3 4 (4.35%) Legal
3 4 (4.35%) Music Industry
3 4 (4.35%) Public Sector
3 4 (4.35%) Retail
4 3 (3.26%) Aerospace
4 3 (3.26%) Analytical Skills
4 3 (3.26%) Banking
5 2 (2.17%) Inclusion and Diversity
6 1 (1.09%) Back Office
6 1 (1.09%) Games
6 1 (1.09%) Marketing
6 1 (1.09%) Organisational Skills
Job Titles
1 41 (44.57%) Developer
2 34 (36.96%) Senior
3 25 (27.17%) Senior Developer
4 13 (14.13%) AWS Engineer
5 11 (11.96%) Cloud Engineer
6 10 (10.87%) Node.js Developer
7 9 (9.78%) Platform Engineer
8 8 (8.70%) Automation Engineer
8 8 (8.70%) Cloud Platform Engineer
8 8 (8.70%) Hardware Engineer
8 8 (8.70%) Hardware Test Engineer
8 8 (8.70%) Test Engineer
9 7 (7.61%) Android Developer
9 7 (7.61%) AWS Platform Engineer
9 7 (7.61%) Cloud Automation Engineer
9 7 (7.61%) Senior Android Developer
9 7 (7.61%) Tester
10 6 (6.52%) Full Stack Developer
11 5 (5.43%) AWS Infrastructure Engineer
11 5 (5.43%) JIRA Engineer
Libraries, Frameworks & Software Standards
1 14 (15.22%) REST
2 12 (13.04%) AngularJS
3 11 (11.96%) .NET
3 11 (11.96%) Node.js
4 10 (10.87%) RESTful
5 9 (9.78%) CSS
6 7 (7.61%) Android Jetpack
7 6 (6.52%) Elastic Stack
7 6 (6.52%) Sass
8 4 (4.35%) .NET Framework
8 4 (4.35%) ASP.NET Web API
8 4 (4.35%) HTML
8 4 (4.35%) Jetpack Compose
8 4 (4.35%) React
8 4 (4.35%) SOAP
8 4 (4.35%) Web Services
9 3 (3.26%) ASP.NET
9 3 (3.26%) AWS CDK
9 3 (3.26%) Tailwind CSS
9 3 (3.26%) Vue
Miscellaneous
1 12 (13.04%) Greenfield Project
2 9 (9.78%) Distributed Systems
2 9 (9.78%) Enterprise Software
3 3 (3.26%) PMI
4 2 (2.17%) Cyber Threat
4 2 (2.17%) Self-Motivation
5 1 (1.09%) 3D Graphics
5 1 (1.09%) Blog
5 1 (1.09%) Cyber Defence
5 1 (1.09%) Hybrid Cloud
5 1 (1.09%) IoT
5 1 (1.09%) iPhone
5 1 (1.09%) Legacy Systems
5 1 (1.09%) Linux Command Line
5 1 (1.09%) Management Information System
5 1 (1.09%) Mobile App
5 1 (1.09%) Onboarding
5 1 (1.09%) Product Ownership
5 1 (1.09%) Virtual Team
5 1 (1.09%) YubiKey
Operating Systems
1 13 (14.13%) Windows
2 10 (10.87%) Linux
3 8 (8.70%) Android
4 5 (5.43%) Windows Server
5 2 (2.17%) Mac OS
6 1 (1.09%) Apple iOS
6 1 (1.09%) Embedded Linux
6 1 (1.09%) Ubuntu
6 1 (1.09%) VxWorks
Processes & Methodologies
1 52 (56.52%) Agile
2 41 (44.57%) CI/CD
3 27 (29.35%) Test Automation
4 22 (23.91%) Software Engineering
5 21 (22.83%) DevOps
6 18 (19.57%) Infrastructure as Code
7 15 (16.30%) Software Testing
7 15 (16.30%) Test Management
8 13 (14.13%) Migration
8 13 (14.13%) Scrum
9 12 (13.04%) Data Migration
9 12 (13.04%) Design Patterns
10 11 (11.96%) Problem-Solving
11 10 (10.87%) Full Stack Development
12 9 (9.78%) Continuous Improvement
12 9 (9.78%) Infrastructure Management
12 9 (9.78%) Platform Engineering
12 9 (9.78%) User Experience
13 8 (8.70%) Configuration Management
13 8 (8.70%) MVC
Programming Languages
1 25 (27.17%) Python
2 19 (20.65%) Java
2 19 (20.65%) JavaScript
3 12 (13.04%) SQL
4 11 (11.96%) C#
5 8 (8.70%) TypeScript
6 7 (7.61%) Kotlin
7 6 (6.52%) PHP
7 6 (6.52%) PowerShell
8 5 (5.43%) C
8 5 (5.43%) C++
9 4 (4.35%) Ruby
9 4 (4.35%) Rust
10 3 (3.26%) Bash
10 3 (3.26%) Go
10 3 (3.26%) Groovy
10 3 (3.26%) VBA
11 2 (2.17%) PL/SQL
11 2 (2.17%) VB
12 1 (1.09%) T-SQL
Qualifications
1 12 (13.04%) Security Cleared
2 7 (7.61%) Degree
3 6 (6.52%) SC Cleared
4 4 (4.35%) Computer Science Degree
4 4 (4.35%) DV Cleared
5 3 (3.26%) Master's Degree
5 3 (3.26%) PMI Certification
6 1 (1.09%) BPSS Clearance
Quality Assurance & Compliance
1 14 (15.22%) QA
2 12 (13.04%) ISO 9001
3 2 (2.17%) Cyber Essentials
3 2 (2.17%) PCI DSS
3 2 (2.17%) SLA
4 1 (1.09%) Accessibility
4 1 (1.09%) GDPR
4 1 (1.09%) MISRA
4 1 (1.09%) MISRA C
4 1 (1.09%) NIST
System Software
1 17 (18.48%) Docker
2 2 (2.17%) Virtual Servers
3 1 (1.09%) Firmware
Systems Management
1 27 (29.35%) Terraform
2 16 (17.39%) Kubernetes
3 10 (10.87%) Ansible
3 10 (10.87%) Packer
4 3 (3.26%) Consul
4 3 (3.26%) Prometheus
4 3 (3.26%) Puppet
5 2 (2.17%) Progress Chef
5 2 (2.17%) Salt
Vendors
1 16 (17.39%) Atlassian
2 12 (13.04%) Microsoft
3 6 (6.52%) Oracle
4 5 (5.43%) Splunk
5 4 (4.35%) Google
5 4 (4.35%) New Relic
6 3 (3.26%) Adobe
6 3 (3.26%) Coverity
6 3 (3.26%) Dynatrace
6 3 (3.26%) PayPal
6 3 (3.26%) Rackspace
6 3 (3.26%) SolarWinds
6 3 (3.26%) Telerik
6 3 (3.26%) WorldPay
7 1 (1.09%) Apple
7 1 (1.09%) CA
7 1 (1.09%) Dell
7 1 (1.09%) Perforce