PRINCE2 Jobs in England

PRINCE 2
UK > England

The table below provides summary statistics for permanent job vacancies advertised in England requiring PRINCE2 skills. It includes a benchmarking guide to the annual salaries offered in vacancies that cited PRINCE2 over the 6 months leading up to 31 May 2025, comparing them to the same period in the previous two years.

6 months to
31 May 2025
Same period 2024 Same period 2023
Rank 283 179 198
Rank change year-on-year -104 +19 +31
Permanent jobs citing PRINCE2 538 1,391 1,584
As % of all permanent jobs advertised in England 1.09% 1.55% 1.86%
As % of the Processes & Methodologies category 1.16% 1.84% 1.95%
Number of salaries quoted 385 1,118 1,168
10th Percentile £39,929 £37,199 £41,000
25th Percentile £49,749 £43,259 £48,204
Median annual salary (50th Percentile) £62,500 £53,200 £60,000
Median % change year-on-year +17.48% -11.33% +9.09%
75th Percentile £75,000 £64,750 £70,000
90th Percentile £87,500 £80,000 £80,000
UK median annual salary £65,000 £53,150 £60,000
% change year-on-year +22.30% -11.42% +9.09%

All Process and Methodology Skills
England

PRINCE2 falls under the Processes and Methodologies category. For comparison with the information above, the following table provides summary statistics for all permanent job vacancies requiring process or methodology skills in England.

Permanent vacancies with a requirement for process or methodology skills 46,342 75,409 81,364
As % of all permanent jobs advertised in England 93.97% 83.96% 95.53%
Number of salaries quoted 23,102 54,812 48,959
10th Percentile £29,250 £29,000 £34,452
25th Percentile £41,250 £40,000 £46,000
Median annual salary (50th Percentile) £57,500 £55,000 £62,500
Median % change year-on-year +4.55% -12.00% +4.17%
75th Percentile £75,000 £72,500 £82,500
90th Percentile £97,528 £93,750 £102,500
UK median annual salary £57,000 £55,000 £60,899
% change year-on-year +3.64% -9.69% +1.50%

PRINCE2
Job Vacancy Trend in England

Job postings citing PRINCE2 as a proportion of all IT jobs advertised in England.
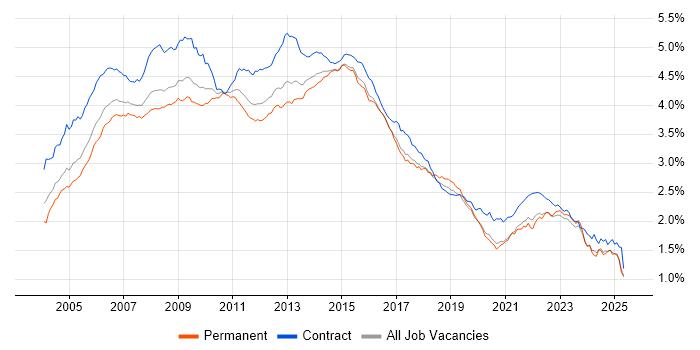
Job vacancy trend for PRINCE2 in England

PRINCE2
Salary Trend in England

3-month moving average salary quoted in jobs citing PRINCE2 in England.

Salary trend for PRINCE2 in England

PRINCE2
Salary Histogram in England

Salary distribution for jobs citing PRINCE2 in England over the 6 months to 31 May 2025.

Salary histogram for PRINCE2 in England

PRINCE2
Job Locations in England

The table below looks at the demand and provides a guide to the median salaries quoted in IT jobs citing PRINCE2 within the England region over the 6 months to 31 May 2025. The 'Rank Change' column provides an indication of the change in demand within each location based on the same 6 month period last year.

Location Rank Change
on Same Period
Last Year
Matching
Permanent
IT Job Ads
Median Salary
Past 6 Months
Median Salary
% Change
on Same Period
Last Year
Live
Jobs
London -17 147 £65,000 +5.69% 213
North of England -78 134 £62,500 +19.05% 87
South East -57 93 £65,000 +24.05% 116
Midlands -49 81 £50,000 -8.59% 67
North West -92 77 £65,000 +18.18% 50
Yorkshire +41 56 £55,000 +7.32% 26
East of England -8 56 £52,000 -5.45% 24
West Midlands -26 49 £51,447 +8.31% 43
East Midlands +11 28 £47,000 -10.48% 24
South West -7 6 £62,500 +25.00% 26
North East -7 1 £59,000 +21.07% 11
PRINCE2
UK

PRINCE2
Co-occurring Skills and Capabilities in England by Category

The follow tables expand on the table above by listing co-occurrences grouped by category. The same employment type, locality and period is covered with up to 20 co-occurrences shown in each of the following categories:

Application Platforms
1 18 (3.35%) SharePoint
2 8 (1.49%) CMS
2 8 (1.49%) Microsoft Exchange
3 7 (1.30%) Confluence
3 7 (1.30%) Kentico
4 4 (0.74%) IIS
5 3 (0.56%) Apache
6 2 (0.37%) ThingWorx
7 1 (0.19%) Skype for Business
Applications
1 73 (13.57%) Microsoft Project
2 38 (7.06%) Microsoft Office
3 26 (4.83%) Microsoft Excel
4 21 (3.90%) Trello
5 20 (3.72%) MS Visio
6 16 (2.97%) Microsoft PowerPoint
7 2 (0.37%) Spreadsheet
8 1 (0.19%) AutoCAD
8 1 (0.19%) Revit
Business Applications
1 8 (1.49%) Oracle ERP
2 6 (1.12%) Elite 3E
3 5 (0.93%) SAP S/4HANA
4 4 (0.74%) CA PPM
5 3 (0.56%) Dynamics CRM
6 2 (0.37%) Adobe Campaign
6 2 (0.37%) NetSuite
7 1 (0.19%) Dynamics NAV
7 1 (0.19%) iTrent
7 1 (0.19%) Primavera
7 1 (0.19%) Salesforce CRM
7 1 (0.19%) Teamcenter
7 1 (0.19%) Workday HCM
Cloud Services
1 51 (9.48%) Azure
2 44 (8.18%) SaaS
3 34 (6.32%) Microsoft 365
4 19 (3.53%) Azure DevOps
5 14 (2.60%) Power Platform
6 11 (2.04%) Google Workspace
7 10 (1.86%) Entra ID
7 10 (1.86%) Smartsheet
8 9 (1.67%) IaaS
9 7 (1.30%) Dynamics 365
9 7 (1.30%) Kontent
10 5 (0.93%) Mimecast
11 4 (0.74%) AWS
12 3 (0.56%) Asana
12 3 (0.56%) BigCommerce
12 3 (0.56%) Google Sheets
12 3 (0.56%) Lucidchart
12 3 (0.56%) OneDrive
12 3 (0.56%) Storyblok
12 3 (0.56%) SuccessFactors
Communications & Networking
1 14 (2.60%) WAN
2 10 (1.86%) LAN
3 9 (1.67%) Firewall
3 9 (1.67%) Wireless
4 8 (1.49%) DNS
5 7 (1.30%) VPN
6 6 (1.12%) DHCP
7 5 (0.93%) IPsec
7 5 (0.93%) Network Security
8 4 (0.74%) SD-WAN
9 3 (0.56%) Unified Communications
9 3 (0.56%) VoIP
10 2 (0.37%) MPLS
10 2 (0.37%) OSPF
10 2 (0.37%) SAN
11 1 (0.19%) BGP
11 1 (0.19%) Internet
11 1 (0.19%) PBX
11 1 (0.19%) VRRP
11 1 (0.19%) WLAN
Database & Business Intelligence
1 23 (4.28%) SQL Server
2 19 (3.53%) Electronic Patient Records
3 14 (2.60%) Power BI
4 8 (1.49%) PostgreSQL
5 4 (0.74%) Data Warehouse
6 2 (0.37%) GIS
6 2 (0.37%) Tableau
7 1 (0.19%) Big Data
7 1 (0.19%) Geospatial Data
7 1 (0.19%) Oracle BI Publisher
7 1 (0.19%) Relational Database
Development Applications
1 74 (13.75%) JIRA
2 4 (0.74%) Katalon Studio
2 4 (0.74%) Selenium
General
1 253 (47.03%) Social Skills
2 178 (33.09%) Finance
3 97 (18.03%) Analytical Skills
4 54 (10.04%) Law
5 47 (8.74%) Public Sector
6 33 (6.13%) Organisational Skills
7 29 (5.39%) Marketing
8 20 (3.72%) Legal
9 19 (3.53%) Health Technology
9 19 (3.53%) Retail
10 17 (3.16%) Presentation Skills
11 16 (2.97%) Manufacturing
12 14 (2.60%) Banking
13 13 (2.42%) Inclusion and Diversity
14 12 (2.23%) Influencing Skills
14 12 (2.23%) Local Government
15 6 (1.12%) French Language
16 5 (0.93%) Military
16 5 (0.93%) Public Speaking
16 5 (0.93%) Telecoms
Job Titles
1 238 (44.24%) Project Manager
2 51 (9.48%) IT Manager
3 49 (9.11%) Senior
4 48 (8.92%) Analyst
5 45 (8.36%) Programme Manager
6 43 (7.99%) IT Project Manager
7 41 (7.62%) Senior Manager
8 36 (6.69%) Senior Project Manager
9 31 (5.76%) Lead
10 24 (4.46%) Infrastructure Manager
11 21 (3.90%) Head of IT
12 18 (3.35%) Business Analyst
13 17 (3.16%) EPR Project Manager
14 16 (2.97%) Delivery Project Manager
15 15 (2.79%) Head of Delivery
16 14 (2.60%) Applications Manager
16 14 (2.60%) Delivery Manager
17 13 (2.42%) ERP Manager
18 12 (2.23%) Applications Support Manager
18 12 (2.23%) Support Manager
Libraries, Frameworks & Software Standards
1 3 (0.56%) .NET
2 2 (0.37%) CSS
2 2 (0.37%) EDI
2 2 (0.37%) HTML
2 2 (0.37%) JSON
3 1 (0.19%) .NET Framework
3 1 (0.19%) AngularJS
3 1 (0.19%) ASP.NET
3 1 (0.19%) Middleware
3 1 (0.19%) MSMQ
3 1 (0.19%) Oracle Fusion
3 1 (0.19%) React
3 1 (0.19%) Restlet
3 1 (0.19%) XML
Miscellaneous
1 27 (5.02%) Analytical Mindset
2 25 (4.65%) PMI
3 21 (3.90%) Social Media
4 20 (3.72%) Product Ownership
5 19 (3.53%) Management Information System
6 17 (3.16%) Driving Licence
7 16 (2.97%) Self-Motivation
8 15 (2.79%) Onboarding
9 13 (2.42%) Data Centre
10 8 (1.49%) Enterprise Software
11 7 (1.30%) Virtual Team
12 6 (1.12%) IoT
13 5 (0.93%) Legacy Systems
13 5 (0.93%) NHS
14 4 (0.74%) Legacy Applications
15 3 (0.56%) Cloud Native
15 3 (0.56%) Industrial Internet of Things
15 3 (0.56%) Operational Technology
15 3 (0.56%) SCADA
15 3 (0.56%) Security Posture
Operating Systems
1 33 (6.13%) Windows
2 15 (2.79%) Windows Server
3 9 (1.67%) Linux
4 6 (1.12%) Windows Vista
5 2 (0.37%) Windows 10
6 1 (0.19%) Unix
Processes & Methodologies
1 407 (75.65%) Project Management
2 287 (53.35%) Agile
3 191 (35.50%) Project Delivery
4 163 (30.30%) Stakeholder Management
5 150 (27.88%) Problem-Solving
6 106 (19.70%) ITIL
7 101 (18.77%) Continuous Improvement
8 81 (15.06%) Process Improvement
8 81 (15.06%) Waterfall
9 80 (14.87%) Risk Management
10 78 (14.50%) Change Management
11 74 (13.75%) Scrum
12 66 (12.27%) Budget Management
13 60 (11.15%) Stakeholder Engagement
14 54 (10.04%) Cybersecurity
15 50 (9.29%) Programme Management
16 49 (9.11%) Roadmaps
17 47 (8.74%) Mentoring
18 43 (7.99%) Project Governance
19 42 (7.81%) ERP
Programming Languages
1 24 (4.46%) SQL
2 4 (0.74%) PowerShell
3 2 (0.37%) ABAP
3 2 (0.37%) C#
3 2 (0.37%) Java
3 2 (0.37%) JavaScript
3 2 (0.37%) PL/SQL
3 2 (0.37%) T-SQL
4 1 (0.19%) Python
4 1 (0.19%) R
4 1 (0.19%) VB.NET
Qualifications
1 154 (28.62%) Degree
1 154 (28.62%) PMP
2 149 (27.70%) PMI Certification
3 39 (7.25%) PRINCE2 Practitioner
4 32 (5.95%) Security Cleared
5 26 (4.83%) DBS Check
5 26 (4.83%) Master's Degree
6 18 (3.35%) CBAP
7 16 (2.97%) BPSS Clearance
7 16 (2.97%) ITIL Certification
8 14 (2.60%) Computer Science Degree
9 12 (2.23%) PRINCE2 Certification
9 12 (2.23%) SC Cleared
10 8 (1.49%) APMP
10 8 (1.49%) ISTQB
11 7 (1.30%) MAPM
12 6 (1.12%) DV Cleared
13 5 (0.93%) Cisco Certification
13 5 (0.93%) ISEB
13 5 (0.93%) Microsoft Certification
Quality Assurance & Compliance
1 52 (9.67%) PMO
2 48 (8.92%) QA
3 17 (3.16%) Accessibility
4 13 (2.42%) ISO/IEC 27001
5 11 (2.04%) GDPR
5 11 (2.04%) ISO 9001
6 10 (1.86%) P3O
7 6 (1.12%) GRC
7 6 (1.12%) GxP
8 5 (0.93%) Cyber Essentials
8 5 (0.93%) Data Quality
8 5 (0.93%) HIPAA
8 5 (0.93%) Sarbanes-Oxley
9 4 (0.74%) COBIT
10 3 (0.56%) PMBOK
10 3 (0.56%) SLA
11 2 (0.37%) NEBOSH
11 2 (0.37%) NIST
11 2 (0.37%) NIST 800
11 2 (0.37%) SOC 2
System Software
1 21 (3.90%) Active Directory
2 13 (2.42%) VMware Infrastructure
3 5 (0.93%) Hyper-V
4 1 (0.19%) Docker
4 1 (0.19%) Firmware
4 1 (0.19%) Virtual Machines
4 1 (0.19%) Virtual Servers
Systems Management
1 10 (1.86%) Microsoft Intune
2 4 (0.74%) Ansible
3 3 (0.56%) Kubernetes
4 2 (0.37%) CASB
4 2 (0.37%) FortiGate
4 2 (0.37%) RSA Archer
5 1 (0.19%) Amdocs OSS
5 1 (0.19%) Failover Clustering
5 1 (0.19%) Netcool
5 1 (0.19%) Terraform
5 1 (0.19%) WSUS
Vendors
1 121 (22.49%) Microsoft
2 24 (4.46%) Salesforce
3 22 (4.09%) SAP
4 17 (3.16%) YouTube
5 16 (2.97%) Google
6 15 (2.79%) ServiceNow
6 15 (2.79%) VMware
7 13 (2.42%) Facebook
8 10 (1.86%) Oracle
9 8 (1.49%) Cisco
10 7 (1.30%) Planview
11 5 (0.93%) Liquidlogic
11 5 (0.93%) Palo Alto
11 5 (0.93%) PeopleSoft
11 5 (0.93%) SolarWinds
12 4 (0.74%) Pegasus
12 4 (0.74%) Zoho
13 3 (0.56%) MobileIron
13 3 (0.56%) Workday
14 2 (0.37%) Snow