Programme Management Jobs in England

Programme Management (Program Management)
UK > England

The table below provides summary statistics for permanent job vacancies advertised in England requiring Programme Management skills. It includes a benchmarking guide to the annual salaries offered in vacancies that cited Programme Management over the 6 months leading up to 31 July 2025, comparing them to the same period in the previous two years.

6 months to
31 Jul 2025
Same period 2024 Same period 2023
Rank 391 350 336
Rank change year-on-year -41 -14 -58
Permanent jobs citing Programme Management 353 587 673
As % of all permanent jobs advertised in England 0.67% 0.76% 0.96%
As % of the Processes & Methodologies category 0.74% 0.92% 1.01%
Number of salaries quoted 234 285 504
10th Percentile £46,250 £35,000 £37,500
25th Percentile £49,371 £41,250 £51,250
Median annual salary (50th Percentile) £65,000 £60,000 £67,500
Median % change year-on-year +8.33% -11.11% +16.11%
75th Percentile £85,000 £75,000 £79,063
90th Percentile £98,750 £104,000 £99,738
UK median annual salary £65,000 £57,500 £66,000
% change year-on-year +13.04% -12.88% +13.53%

All Process and Methodology Skills
England

Programme Management falls under the Processes and Methodologies category. For comparison with the information above, the following table provides summary statistics for all permanent job vacancies requiring process or methodology skills in England.

Permanent vacancies with a requirement for process or methodology skills 47,412 63,461 66,551
As % of all permanent jobs advertised in England 89.75% 81.92% 95.23%
Number of salaries quoted 25,208 42,176 44,603
10th Percentile £28,000 £30,000 £33,750
25th Percentile £38,750 £40,000 £45,000
Median annual salary (50th Percentile) £55,000 £55,000 £62,000
Median % change year-on-year - -11.29% +3.33%
75th Percentile £75,000 £75,000 £81,250
90th Percentile £97,500 £95,000 £101,250
UK median annual salary £55,000 £55,000 £60,000
% change year-on-year - -8.33% -

Programme Management
Job Vacancy Trend in England

Job postings citing Programme Management as a proportion of all IT jobs advertised in England.
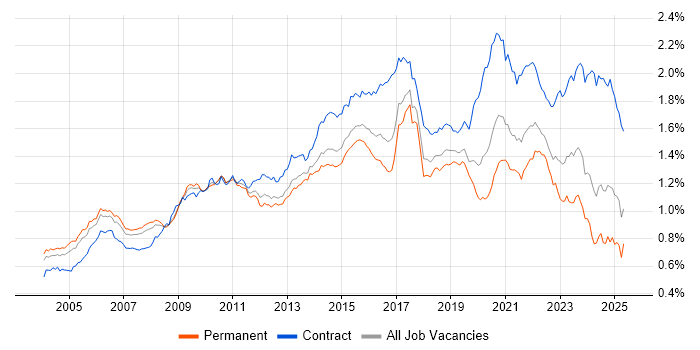
Job vacancy trend for Programme Management in England

Programme Management
Salary Trend in England

3-month moving average salary quoted in jobs citing Programme Management in England.

Salary trend for Programme Management in England

Programme Management
Salary Histogram in England

Salary distribution for jobs citing Programme Management in England over the 6 months to 31 July 2025.

Salary histogram for Programme Management in England

Programme Management
Job Locations in England

The table below looks at the demand and provides a guide to the median salaries quoted in IT jobs citing Programme Management within the England region over the 6 months to 31 July 2025. The 'Rank Change' column provides an indication of the change in demand within each location based on the same 6 month period last year.

Location Rank Change
on Same Period
Last Year
Matching
Permanent
IT Job Ads
Median Salary
Past 6 Months
Median Salary
% Change
on Same Period
Last Year
Live
Jobs
London +4 128 £70,000 - 366
South West +62 76 £50,000 -20.00% 38
South East -55 58 £61,250 -3.54% 48
North of England +7 37 £53,638 +7.28% 39
Midlands +15 28 £76,250 +74.29% 48
North West -20 25 £58,000 +9.76% 24
West Midlands +21 21 £55,000 +37.50% 36
East of England -25 15 £90,000 +68.05% 24
Yorkshire +24 12 £52,276 +4.55% 14
East Midlands +21 7 £82,500 +50.00% 12
Programme Management
UK

Programme Management
Co-occurring Skills and Capabilities in England by Category

The follow tables expand on the table above by listing co-occurrences grouped by category. The same employment type, locality and period is covered with up to 20 co-occurrences shown in each of the following categories:

Application Platforms
1 13 (3.68%) Confluence
2 4 (1.13%) SharePoint
3 3 (0.85%) IIS
4 2 (0.57%) Apache Airflow
4 2 (0.57%) Microsoft Exchange
4 2 (0.57%) ThingWorx
5 1 (0.28%) Apache Spark
5 1 (0.28%) CMS
5 1 (0.28%) Skype for Business
Applications
1 18 (5.10%) Microsoft PowerPoint
2 17 (4.82%) Microsoft Office
3 15 (4.25%) Microsoft Excel
4 13 (3.68%) Microsoft Project
5 1 (0.28%) AutoCAD
5 1 (0.28%) MS Visio
5 1 (0.28%) SOLIDWORKS
Business Applications
1 7 (1.98%) Primavera
2 2 (0.57%) SAP S/4HANA
3 1 (0.28%) Dynamics CRM
3 1 (0.28%) Lorenzo
3 1 (0.28%) Salesforce CRM
3 1 (0.28%) SystmOne
Cloud Services
1 32 (9.07%) Azure
2 24 (6.80%) AWS
3 20 (5.67%) GCP
4 17 (4.82%) Microsoft 365
5 13 (3.68%) Power Platform
6 8 (2.27%) SaaS
6 8 (2.27%) Serverless
7 7 (1.98%) AWS Lambda
8 5 (1.42%) Collibra
8 5 (1.42%) Microsoft Purview
9 3 (0.85%) Amazon SageMaker
9 3 (0.85%) Azure DevOps
10 2 (0.57%) Anthropic Claude
10 2 (0.57%) Azure Monitor
10 2 (0.57%) ChatGPT
10 2 (0.57%) Google Workspace
10 2 (0.57%) Microsoft Copilot
10 2 (0.57%) OCI
10 2 (0.57%) Slack
11 1 (0.28%) PaaS
Communications & Networking
1 29 (8.22%) Network Security
2 21 (5.95%) WAN
3 17 (4.82%) VPN
4 14 (3.97%) Wi-Fi
5 13 (3.68%) SD-WAN
6 10 (2.83%) LAN
7 9 (2.55%) Firewall
7 9 (2.55%) Junos
8 8 (2.27%) 5G
9 7 (1.98%) Wireless
10 5 (1.42%) IPsec
11 4 (1.13%) DHCP
11 4 (1.13%) DNS
11 4 (1.13%) Ethernet
12 3 (0.85%) Cisco IOS
12 3 (0.85%) VLAN
12 3 (0.85%) VoIP
13 2 (0.57%) MPLS
13 2 (0.57%) RS-485
14 1 (0.28%) WebEx
Database & Business Intelligence
1 18 (5.10%) PostgreSQL
2 13 (3.68%) NoSQL
3 12 (3.40%) Power BI
3 12 (3.40%) Tableau
4 11 (3.12%) RDBMS
4 11 (3.12%) Relational Database
5 5 (1.42%) SQL Server
6 4 (1.13%) MongoDB
7 3 (0.85%) Amazon RDS
8 2 (0.57%) Azure SQL Data Warehouse
8 2 (0.57%) Big Data
8 2 (0.57%) Data Warehouse
8 2 (0.57%) MySQL
8 2 (0.57%) Oracle Exadata
8 2 (0.57%) SQL Server Integration Services
9 1 (0.28%) Data Lake
9 1 (0.28%) Electronic Patient Records
9 1 (0.28%) Metadata
9 1 (0.28%) Oracle Database
9 1 (0.28%) SQLite
Development Applications
1 25 (7.08%) JIRA
2 8 (2.27%) Git
3 6 (1.70%) Jenkins
4 2 (0.57%) CMake
4 2 (0.57%) GitLab
4 2 (0.57%) Octopus Deploy
4 2 (0.57%) Subversion
4 2 (0.57%) TeamCity
5 1 (0.28%) Bitbucket
5 1 (0.28%) ClearCase
5 1 (0.28%) ClearQuest
5 1 (0.28%) Fiddler
5 1 (0.28%) MSBuild
5 1 (0.28%) Oracle APEX
5 1 (0.28%) Rational DOORS
5 1 (0.28%) WiX
5 1 (0.28%) Yeoman
General
1 222 (62.89%) Finance
2 151 (42.78%) Manufacturing
2 151 (42.78%) Public Sector
2 151 (42.78%) Social Skills
3 150 (42.49%) Marketing
4 146 (41.36%) Electronics
5 140 (39.66%) Telecoms
6 102 (28.90%) Analytical Skills
7 32 (9.07%) Inclusion and Diversity
8 27 (7.65%) Law
9 26 (7.37%) Organisational Skills
10 24 (6.80%) Presentation Skills
11 17 (4.82%) Banking
12 11 (3.12%) Retail
13 9 (2.55%) Aerospace
14 8 (2.27%) Financial Institution
14 8 (2.27%) Games
14 8 (2.27%) Influencing Skills
15 7 (1.98%) Pharmaceutical
15 7 (1.98%) Police
Job Titles
1 61 (17.28%) Programme Manager
2 58 (16.43%) Senior
3 44 (12.46%) Lead
4 40 (11.33%) IT Manager
5 32 (9.07%) Consultant
6 31 (8.78%) IT Support
7 27 (7.65%) IT Operations Manager
7 27 (7.65%) IT Support Manager
7 27 (7.65%) Operations Manager
7 27 (7.65%) Project Manager
7 27 (7.65%) Support Manager
8 25 (7.08%) Cybersecurity Consultant
8 25 (7.08%) Security Consultant
9 20 (5.67%) Senior Manager
10 15 (4.25%) Developer
10 15 (4.25%) Technical Leader
11 14 (3.97%) Architect
11 14 (3.97%) Technical Manager
12 12 (3.40%) Senior Developer
13 11 (3.12%) Python Developer
Libraries, Frameworks & Software Standards
1 16 (4.53%) FastAPI
2 12 (3.40%) Flask
2 12 (3.40%) REST
3 8 (2.27%) Node.js
4 6 (1.70%) Spring
4 6 (1.70%) Spring Boot
5 3 (0.85%) Django
5 3 (0.85%) HTML
5 3 (0.85%) Hugging Face
5 3 (0.85%) React
6 2 (0.57%) AngularJS
6 2 (0.57%) CSS
6 2 (0.57%) CSS3
6 2 (0.57%) HTML5
6 2 (0.57%) Middleware
6 2 (0.57%) OAuth
6 2 (0.57%) RESTful
6 2 (0.57%) TensorFlow
6 2 (0.57%) Vue
7 1 (0.28%) boto
Miscellaneous
1 26 (7.37%) Analytical Mindset
2 18 (5.10%) Self-Motivation
3 14 (3.97%) Product Ownership
4 10 (2.83%) Onboarding
5 9 (2.55%) Cloud Native
6 8 (2.27%) Self-Driving Car
7 7 (1.98%) Driving Licence
7 7 (1.98%) Enterprise Software
7 7 (1.98%) IoT
7 7 (1.98%) SCADA
8 6 (1.70%) Data Centre
8 6 (1.70%) Management Information System
9 5 (1.42%) FPGA
10 4 (1.13%) Embedded Systems
10 4 (1.13%) Operational Technology
10 4 (1.13%) Public Cloud
11 3 (0.85%) Data Protection Act
11 3 (0.85%) Hackathon
11 3 (0.85%) Hybrid Cloud
11 3 (0.85%) Industrial Internet of Things
Operating Systems
1 18 (5.10%) Windows
2 11 (3.12%) Linux
3 9 (2.55%) Windows Server
4 5 (1.42%) Mac OS
5 1 (0.28%) Android
5 1 (0.28%) Apple iOS
5 1 (0.28%) Robot Operating System
5 1 (0.28%) Solaris
Processes & Methodologies
1 141 (39.94%) Business Intelligence
2 137 (38.81%) Digital Marketing
3 118 (33.43%) Project Management
4 116 (32.86%) Problem-Solving
5 115 (32.58%) Agile
6 97 (27.48%) Project Delivery
7 87 (24.65%) Stakeholder Management
8 73 (20.68%) Cybersecurity
9 61 (17.28%) Mentoring
10 52 (14.73%) PRINCE2
11 43 (12.18%) Roadmaps
12 42 (11.90%) ITIL
13 41 (11.61%) Artificial Intelligence
13 41 (11.61%) Continuous Improvement
13 41 (11.61%) Risk Management
14 39 (11.05%) Decision-Making
15 37 (10.48%) Analytics
15 37 (10.48%) Change Management
15 37 (10.48%) Service Delivery
16 36 (10.20%) Strategic Planning
Programming Languages
1 37 (10.48%) Python
2 12 (3.40%) SQL
3 10 (2.83%) JavaScript
4 9 (2.55%) Java
5 8 (2.27%) TypeScript
6 7 (1.98%) PowerShell
7 6 (1.70%) C
7 6 (1.70%) C++
7 6 (1.70%) R
8 3 (0.85%) Bash
8 3 (0.85%) C#
9 2 (0.57%) PHP
10 1 (0.28%) Apex Code
10 1 (0.28%) PL/SQL
10 1 (0.28%) Rust
10 1 (0.28%) Shell Script
Qualifications
1 83 (23.51%) Security Cleared
2 82 (23.23%) Degree
3 63 (17.85%) PMP
4 59 (16.71%) PMI Certification
5 58 (16.43%) CISSP
6 29 (8.22%) SC Cleared
7 28 (7.93%) CEH
8 25 (7.08%) CompTIA Security+
9 23 (6.52%) Computer Science Degree
10 21 (5.95%) DV Cleared
11 12 (3.40%) Cisco Certification
11 12 (3.40%) Master's Degree
12 11 (3.12%) CCNP
13 10 (2.83%) CCNA
14 9 (2.55%) JNCIA
15 8 (2.27%) BPSS Clearance
16 6 (1.70%) HND
17 5 (1.42%) Azure Certification
17 5 (1.42%) MBA
18 4 (1.13%) AWS Certification
Quality Assurance & Compliance
1 54 (15.30%) QA
2 35 (9.92%) GDPR
3 34 (9.63%) PMO
4 33 (9.35%) ISO/IEC 27001
5 32 (9.07%) Cyber Essentials
5 32 (9.07%) NIST
6 29 (8.22%) Cyber Essentials PLUS
6 29 (8.22%) PCI DSS
7 14 (3.97%) Accessibility
8 12 (3.40%) Data Quality
9 5 (1.42%) SLA
10 3 (0.85%) Def Stans
10 3 (0.85%) GxP
11 2 (0.57%) COBIT
11 2 (0.57%) Sarbanes-Oxley
11 2 (0.57%) SOC 2
12 1 (0.28%) DICOM
12 1 (0.28%) HIPAA
12 1 (0.28%) HL7
12 1 (0.28%) SNOMED CT
System Software
1 17 (4.82%) Docker
2 7 (1.98%) Firmware
2 7 (1.98%) VMware Infrastructure
3 6 (1.70%) Hyper-V
4 3 (0.85%) Embedded Firmware
4 3 (0.85%) VMware ESXi
5 1 (0.28%) Active Directory
5 1 (0.28%) vSphere
Systems Management
1 18 (5.10%) Kubernetes
2 16 (4.53%) Terraform
3 4 (1.13%) Ansible
3 4 (1.13%) Microsoft Intune
4 3 (0.85%) Autotask
4 3 (0.85%) vCenter Server
5 1 (0.28%) Active Directory Federation Services
5 1 (0.28%) Data Guard
5 1 (0.28%) Oracle ZFS
5 1 (0.28%) Single Sign-On
Vendors
1 145 (41.08%) SAP
2 36 (10.20%) Microsoft
3 15 (4.25%) Google
4 13 (3.68%) Cisco
5 10 (2.83%) Oracle
6 9 (2.55%) Juniper
7 7 (1.98%) VMware
8 5 (1.42%) Informatica
8 5 (1.42%) Salesforce
9 4 (1.13%) OpenAI
9 4 (1.13%) ServiceNow
10 3 (0.85%) Apple
10 3 (0.85%) Datto
10 3 (0.85%) EMC
10 3 (0.85%) Fortinet
10 3 (0.85%) Palantir
10 3 (0.85%) Sophos
10 3 (0.85%) Veeam
11 2 (0.57%) Fujitsu
11 2 (0.57%) JD Edwards