Low Latency Jobs with Hybrid/Remote/WFH Options

Low Latency
UK > Work from Home

The table below provides summary statistics for permanent remote or hybrid work requiring Low Latency skills. It includes a benchmarking guide to the annual salaries offered in vacancies that cited Low Latency over the 6 months leading up to 14 May 2025, comparing them to the same period in the previous two years.

6 months to
14 May 2025
Same period 2024 Same period 2023
Rank 365 447 227
Rank change year-on-year +82 -220 +283
Permanent jobs citing Low Latency 93 131 624
As % of all permanent jobs with a WFH option 0.52% 0.39% 1.51%
As % of the Processes & Methodologies category 0.55% 0.43% 1.57%
Number of salaries quoted 58 105 453
10th Percentile £50,125 £69,500 £57,500
25th Percentile £75,000 £75,219 £70,735
Median annual salary (50th Percentile) £112,500 £112,500 £100,000
Median % change year-on-year - +12.50% +2.56%
75th Percentile £140,677 £133,750 £135,000
90th Percentile £161,625 £146,250 £160,000
UK median annual salary £110,000 £110,000 £100,000
% change year-on-year - +10.00% -

All Process and Methodology Skills
Work from Home

Low Latency falls under the Processes and Methodologies category. For comparison with the information above, the following table provides summary statistics for all permanent job vacancies with remote or hybrid options requiring process or methodology skills.

Permanent vacancies with a requirement for process or methodology skills 16,886 30,803 39,731
As % of all permanent jobs with a WFH option 94.21% 91.37% 96.09%
Number of salaries quoted 9,670 23,360 27,643
10th Percentile £28,750 £33,750 £37,500
25th Percentile £43,750 £42,500 £47,500
Median annual salary (50th Percentile) £60,000 £57,500 £62,500
Median % change year-on-year +4.35% -8.00% +4.17%
75th Percentile £77,500 £75,000 £82,500
90th Percentile £102,500 £95,000 £100,000
UK median annual salary £57,500 £55,000 £61,000
% change year-on-year +4.55% -9.84% +1.67%

Low Latency
Trend for Jobs with a WFH Option

Job vacancies with remote working options citing Low Latency as a proportion of all IT jobs advertised.
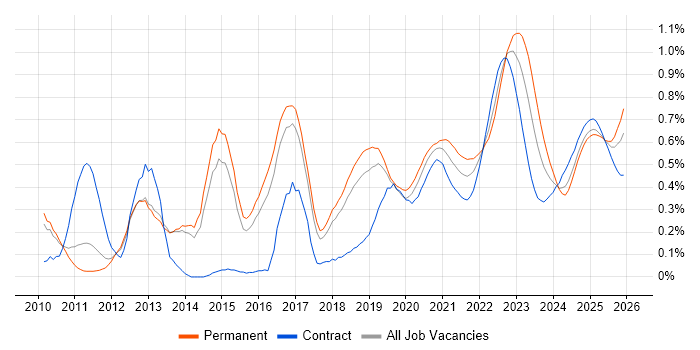
Low Latency trend for jobs with Hybrid/Remote/WFH options

Low Latency
Salary Trend for Jobs with a WFH Option

3-month moving average salary quoted in job vacancies with remote working options citing Low Latency.

Low Latency salary trend for jobs with a WFH option

Low Latency
Salary Histogram for Jobs with a WFH Option

Salary distribution for jobs with remote working options citing Low Latency over the 6 months to 14 May 2025.

Low Latency salary histogram for jobs with a WFH option

Low Latency
Co-occurring Skills and Capabilities with WFH Options by Category

The follow tables expand on the table above by listing co-occurrences grouped by category. The same employment type, locality and period is covered with up to 20 co-occurrences shown in each of the following categories:

Application Platforms
1 4 (4.30%) Apache
2 3 (3.23%) Apache Airflow
2 3 (3.23%) GemFire
3 2 (2.15%) nginx
3 2 (2.15%) OpenStack
3 2 (2.15%) Tomcat
4 1 (1.08%) Apache Spark
4 1 (1.08%) Oracle SOA Suite
Cloud Services
1 30 (32.26%) AWS
2 20 (21.51%) GCP
3 14 (15.05%) Azure
4 7 (7.53%) SaaS
5 4 (4.30%) Amazon CloudWatch
5 4 (4.30%) Cloud Computing
5 4 (4.30%) OpenShift
6 3 (3.23%) Amazon ECS
6 3 (3.23%) Microsoft Copilot
6 3 (3.23%) Prefect
7 2 (2.15%) Amazon ECR
7 2 (2.15%) PaaS
8 1 (1.08%) Amazon Neptune
8 1 (1.08%) Amazon S3
8 1 (1.08%) GitHub
8 1 (1.08%) GitHub Actions
Communications & Networking
1 23 (24.73%) TCP/IP
2 5 (5.38%) Multicast
3 2 (2.15%) BGP
3 2 (2.15%) Cisco ISE
3 2 (2.15%) DNS
3 2 (2.15%) EIGRP
3 2 (2.15%) Firewall
3 2 (2.15%) HTTP
3 2 (2.15%) Intrusion Detection
3 2 (2.15%) LAN
3 2 (2.15%) MPLS
3 2 (2.15%) Network Security
3 2 (2.15%) OSPF
3 2 (2.15%) SD-WAN
3 2 (2.15%) VLAN
3 2 (2.15%) VPN
3 2 (2.15%) WAN
3 2 (2.15%) Wi-Fi
4 1 (1.08%) 3GPP
4 1 (1.08%) 5G
Database & Business Intelligence
1 12 (12.90%) MongoDB
2 8 (8.60%) Redis
3 6 (6.45%) NoSQL
4 5 (5.38%) SQL Server
5 4 (4.30%) MySQL
5 4 (4.30%) PostgreSQL
6 3 (3.23%) Apache Ignite
6 3 (3.23%) Big Data
6 3 (3.23%) InterSystems Cache
6 3 (3.23%) RDBMS
6 3 (3.23%) Relational Database
7 2 (2.15%) Apache Cassandra
7 2 (2.15%) CouchDB
7 2 (2.15%) Elasticsearch
7 2 (2.15%) Hazelcast
8 1 (1.08%) Amazon Athena
8 1 (1.08%) Apache Hive
8 1 (1.08%) HBase
8 1 (1.08%) Impala
8 1 (1.08%) Triplestore
Development Applications
1 8 (8.60%) Git
1 8 (8.60%) Jenkins
2 6 (6.45%) Oracle Forms
3 5 (5.38%) GitLab
4 4 (4.30%) JIRA
5 3 (3.23%) MLflow
6 2 (2.15%) Gradle
6 2 (2.15%) Maven
7 1 (1.08%) Eclipse
7 1 (1.08%) Robot Framework
General
1 47 (50.54%) Finance
2 39 (41.94%) Banking
3 15 (16.13%) Front Office
3 15 (16.13%) Investment Banking
4 10 (10.75%) Social Skills
5 4 (4.30%) Law
5 4 (4.30%) Telecoms
6 3 (3.23%) Analytical Skills
6 3 (3.23%) Inclusion and Diversity
7 2 (2.15%) Retail
8 1 (1.08%) Games
Job Titles
1 48 (51.61%) Developer
2 23 (24.73%) C++ Developer
2 23 (24.73%) Software Engineer
3 19 (20.43%) Linux Developer
3 19 (20.43%) Low Latency C++ Developer
4 18 (19.35%) Java Developer
4 18 (19.35%) Senior
5 14 (15.05%) Investment Banking C++ Developer
5 14 (15.05%) Linux Scripter
6 12 (12.90%) Java Engineer
7 9 (9.68%) Lead
7 9 (9.68%) Senior Developer
8 8 (8.60%) Front Office Developer
8 8 (8.60%) Lead Software Engineer
9 7 (7.53%) Electronic Trading Developer
9 7 (7.53%) Electronic Trading Java Developer
9 7 (7.53%) Java Software Engineer
9 7 (7.53%) Senior Software Engineer
10 5 (5.38%) Market Data Developer
10 5 (5.38%) Senior Java Developer
Libraries, Frameworks & Software Standards
1 21 (22.58%) Kafka
2 12 (12.90%) .NET
3 11 (11.83%) Node.js
4 10 (10.75%) React
5 6 (6.45%) Express.js
5 6 (6.45%) RESTful
6 5 (5.38%) FIX Protocol
7 4 (4.30%) WebSockets
8 3 (3.23%) .NET Core
8 3 (3.23%) Boost C++ Libraries
8 3 (3.23%) CSS
8 3 (3.23%) GraphQL
8 3 (3.23%) gRPC
8 3 (3.23%) HTML
8 3 (3.23%) Middleware
8 3 (3.23%) pytest
8 3 (3.23%) RabbitMQ
8 3 (3.23%) scikit-learn
8 3 (3.23%) Spring
8 3 (3.23%) TensorFlow
Miscellaneous
1 19 (20.43%) FPGA
2 17 (18.28%) Algorithms
3 15 (16.13%) Distributed Systems
4 11 (11.83%) Cloud Native
5 9 (9.68%) Foreign Exchange (FX)
6 8 (8.60%) Product Ownership
7 7 (7.53%) Data Structures
7 7 (7.53%) Derivative
8 6 (6.45%) Fixed Income
9 3 (3.23%) Credit Derivative
9 3 (3.23%) Equities
9 3 (3.23%) Greenfield Project
9 3 (3.23%) Onboarding
9 3 (3.23%) Public Cloud
10 2 (2.15%) Cyber Threat
10 2 (2.15%) Data Centre
11 1 (1.08%) Equity Derivative
11 1 (1.08%) Reference Data
11 1 (1.08%) Semantic Web
11 1 (1.08%) State Machine
Operating Systems
1 32 (34.41%) Linux
2 5 (5.38%) Unix
3 4 (4.30%) CentOS
4 2 (2.15%) Rocky
5 1 (1.08%) Debian
5 1 (1.08%) Ubuntu
Processes & Methodologies
1 27 (29.03%) Agile
1 27 (29.03%) CI/CD
2 24 (25.81%) Software Engineering
3 20 (21.51%) Microservices
4 17 (18.28%) Containerisation
5 16 (17.20%) Multithreading
6 15 (16.13%) Electronic Trading
6 15 (16.13%) Mentoring
7 14 (15.05%) Event-Driven
7 14 (15.05%) Problem-Solving
8 13 (13.98%) TDD
9 12 (12.90%) Clean Code
9 12 (12.90%) Concurrent Programming
9 12 (12.90%) Roadmaps
9 12 (12.90%) Scrum
10 11 (11.83%) DevOps
11 9 (9.68%) Event-Driven Architecture
11 9 (9.68%) Software Testing
12 8 (8.60%) Artificial Intelligence
12 8 (8.60%) Machine Learning
Programming Languages
1 52 (55.91%) Java
2 24 (25.81%) C++
3 20 (21.51%) C
3 20 (21.51%) SQL
4 16 (17.20%) Python
5 13 (13.98%) C#
6 11 (11.83%) JavaScript
7 9 (9.68%) TypeScript
8 6 (6.45%) PL/SQL
9 4 (4.30%) Bash
10 2 (2.15%) Kotlin
10 2 (2.15%) Rust
11 1 (1.08%) Go
11 1 (1.08%) PHP
11 1 (1.08%) Ruby
11 1 (1.08%) SHACL
11 1 (1.08%) Shell Script
11 1 (1.08%) SPARQL
Qualifications
1 14 (15.05%) Degree
2 5 (5.38%) Master's Degree
2 5 (5.38%) Security Cleared
3 3 (3.23%) BPSS Clearance
4 2 (2.15%) Computer Science Degree
4 2 (2.15%) PhD
5 1 (1.08%) Numerate Degree
Quality Assurance & Compliance
1 12 (12.90%) QA
2 3 (3.23%) Accessibility
3 2 (2.15%) Cyber Essentials
3 2 (2.15%) Cyber Essentials PLUS
3 2 (2.15%) ISO/IEC 27001
3 2 (2.15%) PCI DSS
4 1 (1.08%) Data Quality
System Software
1 27 (29.03%) Docker
2 2 (2.15%) VMware Infrastructure
3 1 (1.08%) HDFS
Systems Management
1 28 (30.11%) Kubernetes
2 5 (5.38%) Terraform
3 4 (4.30%) Ansible
3 4 (4.30%) Nagios
4 2 (2.15%) Grafana
4 2 (2.15%) Red Hat Satellite
Vendors
1 10 (10.75%) Oracle
2 4 (4.30%) Microsoft
2 4 (4.30%) Red Hat
2 4 (4.30%) Solace
2 4 (4.30%) SolarWinds
3 3 (3.23%) Ping Identity
3 3 (3.23%) TIBCO
4 2 (2.15%) Cisco
4 2 (2.15%) Fortinet
4 2 (2.15%) Google
4 2 (2.15%) Juniper
4 2 (2.15%) Palo Alto
4 2 (2.15%) Rapid7
4 2 (2.15%) Splunk
4 2 (2.15%) VMware
5 1 (1.08%) ION Trading
5 1 (1.08%) OpenAI