Data Migration
UK

The following table provides summary statistics for permanent job vacancies with a requirement for Data Migration skills. Included is a benchmarking guide to the salaries offered in vacancies that have cited Data Migration over the 6 months to 28 November 2023 with a comparison to the same period in the previous 2 years.

6 months to
28 Nov 2023
Same period 2022 Same period 2021
Rank 293 423 324
Rank change year-on-year +130 -99 +74
Permanent jobs citing Data Migration 573 962 1,424
As % of all permanent jobs advertised in the UK 1.05% 0.77% 1.11%
As % of the Processes & Methodologies category 1.12% 0.80% 1.16%
Number of salaries quoted 411 594 913
10th Percentile £42,250 £37,800 £38,750
25th Percentile £47,500 £51,250 £47,500
Median annual salary (50th Percentile) £65,000 £62,750 £61,900
Median % change year-on-year +3.59% +1.37% +17.90%
75th Percentile £77,500 £82,500 £75,000
90th Percentile £95,000 £100,000 £88,750
UK excluding London median annual salary £55,000 £55,000 £60,000
% change year-on-year - -8.33% +26.32%

All Process and Methodology Skills
UK

Data Migration is in the Processes and Methodologies category. The following table is for comparison with the above and provides summary statistics for all permanent job vacancies with a requirement for process or methodology skills.

Permanent vacancies with a requirement for process or methodology skills 51,121 120,104 122,523
As % of all permanent jobs advertised in the UK 94.09% 95.72% 95.43%
Number of salaries quoted 36,956 73,203 81,032
10th Percentile £32,500 £34,313 £32,500
25th Percentile £43,750 £45,000 £42,500
Median annual salary (50th Percentile) £60,000 £60,000 £59,000
Median % change year-on-year - +1.69% +7.27%
75th Percentile £80,000 £81,250 £77,500
90th Percentile £98,750 £100,000 £95,000
UK excluding London median annual salary £52,500 £53,000 £50,000
% change year-on-year -0.94% +6.00% +4.17%

Data Migration
Job Vacancy Trend

Job postings citing Data Migration as a proportion of all IT jobs advertised.
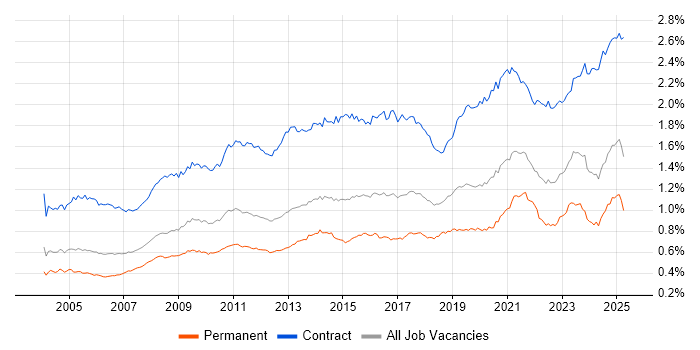
Job vacancy trend for Data Migration in the UK

Data Migration
Salary Trend

3-month moving average salary quoted in jobs citing Data Migration.

Salary trend for Data Migration in the UK

Data Migration
Salary Histogram

Salary distribution for jobs citing Data Migration over the 6 months to 28 November 2023.

Salary histogram for Data Migration in the UK

Data Migration
Top 17 Job Locations

The table below looks at the demand and provides a guide to the median salaries quoted in IT jobs citing Data Migration within the UK over the 6 months to 28 November 2023. The 'Rank Change' column provides an indication of the change in demand within each location based on the same 6 month period last year.

Location Rank Change
on Same Period
Last Year
Matching
Permanent
IT Job Ads
Median Salary
Past 6 Months
Median Salary
% Change
on Same Period
Last Year
Live
Jobs
England +155 496 £65,000 +4.00% 254
UK excluding London +140 315 £55,000 - 150
Work from Home +151 287 £57,500 -8.00% 148
London +141 199 £72,500 -3.33% 104
North of England +90 86 £65,000 +13.04% 32
Midlands +158 78 £55,000 -15.38% 23
South East +126 72 £52,500 -12.50% 59
West Midlands +144 65 £55,000 -21.43% 18
North West +137 60 £65,000 +3.17% 21
Scotland +34 31 £47,500 +11.76% 7
Yorkshire +42 25 £43,000 -28.33% 5
East of England +123 17 £57,500 +0.13% 17
South West -2 16 £76,250 +45.24% 15
East Midlands +50 13 £72,500 +31.82% 5
Wales +9 8 £72,085 +80.21% 1
Northern Ireland +40 7 £45,000 +38.46%
North East +27 1 £80,000 +45.45% 6

Data Migration
Co-occurring Skills and Capabilities by Category

The follow tables expand on the table above by listing co-occurrences grouped by category. The same employment type, locality and period is covered with up to 20 co-occurrences shown in each of the following categories:

Application Platforms
1 22 (3.84%) SharePoint
2 11 (1.92%) Confluence
3 7 (1.22%) SAS
4 6 (1.05%) IIS
5 5 (0.87%) Apache
5 5 (0.87%) Apache Spark
6 3 (0.52%) SharePoint Server
7 2 (0.35%) Alfresco
7 2 (0.35%) Documentum
7 2 (0.35%) FileNet
8 1 (0.17%) Apache Airflow
8 1 (0.17%) nginx
8 1 (0.17%) Tomcat
Applications
1 24 (4.19%) Microsoft Excel
2 10 (1.75%) Microsoft Office
3 8 (1.40%) Microsoft PowerPoint
3 8 (1.40%) Spreadsheet
4 2 (0.35%) MS Visio
5 1 (0.17%) Microsoft Project
Business Applications
1 53 (9.25%) NetSuite
2 27 (4.71%) Dynamics CRM
3 20 (3.49%) SAP S/4HANA
4 7 (1.22%) Oracle EBS
5 5 (0.87%) Dynamics NAV
5 5 (0.87%) Infor M3
5 5 (0.87%) Sage X3
5 5 (0.87%) SAP ERP
6 3 (0.52%) Dynamics AX
6 3 (0.52%) Oracle Payroll
7 2 (0.35%) Cerner Millennium
7 2 (0.35%) Oracle General Ledger
7 2 (0.35%) Oracle Payables
7 2 (0.35%) Salesforce CRM
7 2 (0.35%) SAP CO
7 2 (0.35%) SAP FI
7 2 (0.35%) SAP FI/CO
7 2 (0.35%) SAP HCM
7 2 (0.35%) Scribe Insight
7 2 (0.35%) Workday HCM
Cloud Services
1 127 (22.16%) Azure
2 122 (21.29%) AWS
3 71 (12.39%) Power Platform
4 55 (9.60%) Dynamics 365
5 41 (7.16%) GCP
6 36 (6.28%) Azure Data Factory
7 26 (4.54%) Azure DevOps
8 22 (3.84%) Power Automate
8 22 (3.84%) Serverless
9 20 (3.49%) PowerApps
9 20 (3.49%) SaaS
10 18 (3.14%) Azure Functions
11 17 (2.97%) Azure Logic Apps
12 13 (2.27%) Azure Synapse Analytics
13 11 (1.92%) PaaS
14 9 (1.57%) Azure Cosmos DB
14 9 (1.57%) Microsoft 365
15 8 (1.40%) Boomi
15 8 (1.40%) Snowflake
16 7 (1.22%) SuccessFactors
Communications & Networking
1 8 (1.40%) DNS
2 4 (0.70%) Firewall
2 4 (0.70%) VPN
3 3 (0.52%) Intranet
4 2 (0.35%) NAS
4 2 (0.35%) Wireless
5 1 (0.17%) Cisco Firepower
5 1 (0.17%) Cisco Nexus
5 1 (0.17%) DHCP
5 1 (0.17%) Extranet
5 1 (0.17%) LAN
5 1 (0.17%) TCP/IP
5 1 (0.17%) Wi-Fi
5 1 (0.17%) WLAN
Database & Business Intelligence
1 76 (13.26%) PostgreSQL
2 71 (12.39%) Oracle Database
2 71 (12.39%) Oracle Database 11g
3 66 (11.52%) Data Warehouse
4 48 (8.38%) SQL Server
5 47 (8.20%) Power BI
6 42 (7.33%) SQL Server Integration Services
7 29 (5.06%) Data Lake
8 22 (3.84%) Big Data
9 20 (3.49%) Azure SQL Database
9 20 (3.49%) Relational Database
10 18 (3.14%) SQL Server Reporting Services
11 13 (2.27%) NoSQL
12 11 (1.92%) Metadata
12 11 (1.92%) RDBMS
13 10 (1.75%) BigQuery
14 8 (1.40%) Elasticsearch
15 7 (1.22%) Crystal Reports
15 7 (1.22%) Delta Lake
15 7 (1.22%) Oracle Reports
Development Applications
1 32 (5.58%) Git
2 23 (4.01%) JIRA
3 17 (2.97%) Visual Studio
4 15 (2.62%) Jenkins
5 13 (2.27%) Sonatype Nexus
6 11 (1.92%) SQL Server Management Studio (SSMS)
7 9 (1.57%) Team Foundation Server
8 8 (1.40%) Postman
8 8 (1.40%) Selenium
9 7 (1.22%) Oracle Forms
10 6 (1.05%) Spinnaker
11 5 (0.87%) SonarQube
12 4 (0.70%) Bitbucket
12 4 (0.70%) Subversion
13 3 (0.52%) Gatling
13 3 (0.52%) JUnit
13 3 (0.52%) LoadRunner
13 3 (0.52%) LSMW
14 2 (0.35%) ClearCase
14 2 (0.35%) ClearQuest
General
1 195 (34.03%) Social Skills
2 179 (31.24%) Finance
3 52 (9.08%) Analytical Skills
4 42 (7.33%) Manufacturing
5 27 (4.71%) Public Sector
6 26 (4.54%) Inclusion and Diversity
7 24 (4.19%) Banking
8 23 (4.01%) Influencing Skills
9 22 (3.84%) Marketing
10 15 (2.62%) Retail
11 13 (2.27%) Legal
12 11 (1.92%) Presentation Skills
13 10 (1.75%) Law
14 7 (1.22%) Financial Institution
15 6 (1.05%) Telecoms
16 5 (0.87%) Electronics
16 5 (0.87%) Organisational Skills
16 5 (0.87%) Social Housing
17 4 (0.70%) French Language
17 4 (0.70%) Games
Job Titles
1 166 (28.97%) Senior
2 132 (23.04%) Consultant
3 110 (19.20%) Developer
4 87 (15.18%) Analyst
5 66 (11.52%) Senior Developer
6 59 (10.30%) Functional Consultant
7 58 (10.12%) Senior Consultant
8 54 (9.42%) Database Developer
9 53 (9.25%) PostgreSQL Developer
9 53 (9.25%) Senior Database Developer
10 51 (8.90%) NetSuite Consultant
11 50 (8.73%) Data Analyst
12 49 (8.55%) Senior Functional Consultant
13 44 (7.68%) Architect
14 36 (6.28%) Project Manager
15 34 (5.93%) Lead
16 32 (5.58%) Data Architect
17 31 (5.41%) Business Analyst
18 26 (4.54%) Data Engineer
19 23 (4.01%) Data Consultant
Libraries, Frameworks & Software Standards
1 35 (6.11%) .NET
2 25 (4.36%) HTML
3 20 (3.49%) CSS
4 17 (2.97%) .NET Framework
5 16 (2.79%) HTML5
6 14 (2.44%) React
6 14 (2.44%) REST
7 13 (2.27%) JSON
7 13 (2.27%) Twitter Bootstrap
8 12 (2.09%) XML
9 10 (1.75%) Node.js
9 10 (1.75%) Web Services
10 9 (1.57%) RESTful
10 9 (1.57%) SOAP
10 9 (1.57%) Velocity
11 8 (1.40%) AngularJS
11 8 (1.40%) ASP.NET Web API
11 8 (1.40%) Entity Framework
11 8 (1.40%) LINQ
11 8 (1.40%) Swagger
Miscellaneous
1 72 (12.57%) Legacy Systems
2 35 (6.11%) Management Information System
3 17 (2.97%) Product Ownership
4 16 (2.79%) Data Structures
4 16 (2.79%) Self-Motivation
5 14 (2.44%) Greenfield Project
6 11 (1.92%) Enterprise Software
7 10 (1.75%) Cloud Native
8 9 (1.57%) Public Cloud
8 9 (1.57%) Virtual Team
9 7 (1.22%) Data Centre
10 6 (1.05%) Analytical Mindset
10 6 (1.05%) Distributed Applications
10 6 (1.05%) Onboarding
11 4 (0.70%) Mainframe
11 4 (0.70%) Mobile App
11 4 (0.70%) NHS
12 3 (0.52%) e-Health
12 3 (0.52%) LIMS
12 3 (0.52%) PACS
Operating Systems
1 14 (2.44%) Windows
2 12 (2.09%) Windows Server
3 5 (0.87%) Linux
4 2 (0.35%) Windows 10
4 2 (0.35%) Windows Server 2008
4 2 (0.35%) Windows Server 2012
5 1 (0.17%) Apple iOS
5 1 (0.17%) Unix
Processes & Methodologies
1 573 (100.00%) Migration
2 143 (24.96%) Problem-Solving
3 136 (23.73%) Agile
4 100 (17.45%) Artificial Intelligence
5 95 (16.58%) Data Modelling
6 90 (15.71%) Unit Testing
7 87 (15.18%) Business Intelligence
8 85 (14.83%) User Acceptance Testing
9 83 (14.49%) ETL
10 78 (13.61%) Performance Tuning
11 76 (13.26%) Analytics
12 72 (12.57%) Actionable Insight
13 71 (12.39%) Secure Coding
14 70 (12.22%) Stakeholder Management
15 69 (12.04%) ERP
16 64 (11.17%) Process Improvement
17 62 (10.82%) Data Management
18 57 (9.95%) CRM
19 54 (9.42%) Mentoring
20 51 (8.90%) DevOps
Programming Languages
1 218 (38.05%) SQL
2 79 (13.79%) PL/SQL
3 50 (8.73%) JavaScript
4 49 (8.55%) C#
5 39 (6.81%) Python
6 27 (4.71%) T-SQL
7 26 (4.54%) PowerShell
8 22 (3.84%) Java
9 16 (2.79%) TypeScript
10 15 (2.62%) Scala
11 11 (1.92%) Bash
11 11 (1.92%) Go
12 9 (1.57%) Groovy
13 7 (1.22%) ABAP
13 7 (1.22%) Apex Code
14 6 (1.05%) Bicep
15 3 (0.52%) R
16 2 (0.35%) Data Analysis Expressions
16 2 (0.35%) SAPscript
17 1 (0.17%) SOQL
Qualifications
1 67 (11.69%) Degree
2 32 (5.58%) Security Cleared
3 28 (4.89%) SC Cleared
4 27 (4.71%) Computer Science Degree
5 9 (1.57%) Microsoft Certification
6 8 (1.40%) Master's Degree
7 5 (0.87%) Azure Certification
8 4 (0.70%) BPSS Clearance
8 4 (0.70%) PMP
9 2 (0.35%) AWS Certification
9 2 (0.35%) DBS Check
9 2 (0.35%) ITIL Certification
9 2 (0.35%) MCTS
9 2 (0.35%) TOGAF Certification
10 1 (0.17%) IIBA
10 1 (0.17%) ISEB
10 1 (0.17%) MBA
10 1 (0.17%) SAP Certification
Quality Assurance & Compliance
1 83 (14.49%) Data Quality
2 24 (4.19%) QA
3 12 (2.09%) GDPR
4 8 (1.40%) Accessibility
4 8 (1.40%) PMO
5 7 (1.22%) SLA
6 4 (0.70%) HL7
7 1 (0.17%) California Consumer Privacy Act
7 1 (0.17%) ISO/IEC 27001
System Software
1 7 (1.22%) Active Directory
2 6 (1.05%) Docker
3 5 (0.87%) Virtual Machines
4 1 (0.17%) HDFS
4 1 (0.17%) iptables
Systems Management
1 27 (4.71%) Kubernetes
2 10 (1.75%) Terraform
3 5 (0.87%) Ansible
4 4 (0.70%) Progress Chef
4 4 (0.70%) Puppet
4 4 (0.70%) Salt
5 3 (0.52%) Istio
6 2 (0.35%) Packer
7 1 (0.17%) SCCM
Vendors
1 131 (22.86%) Microsoft
2 129 (22.51%) Oracle
3 69 (12.04%) SAP
4 35 (6.11%) Salesforce
5 34 (5.93%) Google
6 21 (3.66%) IBM
7 20 (3.49%) Informatica
8 16 (2.79%) Databricks
9 14 (2.44%) Talend
10 8 (1.40%) IFS
10 8 (1.40%) Sage
10 8 (1.40%) ServiceNow
11 4 (0.70%) Atlassian
11 4 (0.70%) MuleSoft
11 4 (0.70%) OpenAI
11 4 (0.70%) Workday
12 3 (0.52%) Adobe
12 3 (0.52%) Cerner
12 3 (0.52%) Dynatrace
12 3 (0.52%) Guidewire