Performance Management Jobs in England

Performance Management
UK > England

The table below provides summary statistics for permanent job vacancies advertised in England requiring Performance Management skills. It includes a benchmarking guide to the annual salaries offered in vacancies that cited Performance Management over the 6 months leading up to 28 May 2025, comparing them to the same period in the previous two years.

6 months to
28 May 2025
Same period 2024 Same period 2023
Rank 338 238 374
Rank change year-on-year -100 +136 +129
Permanent jobs citing Performance Management 406 1,042 762
As % of all permanent jobs advertised in England 0.84% 1.18% 0.87%
As % of the Processes & Methodologies category 0.89% 1.40% 0.92%
Number of salaries quoted 231 379 379
10th Percentile £47,863 £36,200 £40,600
25th Percentile £52,600 £46,297 £48,000
Median annual salary (50th Percentile) £55,000 £58,000 £69,447
Median % change year-on-year -5.17% -16.48% +6.84%
75th Percentile £77,500 £77,500 £90,000
90th Percentile £105,000 £90,000 £115,000
UK median annual salary £55,000 £58,000 £69,447
% change year-on-year -5.17% -16.48% +6.84%

All Process and Methodology Skills
England

Performance Management falls under the Processes and Methodologies category. For comparison with the information above, the following table provides summary statistics for all permanent job vacancies requiring process or methodology skills in England.

Permanent vacancies with a requirement for process or methodology skills 45,477 74,482 83,229
As % of all permanent jobs advertised in England 94.01% 84.24% 95.56%
Number of salaries quoted 22,533 54,432 49,691
10th Percentile £29,625 £29,000 £34,375
25th Percentile £41,250 £40,000 £46,105
Median annual salary (50th Percentile) £57,500 £55,000 £62,500
Median % change year-on-year +4.55% -12.00% +4.17%
75th Percentile £75,000 £72,500 £82,500
90th Percentile £98,695 £93,750 £102,500
UK median annual salary £57,500 £55,000 £61,000
% change year-on-year +4.55% -9.84% +1.67%

Performance Management
Job Vacancy Trend in England

Job postings citing Performance Management as a proportion of all IT jobs advertised in England.
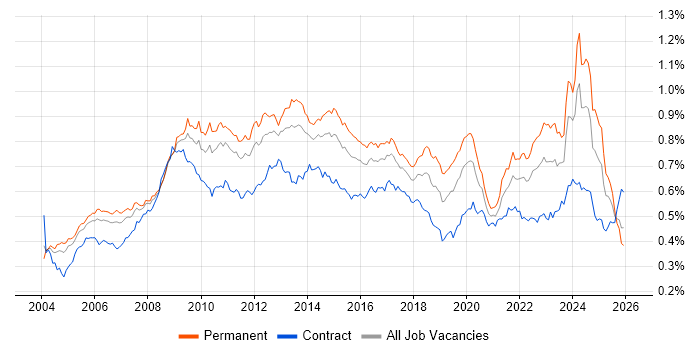
Job vacancy trend for Performance Management in England

Performance Management
Salary Trend in England

3-month moving average salary quoted in jobs citing Performance Management in England.

Salary trend for Performance Management in England

Performance Management
Salary Histogram in England

Salary distribution for jobs citing Performance Management in England over the 6 months to 28 May 2025.

Salary histogram for Performance Management in England

Performance Management
Job Locations in England

The table below looks at the demand and provides a guide to the median salaries quoted in IT jobs citing Performance Management within the England region over the 6 months to 28 May 2025. The 'Rank Change' column provides an indication of the change in demand within each location based on the same 6 month period last year.

Location Rank Change
on Same Period
Last Year
Matching
Permanent
IT Job Ads
Median Salary
Past 6 Months
Median Salary
% Change
on Same Period
Last Year
Live
Jobs
North of England +44 127 £54,793 -5.47% 65
North West +35 101 £54,793 -5.47% 35
South East -32 79 £73,750 +22.92% 89
London -176 78 £85,000 +17.24% 262
South West +135 56 £52,600 +12.02% 20
East of England +26 33 £55,000 - 17
Midlands +17 32 £65,000 +15.49% 34
Yorkshire +37 23 £71,991 +24.20% 22
West Midlands +35 20 £67,500 +16.45% 20
East Midlands +24 11 £65,000 +33.33% 12
North East +39 3 - - 8
Performance Management
UK

Performance Management
Co-occurring Skills and Capabilities in England by Category

The follow tables expand on the table above by listing co-occurrences grouped by category. The same employment type, locality and period is covered with up to 20 co-occurrences shown in each of the following categories:

Application Platforms
1 10 (2.46%) Microsoft Exchange
2 2 (0.49%) nginx
2 2 (0.49%) ThingWorx
3 1 (0.25%) Moodle
3 1 (0.25%) SharePoint
Applications
1 29 (7.14%) Microsoft Excel
2 25 (6.16%) Microsoft Office
3 21 (5.17%) Microsoft PowerPoint
4 10 (2.46%) Simulink
5 3 (0.74%) Microsoft Project
6 1 (0.25%) MS Visio
6 1 (0.25%) Oracle Smart View
6 1 (0.25%) SPSS
6 1 (0.25%) SPSS Modeler
Business Applications
1 9 (2.22%) Magento
1 9 (2.22%) Shopify
2 4 (0.99%) Maximo
3 3 (0.74%) Oracle ERP
3 3 (0.74%) SAP S/4HANA
4 2 (0.49%) Infor M3
5 1 (0.25%) Oracle BPM
5 1 (0.25%) Oracle Financials
5 1 (0.25%) Salesforce CRM
5 1 (0.25%) Workday HCM
Cloud Services
1 36 (8.87%) Azure
2 24 (5.91%) SaaS
3 22 (5.42%) Power Platform
4 13 (3.20%) AWS
5 9 (2.22%) BigCommerce
6 8 (1.97%) Azure DevOps
7 6 (1.48%) Microsoft 365
8 4 (0.99%) GCP
8 4 (0.99%) OCI
9 3 (0.74%) IaaS
9 3 (0.74%) PaaS
10 2 (0.49%) Amazon CloudWatch
10 2 (0.49%) Asana
10 2 (0.49%) AWS CloudFormation
10 2 (0.49%) Azure Monitor
10 2 (0.49%) Entra ID
11 1 (0.25%) Azure AKS
11 1 (0.25%) Cloud Computing
11 1 (0.25%) Dynamics 365
11 1 (0.25%) Snowflake
Communications & Networking
1 5 (1.23%) Firewall
2 4 (0.99%) DNS
2 4 (0.99%) Network Security
3 2 (0.49%) BGP
3 2 (0.49%) Cisco ISE
3 2 (0.49%) DHCP
3 2 (0.49%) Ethernet VPN
3 2 (0.49%) Intranet
3 2 (0.49%) IPsec
3 2 (0.49%) MPLS
3 2 (0.49%) NAS
3 2 (0.49%) NetScaler
3 2 (0.49%) OSPF
3 2 (0.49%) SAN
3 2 (0.49%) SD-WAN
3 2 (0.49%) SNMP
3 2 (0.49%) VXLAN
3 2 (0.49%) WAN
3 2 (0.49%) Wi-Fi
3 2 (0.49%) Wireshark
Database & Business Intelligence
1 21 (5.17%) Power BI
2 16 (3.94%) BusinessObjects
2 16 (3.94%) Data Mining
3 10 (2.46%) NoSQL
4 9 (2.22%) Big Data
4 9 (2.22%) Data Warehouse
5 8 (1.97%) Data Lake
6 4 (0.99%) DB2
7 3 (0.74%) PostgreSQL
8 2 (0.49%) Amazon Aurora
8 2 (0.49%) Amazon RDS
8 2 (0.49%) BigQuery
8 2 (0.49%) Cloud Spanner
8 2 (0.49%) DynamoDB
8 2 (0.49%) MySQL
9 1 (0.25%) Azure SQL Database
9 1 (0.25%) DTS
9 1 (0.25%) SAP BW
9 1 (0.25%) SQL Server
9 1 (0.25%) Tableau
Development Applications
1 4 (0.99%) JIRA
2 2 (0.49%) Jenkins
3 1 (0.25%) Oracle Forms
3 1 (0.25%) Subversion
General
1 138 (33.99%) Finance
2 124 (30.54%) Social Skills
3 89 (21.92%) Aeronautics
3 89 (21.92%) Aerospace
4 68 (16.75%) Analytical Skills
5 36 (8.87%) Public Sector
5 36 (8.87%) Retail
6 35 (8.62%) Law
7 32 (7.88%) Legal
8 29 (7.14%) Inclusion and Diversity
9 27 (6.65%) Marketing
9 27 (6.65%) Presentation Skills
10 21 (5.17%) Banking
11 14 (3.45%) Influencing Skills
12 12 (2.96%) Organisational Skills
13 7 (1.72%) Police
14 5 (1.23%) Telecoms
15 4 (0.99%) Local Government
15 4 (0.99%) Pharmaceutical
16 3 (0.74%) Manufacturing
Job Titles
1 131 (32.27%) Lead
2 121 (29.80%) Senior
3 104 (25.62%) Systems Engineer
4 103 (25.37%) Lead Systems Engineer
5 89 (21.92%) Senior Systems Engineer
5 89 (21.92%) Team Leader
6 23 (5.67%) Developer
7 20 (4.93%) Analyst
7 20 (4.93%) Architect
8 18 (4.43%) Head of AI
8 18 (4.43%) Head of Analytics
9 16 (3.94%) Junior
9 16 (3.94%) Junior Developer
10 15 (3.69%) Senior Manager
11 14 (3.45%) Business Manager
12 13 (3.20%) Supplier Manager
13 12 (2.96%) Solutions Architect
14 10 (2.46%) Operations Manager
15 9 (2.22%) Engineering Manager
15 9 (2.22%) Software Engineering Manager
Libraries, Frameworks & Software Standards
1 8 (1.97%) .NET
1 8 (1.97%) React
2 7 (1.72%) .NET Core
2 7 (1.72%) AngularJS
3 6 (1.48%) HTML
4 4 (0.99%) Kafka
4 4 (0.99%) Web Services
5 3 (0.74%) EDI
6 2 (0.49%) RESTful
6 2 (0.49%) Spring
7 1 (0.25%) Hibernate
7 1 (0.25%) Node.js
7 1 (0.25%) Oracle Fusion
7 1 (0.25%) REST
Miscellaneous
1 41 (10.10%) Management Information System
2 28 (6.90%) Product Ownership
3 18 (4.43%) Data Structures
4 17 (4.19%) Onboarding
5 15 (3.69%) Self-Motivation
6 14 (3.45%) Data Centre
7 12 (2.96%) GNSS
8 11 (2.71%) Driving Licence
9 9 (2.22%) EPoS
9 9 (2.22%) Virtual Team
10 8 (1.97%) Data Protection Act
10 8 (1.97%) Greenfield Project
11 6 (1.48%) Marketing Technology
12 4 (0.99%) Algorithms
12 4 (0.99%) Learning Management System
13 3 (0.74%) Cloud Native
13 3 (0.74%) CSOC
13 3 (0.74%) Industrial Internet of Things
13 3 (0.74%) IoT
13 3 (0.74%) Operational Technology
Operating Systems
1 11 (2.71%) Windows
2 4 (0.99%) Windows Server 2012
3 3 (0.74%) Windows Server
3 3 (0.74%) Windows Server 2019
4 2 (0.49%) Android
4 2 (0.49%) Apple iOS
4 2 (0.49%) Windows Server 2016
5 1 (0.25%) Linux
5 1 (0.25%) Robot Operating System
Processes & Methodologies
1 178 (43.84%) Coaching
2 106 (26.11%) Systems Engineering
3 94 (23.15%) Mathematics
4 93 (22.91%) Cost Control
5 90 (22.17%) Physics
5 90 (22.17%) Project Management
6 81 (19.95%) Risk Management
7 80 (19.70%) Mentoring
8 79 (19.46%) Agile
9 72 (17.73%) Decision-Making
10 70 (17.24%) Stakeholder Management
11 67 (16.50%) Roadmaps
12 64 (15.76%) People Management
13 62 (15.27%) Line Management
14 61 (15.02%) Analytics
15 49 (12.07%) Continuous Improvement
16 41 (10.10%) Business Case
17 40 (9.85%) Data Analysis
18 38 (9.36%) Model-Based Systems Engineering
18 38 (9.36%) Software Engineering
Programming Languages
1 32 (7.88%) Java
2 21 (5.17%) SQL
3 17 (4.19%) VBA
4 16 (3.94%) C
4 16 (3.94%) C#
5 13 (3.20%) JavaScript
6 7 (1.72%) Python
7 6 (1.48%) Delphi
8 5 (1.23%) PowerShell
9 3 (0.74%) C++
10 2 (0.49%) Bash
11 1 (0.25%) Groovy
11 1 (0.25%) Kotlin
11 1 (0.25%) R
11 1 (0.25%) Scala
11 1 (0.25%) VB.NET
Qualifications
1 161 (39.66%) Degree
2 90 (22.17%) BPSS Clearance
3 31 (7.64%) Security Cleared
4 29 (7.14%) SC Cleared
5 22 (5.42%) DV Cleared
6 19 (4.68%) Master's Degree
7 15 (3.69%) HND
7 15 (3.69%) PMP
8 14 (3.45%) PMI Certification
9 10 (2.46%) Computer Science Degree
10 8 (1.97%) Microsoft Certification
11 7 (1.72%) ACCA
11 7 (1.72%) CIMA
11 7 (1.72%) CISM
11 7 (1.72%) CISSP
11 7 (1.72%) CRISC
12 6 (1.48%) MBA
13 3 (0.74%) AWS Certification
13 3 (0.74%) Azure Certification
14 2 (0.49%) CCSAS
Quality Assurance & Compliance
1 14 (3.45%) PMO
2 12 (2.96%) GDPR
3 10 (2.46%) Accessibility
4 9 (2.22%) ISO/IEC 27001
5 7 (1.72%) Cyber Essentials
5 7 (1.72%) Cyber Essentials PLUS
5 7 (1.72%) ISO/IEC 27002 (supersedes ISO/IEC 17799)
6 6 (1.48%) California Consumer Privacy Act
6 6 (1.48%) QA
7 4 (0.99%) SLA
8 2 (0.49%) Data Quality
8 2 (0.49%) ISO/IEC 17025
8 2 (0.49%) NCSC
9 1 (0.25%) IFRS
System Software
1 15 (3.69%) Virtual Machines
2 6 (1.48%) VMware Infrastructure
3 4 (0.99%) Docker
4 2 (0.49%) Active Directory
4 2 (0.49%) Hyper-V
5 1 (0.25%) Virtual Desktop
Systems Management
1 5 (1.23%) Kubernetes
2 4 (0.99%) Terraform
3 3 (0.74%) QRadar
4 2 (0.49%) Ansible
4 2 (0.49%) FortiGate
4 2 (0.49%) Grafana
4 2 (0.49%) HAProxy
4 2 (0.49%) Istio
4 2 (0.49%) linkerd
4 2 (0.49%) Microsoft Intune
4 2 (0.49%) NetBackup
4 2 (0.49%) Prometheus
5 1 (0.25%) SCCM
Vendors
1 82 (20.20%) Microsoft
2 16 (3.94%) Facebook
3 14 (3.45%) SAP
4 10 (2.46%) MathWorks
5 9 (2.22%) YouTube
6 7 (1.72%) Google
6 7 (1.72%) VMware
7 5 (1.23%) Adobe
7 5 (1.23%) Ariba
7 5 (1.23%) Citrix
7 5 (1.23%) Oracle
7 5 (1.23%) TikTok
8 4 (0.99%) IBM
8 4 (0.99%) Splunk
8 4 (0.99%) Workday
9 3 (0.74%) Dell
9 3 (0.74%) Isilon
9 3 (0.74%) Palo Alto
10 2 (0.49%) AlgoSec
10 2 (0.49%) Arista