XML Jobs in England

XML
UK > England

The table below provides summary statistics for permanent job vacancies advertised in England requiring XML skills. It includes a benchmarking guide to the annual salaries offered in vacancies that cited XML over the 6 months leading up to 4 October 2024, comparing them to the same period in the previous two years.

6 months to
4 Oct 2024
Same period 2023 Same period 2022
Rank 288 235 260
Rank change year-on-year -53 +25 -51
Permanent jobs citing XML 668 817 1,850
As % of all permanent jobs advertised in England 0.94% 1.51% 1.48%
As % of the Libraries, Frameworks & Software Standards category 4.94% 5.59% 4.23%
Number of salaries quoted 359 597 1,222
10th Percentile £36,250 £38,750 £36,250
25th Percentile £42,500 £47,500 £46,250
Median annual salary (50th Percentile) £60,000 £60,500 £59,500
Median % change year-on-year -0.83% +1.68% +13.33%
75th Percentile £78,000 £77,542 £77,500
90th Percentile £85,000 £88,750 £100,000
UK median annual salary £60,000 £60,500 £57,500
% change year-on-year -0.83% +5.22% +9.52%

All Software Libraries and Frameworks
England

XML falls under the Software Libraries and Frameworks category. For comparison with the information above, the following table provides summary statistics for all permanent job vacancies requiring technical specification, industry standards, software libraries and framework skills in England.

Permanent vacancies with a requirement for technical specification, industry standards, software libraries and framework skills 13,517 14,625 43,707
As % of all permanent jobs advertised in England 19.09% 27.05% 34.94%
Number of salaries quoted 8,177 11,566 23,531
10th Percentile £40,000 £42,500 £39,905
25th Percentile £47,603 £51,250 £48,750
Median annual salary (50th Percentile) £65,000 £67,500 £65,000
Median % change year-on-year -3.70% +3.85% +8.33%
75th Percentile £85,000 £85,750 £85,000
90th Percentile £113,750 £107,500 £105,000
UK median annual salary £65,000 £65,351 £65,000
% change year-on-year -0.54% +0.54% +8.33%

XML
Job Vacancy Trend in England

Job postings citing XML as a proportion of all IT jobs advertised in England.
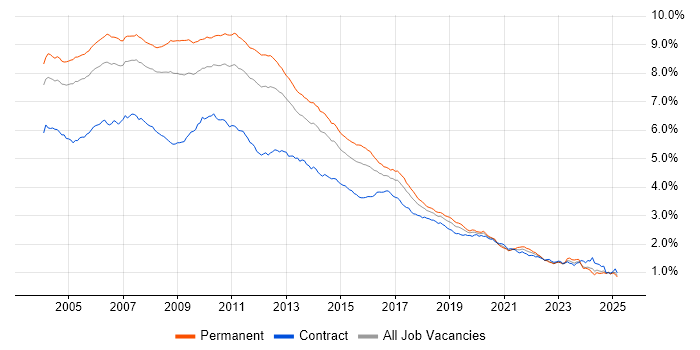
Job vacancy trend for XML in England

XML
Salary Trend in England

3-month moving average salary quoted in jobs citing XML in England.

Salary trend for XML in England

XML
Salary Histogram in England

Salary distribution for jobs citing XML in England over the 6 months to 4 October 2024.

Salary histogram for XML in England

XML
Job Locations in England

The table below looks at the demand and provides a guide to the median salaries quoted in IT jobs citing XML within the England region over the 6 months to 4 October 2024. The 'Rank Change' column provides an indication of the change in demand within each location based on the same 6 month period last year.

Location Rank Change
on Same Period
Last Year
Matching
Permanent
IT Job Ads
Median Salary
Past 6 Months
Median Salary
% Change
on Same Period
Last Year
Live
Jobs
London -22 252 £70,000 - 53
South East -54 179 £65,000 +23.81% 48
North of England -34 89 £47,530 -20.78% 38
North West -30 59 £55,000 -8.33% 21
Midlands -56 59 £52,000 -11.86% 19
South West -14 50 £67,500 +28.57% 17
West Midlands -33 40 £45,000 -23.40% 14
East of England -34 35 £63,750 +37.10% 19
Yorkshire +16 28 £33,750 -53.27% 14
East Midlands -39 19 £52,000 -11.86% 5
North East -33 2 £48,250 -2.64% 3
XML
UK

XML
Co-occurring Skills and Capabilities in England by Category

The follow tables expand on the table above by listing co-occurrences grouped by category. The same employment type, locality and period is covered with up to 20 co-occurrences shown in each of the following categories:

Application Platforms
1 50 (7.49%) Confluence
2 29 (4.34%) CMS
3 24 (3.59%) Apache
4 18 (2.69%) SharePoint
5 16 (2.40%) Tomcat
6 13 (1.95%) IIS
7 8 (1.20%) Umbraco
7 8 (1.20%) WordPress
8 3 (0.45%) Apache Spark
8 3 (0.45%) Appian
9 2 (0.30%) Apache Airflow
10 1 (0.15%) Drupal
10 1 (0.15%) JBoss
10 1 (0.15%) OpenStack
10 1 (0.15%) PrestaShop
10 1 (0.15%) WebSphere
10 1 (0.15%) WildFly
Applications
1 50 (7.49%) Microsoft Excel
2 27 (4.04%) Microsoft Office
3 22 (3.29%) Photoshop
4 21 (3.14%) MS Visio
5 17 (2.54%) Microsoft PowerPoint
6 9 (1.35%) Acrobat
6 9 (1.35%) Fireworks
6 9 (1.35%) Microsoft Project
6 9 (1.35%) RoboHelp
7 6 (0.90%) Adobe XD
8 3 (0.45%) Camtasia
8 3 (0.45%) FrameMaker
9 1 (0.15%) Spreadsheet
Business Applications
1 20 (2.99%) Dynamics CRM
2 16 (2.40%) Oracle Receivables
3 12 (1.80%) SDL Web 8
4 11 (1.65%) NEC Housing
5 5 (0.75%) NetSuite
5 5 (0.75%) Shopify
6 4 (0.60%) Adobe Campaign
6 4 (0.60%) Dynamics NAV
6 4 (0.60%) Magento
7 3 (0.45%) Payment Gateway
8 2 (0.30%) FLEXCUBE
8 2 (0.30%) Oracle BPM
8 2 (0.30%) Oracle EBS
8 2 (0.30%) Remedy ITSM
8 2 (0.30%) Sage X3
8 2 (0.30%) SAP MII
8 2 (0.30%) TIBCO iProcess
8 2 (0.30%) Unit4 Business World
9 1 (0.15%) Teamcenter
9 1 (0.15%) Visualfiles
Cloud Services
1 158 (23.65%) Azure
2 91 (13.62%) AWS
3 83 (12.43%) Azure DevOps
4 49 (7.34%) Cloud Computing
4 49 (7.34%) Power Platform
4 49 (7.34%) SaaS
5 48 (7.19%) GCP
6 32 (4.79%) Azure Service Bus
7 29 (4.34%) Azure Cosmos DB
7 29 (4.34%) SonarCloud
8 24 (3.59%) Power Automate
9 23 (3.44%) GitHub
10 19 (2.84%) Dynamics 365
11 17 (2.54%) PowerApps
12 14 (2.10%) Microsoft 365
13 12 (1.80%) Adobe Creative Cloud
13 12 (1.80%) NuGet
14 9 (1.35%) BrowserStack
15 8 (1.20%) Boomi
16 7 (1.05%) Entra ID
Communications & Networking
1 74 (11.08%) Broadband
2 40 (5.99%) Wireshark
3 21 (3.14%) TCP/IP
4 20 (2.99%) HTTP
5 13 (1.95%) Internet
5 13 (1.95%) SSL
6 10 (1.50%) Firewall
7 7 (1.05%) Kerberos
8 6 (0.90%) Remote Desktop
8 6 (0.90%) RS-232
8 6 (0.90%) RS-485
9 5 (0.75%) VPN
10 4 (0.60%) Ethernet
10 4 (0.60%) VoIP
11 3 (0.45%) ASN.1
11 3 (0.45%) SMS
12 2 (0.30%) AMQP
12 2 (0.30%) MQTT
12 2 (0.30%) SSH
13 1 (0.15%) DMVPN
Database & Business Intelligence
1 129 (19.31%) SQL Server
2 52 (7.78%) MySQL
3 45 (6.74%) Power BI
3 45 (6.74%) Tableau
4 38 (5.69%) Elasticsearch
5 32 (4.79%) Data Warehouse
6 31 (4.64%) SQL Server Reporting Services
7 26 (3.89%) PostgreSQL
7 26 (3.89%) SQL Server Integration Services
8 19 (2.84%) Relational Database
9 17 (2.54%) Oracle Reports
10 14 (2.10%) Data Lake
10 14 (2.10%) OLTP
11 13 (1.95%) BusinessObjects
11 13 (1.95%) Oracle Database
12 10 (1.50%) NoSQL
13 9 (1.35%) RDBMS
14 8 (1.20%) MariaDB
15 7 (1.05%) FileMaker
15 7 (1.05%) SQL Server Analysis Services
Development Applications
1 130 (19.46%) Git
2 108 (16.17%) Visual Studio
3 67 (10.03%) JIRA
4 47 (7.04%) Jenkins
4 47 (7.04%) Octopus Deploy
5 46 (6.89%) Team Foundation Server
6 34 (5.09%) Fiddler
7 29 (4.34%) MSBuild
7 29 (4.34%) SpecFlow
8 26 (3.89%) NUnit
9 24 (3.59%) TeamCity
10 21 (3.14%) Selenium
11 19 (2.84%) SoapUI
12 18 (2.69%) Moq
13 16 (2.40%) JUnit
13 16 (2.40%) PowerBuilder
14 13 (1.95%) Maven
14 13 (1.95%) Oracle APEX
14 13 (1.95%) Subversion
15 12 (1.80%) git-flow
General
1 203 (30.39%) Social Skills
2 126 (18.86%) Analytical Skills
3 117 (17.51%) Finance
4 70 (10.48%) Marketing
5 38 (5.69%) Advertising
6 30 (4.49%) Retail
7 27 (4.04%) Banking
8 21 (3.14%) Aerospace
9 17 (2.54%) Inclusion and Diversity
9 17 (2.54%) Law
10 15 (2.25%) Automotive
11 14 (2.10%) Public Sector
12 13 (1.95%) Electronics
12 13 (1.95%) Local Government
12 13 (1.95%) Organisational Skills
13 12 (1.80%) Dutch Language
13 12 (1.80%) German Language
13 12 (1.80%) Legal
13 12 (1.80%) Military
14 11 (1.65%) Investment Banking
Job Titles
1 259 (38.77%) Developer
2 102 (15.27%) Senior
3 87 (13.02%) Analyst
4 63 (9.43%) Senior Developer
5 56 (8.38%) Architect
5 56 (8.38%) Consultant
6 54 (8.08%) Lead
7 40 (5.99%) Cybersecurity Analyst
7 40 (5.99%) Development Analyst
7 40 (5.99%) Security Analyst
7 40 (5.99%) Technical Consultant
8 36 (5.39%) C# Developer
9 34 (5.09%) Service Delivery Executive
10 31 (4.64%) Technical Architect
11 30 (4.49%) Software Engineer
12 28 (4.19%) Technical Support
13 27 (4.04%) Oracle Developer
14 25 (3.74%) Java Developer
15 24 (3.59%) Full-Stack Developer
16 23 (3.44%) Senior C# Developer
Libraries, Frameworks & Software Standards
1 325 (48.65%) HTML
2 256 (38.32%) JSON
3 228 (34.13%) CSS
4 205 (30.69%) REST
5 197 (29.49%) .NET
6 147 (22.01%) Web Services
7 122 (18.26%) SOAP
8 80 (11.98%) ASP.NET
9 76 (11.38%) .NET Framework
10 69 (10.33%) React
11 63 (9.43%) Twitter Bootstrap
12 49 (7.34%) jQuery
13 47 (7.04%) RESTful
14 44 (6.59%) AngularJS
15 42 (6.29%) CSS3
16 40 (5.99%) .NET Core
17 36 (5.39%) ASP.NET MVC
17 36 (5.39%) Entity Framework
18 32 (4.79%) XSLT
19 30 (4.49%) Ajax
Miscellaneous
1 59 (8.83%) Mobile App
2 43 (6.44%) Onboarding
3 40 (5.99%) Cyber Threat
4 34 (5.09%) Social Media
5 26 (3.89%) NHS
6 21 (3.14%) Management Information System
7 20 (2.99%) Data Structures
8 18 (2.69%) Greenfield Project
9 17 (2.54%) Algorithms
10 16 (2.40%) PropTech
11 15 (2.25%) Self-Motivation
12 14 (2.10%) Linux Command Line
12 14 (2.10%) Product Ownership
13 12 (1.80%) Enterprise Software
13 12 (1.80%) Legacy Code
14 9 (1.35%) Robotics
15 8 (1.20%) CMDB
15 8 (1.20%) Distributed Systems
16 6 (0.90%) Blog
16 6 (0.90%) Market Risk
Operating Systems
1 88 (13.17%) Linux
2 62 (9.28%) Windows
3 17 (2.54%) Unix
4 12 (1.80%) Android
5 11 (1.65%) Mac OS
6 8 (1.20%) VMS
6 8 (1.20%) Windows Server
7 5 (0.75%) Apple iOS
8 3 (0.45%) Embedded Linux
9 2 (0.30%) AIX
9 2 (0.30%) Ubuntu
10 1 (0.15%) CentOS
10 1 (0.15%) Red Hat Enterprise Linux
Processes & Methodologies
1 254 (38.02%) Problem-Solving
2 178 (26.65%) Agile
3 132 (19.76%) DevOps
4 96 (14.37%) Microservices
5 88 (13.17%) Software Testing
6 81 (12.13%) Computer Science
7 77 (11.53%) MVC
8 76 (11.38%) Customer Service
9 72 (10.78%) Mentoring
10 67 (10.03%) Test Automation
11 61 (9.13%) Scrum
12 59 (8.83%) CI/CD
13 56 (8.38%) Code Quality
14 54 (8.08%) Design Patterns
15 52 (7.78%) Software Engineering
16 51 (7.63%) CRM
17 50 (7.49%) OO
18 49 (7.34%) Business Intelligence
18 49 (7.34%) ETL
19 48 (7.19%) Service Delivery
Programming Languages
1 344 (51.50%) SQL
2 260 (38.92%) JavaScript
3 197 (29.49%) C#
4 154 (23.05%) Java
5 126 (18.86%) Python
6 66 (9.88%) Bash
7 54 (8.08%) T-SQL
8 47 (7.04%) PL/SQL
9 41 (6.14%) C++
10 37 (5.54%) R
11 31 (4.64%) C
12 30 (4.49%) VB.NET
13 22 (3.29%) VB
14 21 (3.14%) PowerShell
15 18 (2.69%) PHP
16 17 (2.54%) Shell Script
16 17 (2.54%) TypeScript
17 14 (2.10%) XPath
18 12 (1.80%) Embedded C++
19 11 (1.65%) Groovy
Qualifications
1 162 (24.25%) Degree
2 50 (7.49%) Computer Science Degree
3 39 (5.84%) Security Cleared
4 27 (4.04%) SC Cleared
5 17 (2.54%) ISEB
5 17 (2.54%) ISTQB
6 10 (1.50%) DBS Check
7 8 (1.20%) DV Cleared
7 8 (1.20%) Master's Degree
8 4 (0.60%) Microsoft Certification
8 4 (0.60%) Numerate Degree
9 3 (0.45%) Azure Certification
9 3 (0.45%) ITIL Certification
10 2 (0.30%) BPSS Clearance
10 2 (0.30%) CCNA
10 2 (0.30%) Cisco Certification
10 2 (0.30%) ISTQB Foundation Certification
10 2 (0.30%) TOGAF Certification
11 1 (0.15%) AWS Certification
11 1 (0.15%) AWS Certified Developer
Quality Assurance & Compliance
1 44 (6.59%) QA
2 30 (4.49%) GDPR
3 24 (3.59%) SLA
4 22 (3.29%) Accessibility
5 15 (2.25%) ISO 9001
6 8 (1.20%) Data Quality
7 5 (0.75%) ISO 20022
8 3 (0.45%) HL7
8 3 (0.45%) ISO/IEC 20000
8 3 (0.45%) ISO/IEC 27001
9 2 (0.30%) California Consumer Privacy Act
9 2 (0.30%) WCAG
10 1 (0.15%) ISO 15022
10 1 (0.15%) ITGC
System Software
1 52 (7.78%) Docker
2 10 (1.50%) Active Directory
3 6 (0.90%) Virtual Servers
4 5 (0.75%) Firmware
4 5 (0.75%) Virtual Machines
5 4 (0.60%) vSphere
6 1 (0.15%) VMware Infrastructure
Systems Management
1 41 (6.14%) Kubernetes
2 12 (1.80%) Ansible
3 9 (1.35%) HP ALM
4 6 (0.90%) Terraform
5 4 (0.60%) Grafana
5 4 (0.60%) Single Sign-On
6 2 (0.30%) Docker Swarm
6 2 (0.30%) Progress Chef
7 1 (0.15%) HP UCMDB
7 1 (0.15%) Podman
7 1 (0.15%) Puppet
Vendors
1 134 (20.06%) Microsoft
2 89 (13.32%) Oracle
3 82 (12.28%) Google
4 40 (5.99%) Splunk
5 36 (5.39%) Adobe
6 29 (4.34%) ServiceNow
7 13 (1.95%) HP
7 13 (1.95%) Murex
8 12 (1.80%) Cognizant
9 11 (1.65%) NEC
10 9 (1.35%) SAP
11 8 (1.20%) Sybase
12 7 (1.05%) Databricks
12 7 (1.05%) Salesforce
12 7 (1.05%) Trayport
13 6 (0.90%) Aderant
13 6 (0.90%) MuleSoft
13 6 (0.90%) OpenText
13 6 (0.90%) Screaming Frog
13 6 (0.90%) Siebel