Law Jobs in London

Law
England > London

The table below looks at the prevalence of the term Law in permanent job vacancies advertised in London. Included is a benchmarking guide to the salaries offered in vacancies that have cited Law over the 6 months to 15 May 2024 with a comparison to the same period over the previous 2 years.

6 months to
15 May 2024
Same period 2023 Same period 2022
Rank 54 109 206
Rank change year-on-year +55 +97 -16
Permanent jobs citing Law 1,090 1,072 1,489
As % of all permanent jobs advertised in London 4.61% 3.18% 2.17%
As % of the General category 6.79% 4.62% 3.17%
Number of salaries quoted 714 563 794
10th Percentile £37,650 £37,685 £34,500
25th Percentile £50,000 £46,250 £43,875
Median annual salary (50th Percentile) £67,500 £65,000 £60,000
Median % change year-on-year +3.85% +8.33% -4.00%
75th Percentile £82,500 £78,750 £78,750
90th Percentile £97,500 £92,500 £95,000
England median annual salary £54,000 £52,500 £50,000
% change year-on-year +2.86% +5.00% -

All General Skills
London

Law is in the General Skills category. The following table is for comparison with the above and provides summary statistics for all permanent job vacancies advertised in London with a requirement for common skills.

Permanent vacancies with a requirement for common skills 16,054 23,188 46,968
As % of all permanent jobs advertised in London 67.93% 68.74% 68.34%
Number of salaries quoted 11,367 16,026 22,455
10th Percentile £36,250 £42,000 £41,250
25th Percentile £50,000 £54,500 £52,500
Median annual salary (50th Percentile) £70,000 £74,000 £70,000
Median % change year-on-year -5.41% +5.71% -
75th Percentile £95,000 £95,000 £92,500
90th Percentile £118,750 £120,000 £112,500
England median annual salary £52,500 £60,000 £60,000
% change year-on-year -12.50% - +4.35%

Law
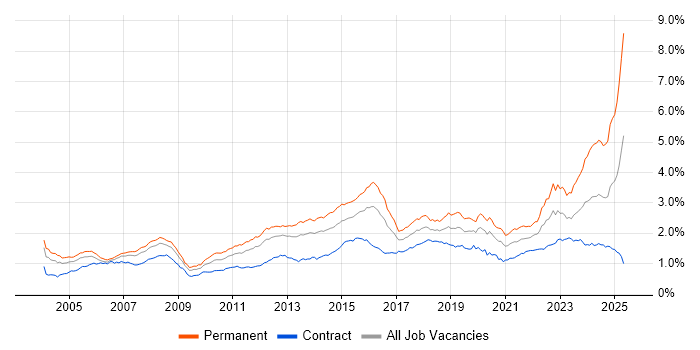
Job Vacancy Trend in London

Job postings citing Law as a proportion of all IT jobs advertised in London.

Job vacancy trend for Law in London

Law
Salary Trend in London

3-month moving average salary quoted in jobs citing Law in London.

Salary trend for Law in London

Law
Salary Histogram in London

Salary distribution for jobs citing Law in London over the 6 months to 15 May 2024.

Salary histogram for Law in London

Law
Job Locations in London

The table below looks at the demand and provides a guide to the median salaries quoted in IT jobs citing Law within the London region over the 6 months to 15 May 2024. The 'Rank Change' column provides an indication of the change in demand within each location based on the same 6 month period last year.

Location Rank Change
on Same Period
Last Year
Matching
Permanent
IT Job Ads
Median Salary
Past 6 Months
Median Salary
% Change
on Same Period
Last Year
Live
Jobs
Central London +24 211 £66,250 +5.16% 53
West London +21 30 £75,000 +114.29% 12
South London +22 26 £55,000 -16.98% 3
East London +29 12 £80,000 +28.00% 33
North London - 5 £54,950 - 3
Law
England

Law
Co-occurring Skills and Capabilities in London by Category

The follow tables expand on the table above by listing co-occurrences grouped by category. The same employment type, locality and period is covered with up to 20 co-occurrences shown in each of the following categories:

Application Platforms
1 47 (4.31%) SharePoint
2 38 (3.49%) Microsoft Exchange
3 19 (1.74%) IIS
4 13 (1.19%) SAS
5 11 (1.01%) Apache
5 11 (1.01%) CMS
6 10 (0.92%) Apache Airflow
7 9 (0.83%) Confluence
7 9 (0.83%) Skype for Business
8 8 (0.73%) Apache Spark
9 5 (0.46%) Appian
9 5 (0.46%) JBoss
10 3 (0.28%) Apache Pulsar
11 2 (0.18%) Luigi
11 2 (0.18%) NServiceBus
12 1 (0.092%) Documentum
12 1 (0.092%) Tomcat
Applications
1 70 (6.42%) Microsoft Office
2 50 (4.59%) Microsoft Excel
3 25 (2.29%) Microsoft PowerPoint
4 11 (1.01%) SPSS
5 6 (0.55%) MS Visio
6 4 (0.37%) Microsoft Project
7 2 (0.18%) Spreadsheet
8 1 (0.092%) Adobe After Effects
8 1 (0.092%) Adobe Creative Suite
8 1 (0.092%) Adobe Illustrator
8 1 (0.092%) Adobe Premiere
8 1 (0.092%) Camtasia
8 1 (0.092%) Chatbot
8 1 (0.092%) InDesign
8 1 (0.092%) Photoshop
8 1 (0.092%) S-PLUS
Business Applications
1 19 (1.74%) Elite 3E
2 16 (1.47%) Dynamics CRM
3 11 (1.01%) Relativity
4 8 (0.73%) Carpe Diem
4 8 (0.73%) Dynamics AX
4 8 (0.73%) Visualfiles
5 7 (0.64%) Temenos T24
6 6 (0.55%) Remedy ITSM
7 5 (0.46%) Oracle Assets
7 5 (0.46%) Oracle EBS
7 5 (0.46%) Oracle EBS R12
7 5 (0.46%) Oracle General Ledger
7 5 (0.46%) Oracle Payables
7 5 (0.46%) Oracle Receivables
8 4 (0.37%) SAP S/4HANA
9 3 (0.28%) Dynamics NAV
9 3 (0.28%) Oracle Financials
9 3 (0.28%) SAP HCM
10 2 (0.18%) Veritas eDiscovery
10 2 (0.18%) Workday HCM
Cloud Services
1 196 (17.98%) Azure
2 129 (11.83%) Microsoft 365
3 114 (10.46%) SaaS
4 107 (9.82%) AWS
5 76 (6.97%) Dynamics 365
6 60 (5.50%) Power Platform
7 53 (4.86%) GCP
8 48 (4.40%) Entra ID
9 34 (3.12%) Azure DevOps
10 28 (2.57%) Amazon EKS
11 27 (2.48%) Serverless
12 24 (2.20%) AWS Lambda
13 23 (2.11%) Amazon ECS
13 23 (2.11%) PaaS
14 21 (1.93%) Amazon S3
15 15 (1.38%) Amazon EC2
15 15 (1.38%) Power Automate
16 14 (1.28%) IaaS
17 12 (1.10%) AWS Step Functions
17 12 (1.10%) Azure Logic Apps
Communications & Networking
1 71 (6.51%) Firewall
2 39 (3.58%) LAN
3 37 (3.39%) WAN
4 29 (2.66%) VPN
5 24 (2.20%) MPLS
5 24 (2.20%) SD-WAN
5 24 (2.20%) TCP/IP
6 22 (2.02%) BGP
6 22 (2.02%) DNS
6 22 (2.02%) Internet
6 22 (2.02%) OSPF
7 19 (1.74%) Wireless
8 13 (1.19%) Skype
9 12 (1.10%) 5G
9 12 (1.10%) Intrusion Detection
9 12 (1.10%) Network Security
9 12 (1.10%) SAN
9 12 (1.10%) Unified Communications
9 12 (1.10%) VoIP
9 12 (1.10%) Wi-Fi
Database & Business Intelligence
1 42 (3.85%) SQL Server
2 36 (3.30%) Power BI
3 31 (2.84%) Relational Database
4 26 (2.39%) Data Warehouse
5 22 (2.02%) PostgreSQL
6 18 (1.65%) Amazon RDS
7 17 (1.56%) EDRMS
7 17 (1.56%) Oracle Reports
8 15 (1.38%) DynamoDB
9 14 (1.28%) BigQuery
10 12 (1.10%) MongoDB
11 11 (1.01%) Big Data
11 11 (1.01%) SQL Server Reporting Services
12 9 (0.83%) Metadata
13 8 (0.73%) NoSQL
14 7 (0.64%) Tableau
15 6 (0.55%) Amazon Athena
15 6 (0.55%) Azure SQL Database
15 6 (0.55%) CockroachDB
15 6 (0.55%) Data Hub
Development Applications
1 47 (4.31%) Git
2 26 (2.39%) JIRA
3 20 (1.83%) Jenkins
4 15 (1.38%) GitLab
4 15 (1.38%) TeamCity
5 11 (1.01%) Visual Studio
6 7 (0.64%) Team Foundation Server
7 6 (0.55%) Crashlytics
7 6 (0.55%) Sonatype Nexus
8 5 (0.46%) Jaeger
9 3 (0.28%) Cypress.io
9 3 (0.28%) Selenium
10 2 (0.18%) LoadRunner
10 2 (0.18%) NeoLoad
11 1 (0.092%) Appium
11 1 (0.092%) Bitbucket
11 1 (0.092%) Cucumber
11 1 (0.092%) MSI
11 1 (0.092%) REST Assured
11 1 (0.092%) Vite
General
1 401 (36.79%) Finance
2 327 (30.00%) Social Skills
3 317 (29.08%) Legal
4 286 (26.24%) Inclusion and Diversity
5 129 (11.83%) Analytical Skills
6 96 (8.81%) Banking
7 76 (6.97%) Marketing
8 55 (5.05%) Retail
9 39 (3.58%) Pharmaceutical
10 31 (2.84%) Presentation Skills
11 24 (2.20%) Organisational Skills
12 21 (1.93%) Documentation Skills
13 18 (1.65%) Financial Institution
13 18 (1.65%) Public Sector
14 17 (1.56%) Police
15 13 (1.19%) Telecoms
16 11 (1.01%) Advertising
17 10 (0.92%) Front Office
18 9 (0.83%) Billing
18 9 (0.83%) Influencing Skills
Job Titles
1 248 (22.75%) Senior
2 214 (19.63%) Analyst
3 118 (10.83%) Senior Manager
4 103 (9.45%) Lead
5 99 (9.08%) Developer
6 91 (8.35%) Service Manager
7 90 (8.26%) Delivery Manager
7 90 (8.26%) Service Delivery Manager
8 78 (7.16%) Senior Delivery Manager
8 78 (7.16%) Senior Service Delivery Manager
8 78 (7.16%) Senior Service Manager
9 52 (4.77%) IT Analyst
10 50 (4.59%) Support Analyst
11 49 (4.50%) Consultant
12 44 (4.04%) Software Engineer
13 43 (3.94%) Systems Analyst
14 42 (3.85%) Architect
15 40 (3.67%) Financial Analyst
16 37 (3.39%) Security Analyst
17 36 (3.30%) Project Manager
Libraries, Frameworks & Software Standards
1 52 (4.77%) React
2 45 (4.13%) .NET
3 29 (2.66%) HTML
3 29 (2.66%) Kafka
4 27 (2.48%) REST
5 25 (2.29%) CSS
6 22 (2.02%) RESTful
7 19 (1.74%) Oracle Fusion
8 18 (1.65%) Django
8 18 (1.65%) RabbitMQ
9 16 (1.47%) .NET Core
9 16 (1.47%) .NET Framework
9 16 (1.47%) AngularJS
9 16 (1.47%) JSON
9 16 (1.47%) XML
10 14 (1.28%) ARM Templates
10 14 (1.28%) OAuth
10 14 (1.28%) Redux
10 14 (1.28%) Web Services
11 12 (1.10%) SAML
Miscellaneous
1 56 (5.14%) Management Information System
2 40 (3.67%) Blog
3 36 (3.30%) Cloud Native
4 28 (2.57%) Data Centre
5 25 (2.29%) Video Conferencing
6 22 (2.02%) Client/Server
6 22 (2.02%) Distributed Systems
6 22 (2.02%) Security Posture
7 20 (1.83%) Enterprise Software
8 18 (1.65%) Self-Motivation
9 16 (1.47%) Data Structures
9 16 (1.47%) Life Science
9 16 (1.47%) Mobile App
10 13 (1.19%) Onboarding
11 11 (1.01%) Public Cloud
12 10 (0.92%) IoT
12 10 (0.92%) Linux Command Line
12 10 (0.92%) Virtual Team
13 9 (0.83%) Blockchain
13 9 (0.83%) CMDB
Operating Systems
1 111 (10.18%) Windows
2 47 (4.31%) Windows Server
3 38 (3.49%) Linux
4 37 (3.39%) Windows 10
5 14 (1.28%) Apple iOS
6 13 (1.19%) Android
7 10 (0.92%) Unix
8 7 (0.64%) VMS
9 6 (0.55%) AIX
10 5 (0.46%) Windows Server 2003
11 3 (0.28%) Mac OS X
11 3 (0.28%) Windows Server 2016
11 3 (0.28%) Windows Server 2019
12 2 (0.18%) CentOS
Processes & Methodologies
1 160 (14.68%) Agile
2 150 (13.76%) Mentoring
3 147 (13.49%) Problem-Solving
4 121 (11.10%) Analytics
5 111 (10.18%) Information Security
6 109 (10.00%) Cybersecurity
7 105 (9.63%) Service Delivery
8 101 (9.27%) DevOps
9 91 (8.35%) CI/CD
10 90 (8.26%) Performance Management
11 89 (8.17%) Contract Negotiation
12 88 (8.07%) Software Engineering
13 85 (7.80%) Risk Management
14 84 (7.71%) Fintech
15 81 (7.43%) ITIL
16 79 (7.25%) Change Management
17 76 (6.97%) Project Management
18 72 (6.61%) Customer Service
19 71 (6.51%) Coaching
20 70 (6.42%) Artificial Intelligence
Programming Languages
1 145 (13.30%) SQL
2 114 (10.46%) Python
3 63 (5.78%) Java
4 60 (5.50%) JavaScript
5 53 (4.86%) C#
6 46 (4.22%) PowerShell
7 32 (2.94%) T-SQL
7 32 (2.94%) TypeScript
8 25 (2.29%) Go
9 21 (1.93%) Kotlin
10 16 (1.47%) Bicep
10 16 (1.47%) C
11 10 (0.92%) Bash
11 10 (0.92%) Scala
12 8 (0.73%) XPath
13 6 (0.55%) Swift
14 2 (0.18%) Ada
14 2 (0.18%) Data Analysis Expressions
14 2 (0.18%) VBA
15 1 (0.092%) Shell Script
Qualifications
1 147 (13.49%) Degree
2 69 (6.33%) CISSP
3 43 (3.94%) Security Cleared
4 30 (2.75%) ACCA
5 29 (2.66%) CISM
6 28 (2.57%) CISA
7 25 (2.29%) SC Cleared
8 23 (2.11%) Azure Certification
8 23 (2.11%) Computer Science Degree
9 20 (1.83%) Master's Degree
10 19 (1.74%) AWS Certification
11 17 (1.56%) CEH
12 16 (1.47%) Cisco Certification
13 14 (1.28%) SSCP
14 13 (1.19%) CompTIA Security+
15 12 (1.10%) CCNA
15 12 (1.10%) GIAC
15 12 (1.10%) GSEC
16 11 (1.01%) Numerate Degree
16 11 (1.01%) VMware Certified Professional (VCP)
Quality Assurance & Compliance
1 96 (8.81%) SLA
2 81 (7.43%) ISO/IEC 27001
3 51 (4.68%) QA
4 37 (3.39%) GDPR
5 31 (2.84%) IFRS
6 24 (2.20%) Cyber Essentials
6 24 (2.20%) PMO
7 22 (2.02%) NIST
8 18 (1.65%) Data Quality
8 18 (1.65%) GRC
9 16 (1.47%) IFRS 9
10 15 (1.38%) Cyber Essentials PLUS
11 14 (1.28%) IFRS 17
11 14 (1.28%) Solvency II
12 13 (1.19%) CDISC
12 13 (1.19%) Good Clinical Practice
13 10 (0.92%) 21 CFR Part 11
14 9 (0.83%) ISO/IEC 27002 (supersedes ISO/IEC 17799)
15 8 (0.73%) GMP
16 7 (0.64%) PCI DSS
System Software
1 97 (8.90%) Active Directory
2 29 (2.66%) Docker
3 13 (1.19%) VMware Infrastructure
4 9 (0.83%) Firmware
4 9 (0.83%) VMware ESXi
5 4 (0.37%) Hyper-V
5 4 (0.37%) Virtual Desktop
6 3 (0.28%) Terminal Services
7 2 (0.18%) Virtual Machines
8 1 (0.092%) vSphere
Systems Management
1 46 (4.22%) Kubernetes
2 41 (3.76%) Terraform
3 24 (2.20%) Microsoft Intune
4 14 (1.28%) Ansible
4 14 (1.28%) SCCM
4 14 (1.28%) Single Sign-On
5 11 (1.01%) Grafana
6 9 (0.83%) vCenter Server
7 8 (0.73%) logstash
7 8 (0.73%) vRealize
8 6 (0.55%) QRadar
9 5 (0.46%) Kiali
10 4 (0.37%) AirWatch
11 3 (0.28%) Active Directory Federation Services
12 2 (0.18%) Graphite
12 2 (0.18%) Nagios
12 2 (0.18%) PowerCLI
12 2 (0.18%) Puppet
12 2 (0.18%) vRealize Orchestrator
12 2 (0.18%) ZABBIX
Vendors
1 272 (24.95%) Microsoft
2 97 (8.90%) ServiceNow
3 80 (7.34%) Dell
4 52 (4.77%) iManage
5 41 (3.76%) Oracle
6 39 (3.58%) Cisco
7 36 (3.30%) Citrix
8 32 (2.94%) VMware
9 31 (2.84%) Google
10 30 (2.75%) Aderant
10 30 (2.75%) CA
10 30 (2.75%) Intapp
11 18 (1.65%) SolarWinds
12 14 (1.28%) SAP
12 14 (1.28%) Splunk
13 13 (1.19%) CheckPoint
13 13 (1.19%) Databricks
13 13 (1.19%) NetApp
14 10 (0.92%) Veeam
15 9 (0.83%) Nuix