Service Management Jobs in London

Service Management
England > London

The table below provides summary statistics for permanent job vacancies advertised in London requiring Service Management skills. It includes a benchmarking guide to the annual salaries offered in vacancies that cited Service Management over the 6 months leading up to 17 May 2025, comparing them to the same period in the previous two years.

6 months to
17 May 2025
Same period 2024 Same period 2023
Rank 129 138 135
Rank change year-on-year +9 -3 +128
Permanent jobs citing Service Management 330 545 911
As % of all permanent jobs advertised in London 2.55% 2.30% 2.70%
As % of the Processes & Methodologies category 2.65% 2.53% 2.83%
Number of salaries quoted 230 417 631
10th Percentile £40,395 £35,000 £35,000
25th Percentile £51,250 £47,500 £45,000
Median annual salary (50th Percentile) £65,000 £65,000 £62,500
Median % change year-on-year - +4.00% +8.91%
75th Percentile £80,000 £87,500 £83,125
90th Percentile £110,000 £98,750 £92,500
England median annual salary £55,000 £50,000 £54,750
% change year-on-year +10.00% -8.68% +4.29%

All Process and Methodology Skills
London

Service Management falls under the Processes and Methodologies category. For comparison with the information above, the following table provides summary statistics for all permanent job vacancies requiring process or methodology skills in London.

Permanent vacancies with a requirement for process or methodology skills 12,437 21,541 32,138
As % of all permanent jobs advertised in London 96.16% 91.06% 95.35%
Number of salaries quoted 7,272 15,921 23,160
10th Percentile £42,000 £37,500 £43,241
25th Percentile £56,000 £51,500 £55,000
Median annual salary (50th Percentile) £75,000 £70,073 £75,000
Median % change year-on-year +7.03% -6.57% +7.14%
75th Percentile £100,000 £95,000 £95,000
90th Percentile £122,500 £115,000 £115,000
England median annual salary £57,500 £55,000 £62,500
% change year-on-year +4.55% -12.00% +4.17%

Service Management
Job Vacancy Trend in London

Job postings citing Service Management as a proportion of all IT jobs advertised in London.
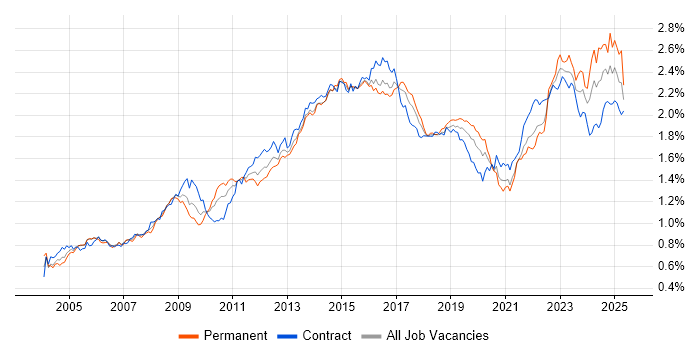
Job vacancy trend for Service Management in London

Service Management
Salary Trend in London

3-month moving average salary quoted in jobs citing Service Management in London.

Salary trend for Service Management in London

Service Management
Salary Histogram in London

Salary distribution for jobs citing Service Management in London over the 6 months to 17 May 2025.

Salary histogram for Service Management in London

Service Management
Job Locations in London

The table below looks at the demand and provides a guide to the median salaries quoted in IT jobs citing Service Management within the London region over the 6 months to 17 May 2025. The 'Rank Change' column provides an indication of the change in demand within each location based on the same 6 month period last year.

Location Rank Change
on Same Period
Last Year
Matching
Permanent
IT Job Ads
Median Salary
Past 6 Months
Median Salary
% Change
on Same Period
Last Year
Live
Jobs
Central London 0 75 £65,000 - 16
East London -6 7 £65,000 +73.33% 4
South London -15 6 £52,656 +22.46% 4
West London +24 5 £95,000 +113.48% 8
Service Management
England

Service Management
Co-occurring Skills and Capabilities in London by Category

The follow tables expand on the table above by listing co-occurrences grouped by category. The same employment type, locality and period is covered with up to 20 co-occurrences shown in each of the following categories:

Application Platforms
1 25 (7.58%) SharePoint
2 11 (3.33%) Microsoft Exchange
3 9 (2.73%) Confluence
4 2 (0.61%) BizTalk Server
4 2 (0.61%) IIS
5 1 (0.30%) Apache
5 1 (0.30%) Apache Airflow
5 1 (0.30%) Exchange Server 2010
5 1 (0.30%) Tomcat
Applications
1 17 (5.15%) Microsoft Office
2 11 (3.33%) Maya
3 5 (1.52%) Chatbot
4 3 (0.91%) Microsoft Excel
5 2 (0.61%) Microsoft Project
6 1 (0.30%) Camtasia
6 1 (0.30%) Final Cut Pro
6 1 (0.30%) Microsoft PowerPoint
Business Applications
1 22 (6.67%) Dynamics CRM
2 9 (2.73%) Remedy ITSM
3 3 (0.91%) SAP CX
4 2 (0.61%) Carpe Diem
4 2 (0.61%) Elite 3E
4 2 (0.61%) NEC Housing
4 2 (0.61%) Salesforce CRM
5 1 (0.30%) Shopify
Cloud Services
1 65 (19.70%) Azure
2 50 (15.15%) Microsoft 365
3 26 (7.88%) Power Platform
4 24 (7.27%) SaaS
5 21 (6.36%) AWS
6 20 (6.06%) Dynamics 365
7 16 (4.85%) Entra ID
8 13 (3.94%) Boomi
9 12 (3.64%) Azure Monitor
10 11 (3.33%) Salesforce Commerce Cloud
11 10 (3.03%) Azure Data Factory
11 10 (3.03%) OneDrive
12 9 (2.73%) Mimecast
12 9 (2.73%) Power Automate
13 8 (2.42%) PowerApps
14 7 (2.12%) Azure Logic Apps
15 5 (1.52%) IaaS
15 5 (1.52%) PaaS
16 4 (1.21%) Amazon Bedrock
16 4 (1.21%) Snowflake
Communications & Networking
1 15 (4.55%) VPN
2 10 (3.03%) DNS
3 9 (2.73%) LAN
4 8 (2.42%) Firewall
5 7 (2.12%) TCP/IP
6 6 (1.82%) WAN
6 6 (1.82%) Wireless
7 5 (1.52%) Unified Communications
8 4 (1.21%) Network Security
9 3 (0.91%) DHCP
9 3 (0.91%) SAN
9 3 (0.91%) SD-WAN
9 3 (0.91%) VoIP
10 2 (0.61%) Intranet
10 2 (0.61%) WebEx
11 1 (0.30%) ADSL
11 1 (0.30%) Internet
11 1 (0.30%) NetScaler
11 1 (0.30%) SSL
11 1 (0.30%) Wi-Fi
Database & Business Intelligence
1 27 (8.18%) SQL Server
2 12 (3.64%) Data Lake
3 11 (3.33%) Power BI
4 9 (2.73%) SQL Server Reporting Services
5 8 (2.42%) Relational Database
5 8 (2.42%) Tableau
6 7 (2.12%) DB2
6 7 (2.12%) SQL Server Integration Services
7 6 (1.82%) Metadata
8 4 (1.21%) Data Vault
8 4 (1.21%) Data Warehouse
8 4 (1.21%) GIS
8 4 (1.21%) Semantic Layer
9 1 (0.30%) Amazon RDS
9 1 (0.30%) DynamoDB
9 1 (0.30%) Electronic Patient Records
9 1 (0.30%) Geospatial Data
9 1 (0.30%) MySQL
Development Applications
1 27 (8.18%) JIRA
2 7 (2.12%) Visual Studio
3 2 (0.61%) Git
4 1 (0.30%) Artifactory
4 1 (0.30%) Bitbucket
4 1 (0.30%) GitLab
4 1 (0.30%) Jenkins
4 1 (0.30%) Maven
General
1 166 (50.30%) Social Skills
2 121 (36.67%) Finance
3 78 (23.64%) Analytical Skills
4 46 (13.94%) Marketing
5 35 (10.61%) Law
6 28 (8.48%) Legal
7 21 (6.36%) Telecoms
8 20 (6.06%) Public Sector
9 19 (5.76%) Banking
9 19 (5.76%) Inclusion and Diversity
9 19 (5.76%) Manufacturing
10 18 (5.45%) Pharmaceutical
11 16 (4.85%) Presentation Skills
12 15 (4.55%) Electronics
12 15 (4.55%) Games
13 14 (4.24%) Retail
14 11 (3.33%) Organisational Skills
15 9 (2.73%) Financial Institution
16 7 (2.12%) Influencing Skills
17 5 (1.52%) Documentation Skills
Job Titles
1 84 (25.45%) Analyst
2 56 (16.97%) Senior
3 41 (12.42%) IT Manager
4 39 (11.82%) IT Support
5 38 (11.52%) Lead
6 37 (11.21%) Architect
7 33 (10.00%) Service Manager
8 29 (8.79%) Applications Support
8 29 (8.79%) Support Analyst
9 23 (6.97%) Service Analyst
9 23 (6.97%) Support Manager
10 22 (6.67%) Delivery Manager
11 19 (5.76%) Applications Support Analyst
12 17 (5.15%) Operations Manager
13 16 (4.85%) IT Analyst
13 16 (4.85%) Senior Architect
13 16 (4.85%) Support Engineer
14 14 (4.24%) IT Support Manager
14 14 (4.24%) Senior Analyst
15 13 (3.94%) CRM Architect
Libraries, Frameworks & Software Standards
1 18 (5.45%) .NET
2 15 (4.55%) ASP.NET
3 8 (2.42%) SOAP
4 7 (2.12%) .NET Framework
5 6 (1.82%) Web Services
6 5 (1.52%) HTML
7 4 (1.21%) AngularJS
7 4 (1.21%) LangChain
7 4 (1.21%) XML
8 3 (0.91%) ASP.NET Web API
8 3 (0.91%) LDAP
8 3 (0.91%) REST
9 2 (0.61%) Ajax
9 2 (0.61%) CSS
9 2 (0.61%) Elastic Stack
9 2 (0.61%) React
9 2 (0.61%) YAML
10 1 (0.30%) Blazor
10 1 (0.30%) FIX Protocol
10 1 (0.30%) PySpark
Miscellaneous
1 29 (8.79%) CMDB
1 29 (8.79%) Management Information System
2 24 (7.27%) Cloud Native
3 15 (4.55%) Enterprise Software
4 13 (3.94%) Analytical Mindset
4 13 (3.94%) Product Ownership
5 9 (2.73%) Data Centre
5 9 (2.73%) Hedge funds
6 8 (2.42%) iPhone
7 7 (2.12%) Fat Client
7 7 (2.12%) Thin Client
8 6 (1.82%) Taxonomies
9 5 (1.52%) Driving Licence
9 5 (1.52%) Foreign Exchange (FX)
9 5 (1.52%) Team-Oriented Environment
10 4 (1.21%) Algorithms
10 4 (1.21%) Mobile Games
10 4 (1.21%) Onboarding
10 4 (1.21%) Video Conferencing
11 3 (0.91%) Private Cloud
Operating Systems
1 48 (14.55%) Windows
2 23 (6.97%) Windows Server
3 11 (3.33%) Windows 10
4 7 (2.12%) Apple iOS
5 6 (1.82%) Linux
6 5 (1.52%) Android
7 4 (1.21%) Mac OS
8 3 (0.91%) Red Hat Enterprise Linux
8 3 (0.91%) Unix
9 2 (0.61%) Windows Server 2016
10 1 (0.30%) Windows Server 2008
10 1 (0.30%) Windows Server 2019
Processes & Methodologies
1 177 (53.64%) ITIL
2 151 (45.76%) ITSM
3 108 (32.73%) Problem-Solving
4 79 (23.94%) Service Delivery
5 68 (20.61%) Cybersecurity
6 59 (17.88%) Change Management
7 57 (17.27%) Agile
8 53 (16.06%) Roadmaps
9 50 (15.15%) Incident Management
10 44 (13.33%) Problem Management
11 42 (12.73%) Customer Service
11 42 (12.73%) Project Management
11 42 (12.73%) Stakeholder Management
12 41 (12.42%) Continuous Improvement
13 38 (11.52%) IT Strategy
14 33 (10.00%) DevOps
15 31 (9.39%) Project Delivery
16 29 (8.79%) Risk Management
16 29 (8.79%) Stakeholder Engagement
17 26 (7.88%) Technical Leadership
Programming Languages
1 38 (11.52%) SQL
2 15 (4.55%) C#
2 15 (4.55%) JavaScript
3 11 (3.33%) Python
4 10 (3.03%) Java
5 8 (2.42%) PowerShell
6 7 (2.12%) PL/SQL
6 7 (2.12%) T-SQL
6 7 (2.12%) VB.NET
7 5 (1.52%) C
8 4 (1.21%) C++
9 2 (0.61%) Ruby
10 1 (0.30%) Bicep
10 1 (0.30%) Scala
Qualifications
1 53 (16.06%) Degree
2 28 (8.48%) PMI Certification
2 28 (8.48%) PMP
3 22 (6.67%) CISSP
4 19 (5.76%) Security Cleared
5 16 (4.85%) ITIL Certification
6 10 (3.03%) Microsoft Certification
6 10 (3.03%) SC Cleared
7 9 (2.73%) Computer Science Degree
7 9 (2.73%) ITIL Foundation Certificate
8 7 (2.12%) Azure Certification
9 5 (1.52%) DV Cleared
10 4 (1.21%) Master's Degree
10 4 (1.21%) NVQ Level 3
10 4 (1.21%) NVQ Level 4
11 3 (0.91%) A+ Certification
12 2 (0.61%) AWS Certification
12 2 (0.61%) CRISC
13 1 (0.30%) CCENT
13 1 (0.30%) Cisco Certification
Quality Assurance & Compliance
1 32 (9.70%) QA
2 23 (6.97%) SLA
3 18 (5.45%) GxP
4 17 (5.15%) GDPR
5 16 (4.85%) Cyber Essentials
6 13 (3.94%) Cyber Essentials PLUS
7 7 (2.12%) ISO/IEC 27001
8 3 (0.91%) COBIT
9 2 (0.61%) GRC
9 2 (0.61%) ITGC
9 2 (0.61%) PMO
9 2 (0.61%) Sarbanes-Oxley
10 1 (0.30%) PCI DSS
System Software
1 39 (11.82%) Active Directory
2 8 (2.42%) XenApp
3 5 (1.52%) VMware Infrastructure
4 2 (0.61%) Virtual Machines
5 1 (0.30%) Docker
5 1 (0.30%) Virtual Desktop
5 1 (0.30%) VMware ESXi
5 1 (0.30%) vSphere
5 1 (0.30%) XenDesktop
Systems Management
1 20 (6.06%) Microsoft Intune
2 8 (2.42%) SCCM
3 7 (2.12%) Terraform
4 5 (1.52%) Ansible
4 5 (1.52%) Grafana
4 5 (1.52%) Progress Chef
4 5 (1.52%) Single Sign-On
5 3 (0.91%) Computer Incident Response Team
5 3 (0.91%) Prometheus
5 3 (0.91%) Puppet
6 2 (0.61%) Jamf Pro
7 1 (0.30%) Argo
7 1 (0.30%) FortiGate
7 1 (0.30%) HP UCMDB
7 1 (0.30%) Istio
7 1 (0.30%) Kubernetes
7 1 (0.30%) Plesk
Vendors
1 102 (30.91%) Microsoft
2 84 (25.45%) ServiceNow
3 29 (8.79%) SAP
4 16 (4.85%) Citrix
5 15 (4.55%) Salesforce
6 13 (3.94%) Dell
6 13 (3.94%) Oracle
7 11 (3.33%) Adobe
7 11 (3.33%) Cisco
7 11 (3.33%) MuleSoft
8 10 (3.03%) SolarWinds
9 9 (2.73%) Remedy
10 8 (2.42%) HP
11 7 (2.12%) VMware
12 6 (1.82%) Apple
13 5 (1.52%) Google
13 5 (1.52%) Guidewire
14 4 (1.21%) Atlassian
14 4 (1.21%) Meraki
14 4 (1.21%) Snow