Virtual Machines Jobs with Work from Home Options

Virtual Machine (VM)
UK > Work from Home

The table below provides summary statistics for permanent job vacancies with an option to work from home (WFH) and a requirement for Virtual Machines skills. Included is a benchmarking guide to the salaries offered in vacancies that have cited Virtual Machines over the 6 months to 24 May 2024 with a comparison to the same period in the previous 2 years.

6 months to
24 May 2024
Same period 2023 Same period 2022
Rank 321 445 518
Rank change year-on-year +124 +73 -76
Permanent jobs citing Virtual Machines 289 220 382
As % of all permanent jobs with a WFH option 0.85% 0.55% 0.53%
As % of the System Software category 6.79% 3.69% 2.78%
Number of salaries quoted 250 148 173
10th Percentile £41,250 £34,250 £35,000
25th Percentile £53,750 £42,874 £47,500
Median annual salary (50th Percentile) £57,500 £64,029 £65,000
Median % change year-on-year -10.20% -1.49% +9.71%
75th Percentile £63,750 £85,000 £81,250
90th Percentile £87,500 £93,875 £87,500
UK median annual salary £57,500 £57,500 £50,000
% change year-on-year - +15.00% -1.96%

All System Software Skills
Work from Home

Virtual Machines is in the System Software category. The following table is for comparison with the above and provides summary statistics for all permanent job vacancies with a WFH option and a requirement for system software skills.

Permanent vacancies with a requirement for system software skills 4,258 5,961 13,740
As % of all permanent jobs with a WFH option 12.51% 14.93% 19.10%
Number of salaries quoted 3,333 4,401 7,695
10th Percentile £31,250 £31,250 £32,500
25th Percentile £41,250 £43,750 £45,250
Median annual salary (50th Percentile) £55,000 £60,000 £62,500
Median % change year-on-year -8.33% -4.00% +8.70%
75th Percentile £71,250 £80,000 £82,500
90th Percentile £86,000 £95,000 £95,000
UK median annual salary £50,000 £55,000 £55,000
% change year-on-year -9.09% - -

Virtual Machines
Trend for Jobs with a WFH Option

Job vacancies with a work from home option citing Virtual Machines as a proportion of all IT jobs advertised.
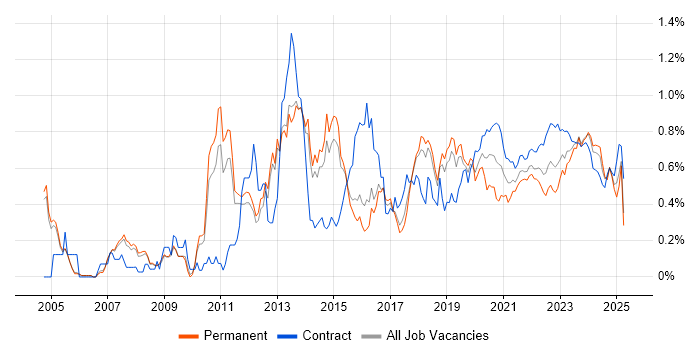
Virtual Machines trend for jobs with a WFH option

Virtual Machines
Salary Trend for Jobs with a WFH Option

3-month moving average salary quoted in job vacancies with a work from home option citing Virtual Machines.

Virtual Machines salary trend for jobs with a WFH option

Virtual Machines
Salary Histogram for Jobs with a WFH Option

Salary distribution for jobs with a work from home option citing Virtual Machines over the 6 months to 24 May 2024.

Virtual Machines salary histogram for jobs with a WFH option

Virtual Machines
Co-occurring Skills and Capabilities with WFH Options by Category

The follow tables expand on the table above by listing co-occurrences grouped by category. The same employment type, locality and period is covered with up to 20 co-occurrences shown in each of the following categories:

Application Platforms
1 31 (10.73%) Microsoft Exchange
2 15 (5.19%) SharePoint
3 9 (3.11%) IIS
4 3 (1.04%) CloudStack
5 2 (0.69%) Confluence
Applications
1 9 (3.11%) Microsoft Office
Business Applications
1 2 (0.69%) Dynamics CRM
Cloud Services
1 230 (79.58%) Azure
2 79 (27.34%) Power Platform
3 52 (17.99%) Microsoft 365
4 45 (15.57%) AWS
5 40 (13.84%) Entra ID
6 37 (12.80%) SaaS
7 31 (10.73%) Azure DevOps
8 29 (10.03%) Serverless
9 28 (9.69%) GitHub
10 25 (8.65%) Azure Storage
11 23 (7.96%) Azure Functions
11 23 (7.96%) Azure Monitor
12 22 (7.61%) Amazon S3
12 22 (7.61%) AWS Lambda
13 18 (6.23%) IaaS
14 17 (5.88%) Azure App Service
15 16 (5.54%) Amazon ECS
15 16 (5.54%) Amazon EKS
15 16 (5.54%) AWS Fargate
15 16 (5.54%) Matillion
Communications & Networking
1 74 (25.61%) Broadband
2 65 (22.49%) DNS
3 58 (20.07%) Firewall
4 48 (16.61%) VPN
5 31 (10.73%) DHCP
6 19 (6.57%) HTTP
7 17 (5.88%) WAN
8 16 (5.54%) 5G
9 15 (5.19%) LAN
10 12 (4.15%) VLAN
11 8 (2.77%) Internet
11 8 (2.77%) TCP/IP
12 6 (2.08%) IPv4
12 6 (2.08%) SAN
12 6 (2.08%) VoIP
13 5 (1.73%) Wireless
14 4 (1.38%) FTP
14 4 (1.38%) SSL
14 4 (1.38%) Wi-Fi
14 4 (1.38%) WLAN
Database & Business Intelligence
1 101 (34.95%) SQL Server
2 82 (28.37%) Azure SQL Database
3 79 (27.34%) Power BI
4 8 (2.77%) Amazon RDS
5 6 (2.08%) BigQuery
5 6 (2.08%) Data Warehouse
6 2 (0.69%) MariaDB
6 2 (0.69%) MySQL
6 2 (0.69%) SQL Server Integration Services
6 2 (0.69%) SQL Server Reporting Services
6 2 (0.69%) Tableau
7 1 (0.35%) NoSQL
7 1 (0.35%) PostgreSQL
7 1 (0.35%) Redis
7 1 (0.35%) Relational Database
7 1 (0.35%) TimescaleDB
Development Applications
1 34 (11.76%) Git
2 17 (5.88%) JIRA
3 12 (4.15%) Jenkins
4 10 (3.46%) Trac
5 5 (1.73%) eggPlant
6 2 (0.69%) Sonatype Nexus
7 1 (0.35%) GitLab
General
1 146 (50.52%) Social Skills
2 29 (10.03%) Finance
3 28 (9.69%) Analytical Skills
4 21 (7.27%) Telecoms
5 16 (5.54%) Automotive
6 11 (3.81%) Documentation Skills
7 8 (2.77%) Inclusion and Diversity
8 4 (1.38%) Back Office
8 4 (1.38%) Banking
8 4 (1.38%) Law
8 4 (1.38%) Manufacturing
8 4 (1.38%) Organisational Skills
9 3 (1.04%) Aerospace
10 2 (0.69%) Advertising
10 2 (0.69%) Pharmaceutical
10 2 (0.69%) Retail
11 1 (0.35%) French Language
11 1 (0.35%) Italian Language
11 1 (0.35%) Marketing
11 1 (0.35%) Spanish Language
Job Titles
1 74 (25.61%) DBA
1 74 (25.61%) SQL DBA
2 50 (17.30%) Infrastructure Engineer
3 39 (13.49%) Senior
4 28 (9.69%) Senior Infrastructure Engineer
5 25 (8.65%) DevOps Engineer
6 21 (7.27%) Lead
7 20 (6.92%) Architect
7 20 (6.92%) Infrastructure Architect
8 18 (6.23%) Support Specialist
9 16 (5.54%) Cloud Engineer
10 15 (5.19%) Active Directory Specialist
10 15 (5.19%) Active Directory Support
10 15 (5.19%) Azure Specialist
11 12 (4.15%) Analyst
12 11 (3.81%) AWS DevOps
13 10 (3.46%) Consultant
14 9 (3.11%) Lead DevOps
15 8 (2.77%) Project Consultant
15 8 (2.77%) Unix Consultant
Libraries, Frameworks & Software Standards
1 24 (8.30%) .NET
2 20 (6.92%) ARM Templates
3 18 (6.23%) JWT
4 16 (5.54%) RESTful
5 5 (1.73%) REST
6 3 (1.04%) Flash
7 2 (0.69%) ADO
7 2 (0.69%) JSON
7 2 (0.69%) OAuth
7 2 (0.69%) SOAP
7 2 (0.69%) XML
7 2 (0.69%) YAML
8 1 (0.35%) ActiveMQ
8 1 (0.35%) ASP.NET
8 1 (0.35%) CSS
8 1 (0.35%) Flask
8 1 (0.35%) HTML
8 1 (0.35%) jQuery
8 1 (0.35%) Swagger
8 1 (0.35%) TensorFlow
Miscellaneous
1 30 (10.38%) Self-Motivation
2 23 (7.96%) Data Centre
3 19 (6.57%) PKI
4 16 (5.54%) Mobile App
5 14 (4.84%) IoT
6 12 (4.15%) Cloud Native
7 10 (3.46%) Hybrid Cloud
8 7 (2.42%) Management Information System
8 7 (2.42%) Replication
9 5 (1.73%) Greenfield Project
10 4 (1.38%) Legacy Systems
11 3 (1.04%) IBM Storwize
11 3 (1.04%) Linux Command Line
12 2 (0.69%) FlexPod
12 2 (0.69%) Product Ownership
12 2 (0.69%) Public Cloud
12 2 (0.69%) Security Posture
13 1 (0.35%) Distributed Systems
13 1 (0.35%) Onboarding
13 1 (0.35%) Operational Technology
Operating Systems
1 130 (44.98%) Windows
2 79 (27.34%) VMS
3 73 (25.26%) Windows Server
4 64 (22.15%) Linux
5 30 (10.38%) Windows Server 2016
6 28 (9.69%) Windows Server 2019
7 22 (7.61%) Unix
8 8 (2.77%) AIX
8 8 (2.77%) Red Hat Enterprise Linux
8 8 (2.77%) Solaris
9 7 (2.42%) Windows 10
10 5 (1.73%) Windows Server 2012
11 3 (1.04%) Android
11 3 (1.04%) Debian
11 3 (1.04%) SUSE
11 3 (1.04%) SUSE Linux Enterprise Server
12 2 (0.69%) Ubuntu
13 1 (0.35%) CentOS
13 1 (0.35%) Mac OS X
13 1 (0.35%) Windows Server 2008
Processes & Methodologies
1 118 (40.83%) Disaster Recovery
2 94 (32.53%) DevOps
3 84 (29.07%) High Availability
4 83 (28.72%) Collaborative Working
5 80 (27.68%) Business Intelligence
6 74 (25.61%) Performance Tuning
7 56 (19.38%) Infrastructure Engineering
8 47 (16.26%) CI/CD
9 44 (15.22%) Agile
10 39 (13.49%) ITIL
11 38 (13.15%) Problem-Solving
12 33 (11.42%) Microservices
13 30 (10.38%) Containerisation
13 30 (10.38%) Network Virtualisation
14 26 (9.00%) Infrastructure as Code
15 25 (8.65%) Configuration Management
16 24 (8.30%) Actionable Insight
17 21 (7.27%) Continuous Improvement
18 20 (6.92%) Project Management
19 19 (6.57%) Release Management
Programming Languages
1 96 (33.22%) T-SQL
2 91 (31.49%) SQL
3 55 (19.03%) PowerShell
4 36 (12.46%) Python
5 30 (10.38%) C#
6 21 (7.27%) Bicep
7 20 (6.92%) Java
8 19 (6.57%) Bash
9 17 (5.88%) Perl
10 16 (5.54%) VB
11 15 (5.19%) VBScript
12 6 (2.08%) VB.NET
13 5 (1.73%) Go
14 3 (1.04%) JavaScript
14 3 (1.04%) Ruby
15 2 (0.69%) Kusto Query Language
15 2 (0.69%) Lua
15 2 (0.69%) Rust
16 1 (0.35%) C
16 1 (0.35%) C++
Qualifications
1 78 (26.99%) Microsoft Certification
2 33 (11.42%) Degree
2 33 (11.42%) Security Cleared
3 24 (8.30%) SC Cleared
4 15 (5.19%) DV Cleared
4 15 (5.19%) ITIL Foundation Certificate
5 7 (2.42%) DBS Check
6 5 (1.73%) Azure Certification
6 5 (1.73%) ISEB
6 5 (1.73%) ISTQB
7 3 (1.04%) VMware Certified Professional (VCP)
8 1 (0.35%) BPSS Clearance
8 1 (0.35%) CCNA
8 1 (0.35%) Cisco Certification
8 1 (0.35%) CISM
8 1 (0.35%) CISSP
8 1 (0.35%) CompTIA Security+
8 1 (0.35%) ISACA
8 1 (0.35%) Network+ Certification
8 1 (0.35%) PhD
Quality Assurance & Compliance
1 14 (4.84%) Data Quality
2 13 (4.50%) ISO/IEC 27001
3 5 (1.73%) QA
4 2 (0.69%) Cyber Essentials
4 2 (0.69%) PMO
5 1 (0.35%) GDPR
5 1 (0.35%) HIPAA
5 1 (0.35%) SOC 2
System Software
1 71 (24.57%) Active Directory
2 59 (20.42%) VMware Infrastructure
3 46 (15.92%) Hyper-V
4 33 (11.42%) Docker
5 23 (7.96%) Virtual Desktop
6 17 (5.88%) vSphere
7 16 (5.54%) pfSense
8 12 (4.15%) Firmware
9 10 (3.46%) NFS
10 9 (3.11%) VMware ESXi
11 4 (1.38%) KVM
12 3 (1.04%) Ceph
12 3 (1.04%) Gluster
12 3 (1.04%) oVirt
13 1 (0.35%) DFS Replication
13 1 (0.35%) VMware NSX
Systems Management
1 42 (14.53%) Kubernetes
2 34 (11.76%) Terraform
3 29 (10.03%) Ansible
4 24 (8.30%) Microsoft Intune
5 22 (7.61%) ZABBIX
6 16 (5.54%) Grafana
7 15 (5.19%) Active Directory Federation Services
7 15 (5.19%) SCCM
7 15 (5.19%) SCOM
7 15 (5.19%) WSUS
8 10 (3.46%) Microsoft Data Protection Manager
8 10 (3.46%) SCDPM
9 4 (1.38%) Single Sign-On
10 3 (1.04%) Graylog
10 3 (1.04%) Observium
10 3 (1.04%) Prometheus
10 3 (1.04%) Puppet
10 3 (1.04%) vCenter Server
11 2 (0.69%) vRealize
11 2 (0.69%) vRealize Orchestrator
Vendors
1 167 (57.79%) Microsoft
2 82 (28.37%) VMware
3 19 (6.57%) Fortinet
4 17 (5.88%) Juniper
5 16 (5.54%) ForgeRock
5 16 (5.54%) Sitecore
5 16 (5.54%) Veeam
6 11 (3.81%) Cisco
6 11 (3.81%) Oracle
6 11 (3.81%) Red Hat
7 10 (3.46%) McAfee
8 8 (2.77%) Google
9 7 (2.42%) HP
9 7 (2.42%) ServiceNow
10 4 (1.38%) Citrix
11 3 (1.04%) Apple
11 3 (1.04%) IBM
11 3 (1.04%) Meraki
12 2 (0.69%) 3PAR
12 2 (0.69%) Nimble Storage