Algorithms Jobs in England

Algorithms
UK > England

The table below looks at the prevalence of the term Algorithms in permanent job vacancies advertised in England. Included is a benchmarking guide to the salaries offered in vacancies that have cited Algorithms over the 6 months to 29 May 2024 with a comparison to the same period over the previous 2 years.

6 months to
29 May 2024
Same period 2023 Same period 2022
Rank 176 198 129
Rank change year-on-year +22 -69 +86
Permanent jobs citing Algorithms 1,437 1,615 4,261
As % of all permanent jobs advertised in England 1.61% 1.87% 3.05%
As % of the Miscellaneous category 4.76% 4.31% 6.46%
Number of salaries quoted 689 744 1,082
10th Percentile £38,950 £41,250 £42,500
25th Percentile £50,000 £55,000 £55,000
Median annual salary (50th Percentile) £65,000 £75,000 £74,668
Median % change year-on-year -13.33% +0.45% +12.71%
75th Percentile £83,750 £96,250 £90,000
90th Percentile £105,000 £122,500 £109,875
UK median annual salary £65,000 £75,000 £72,500
% change year-on-year -13.33% +3.45% +11.54%

All Generic Skills
England

Algorithms is in the General and Transferable Skills category. The following table is for comparison with the above and provides summary statistics for all permanent job vacancies advertised in England with a requirement for generic IT skills.

Permanent vacancies with a requirement for generic IT skills 30,165 37,452 65,962
As % of all permanent jobs advertised in England 33.72% 43.35% 47.24%
Number of salaries quoted 20,917 20,469 30,470
10th Percentile £28,000 £35,764 £34,750
25th Percentile £38,000 £46,749 £46,250
Median annual salary (50th Percentile) £55,000 £65,000 £62,500
Median % change year-on-year -15.38% +4.00% +4.17%
75th Percentile £75,000 £87,500 £85,000
90th Percentile £100,000 £110,000 £105,000
UK median annual salary £55,000 £65,000 £62,500
% change year-on-year -15.38% +4.00% +4.17%

Algorithms
Job Vacancy Trend in England

Job postings citing Algorithms as a proportion of all IT jobs advertised in England.
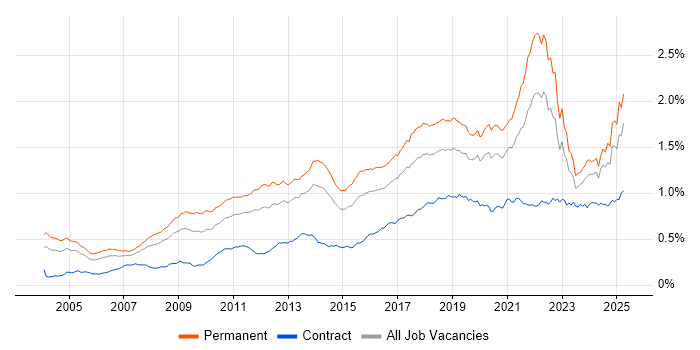
Job vacancy trend for Algorithms in England

Algorithms
Salary Trend in England

3-month moving average salary quoted in jobs citing Algorithms in England.

Salary trend for Algorithms in England

Algorithms
Salary Histogram in England

Salary distribution for jobs citing Algorithms in England over the 6 months to 29 May 2024.

Salary histogram for Algorithms in England

Algorithms
Job Locations in England

The table below looks at the demand and provides a guide to the median salaries quoted in IT jobs citing Algorithms within the England region over the 6 months to 29 May 2024. The 'Rank Change' column provides an indication of the change in demand within each location based on the same 6 month period last year.

Location Rank Change
on Same Period
Last Year
Matching
Permanent
IT Job Ads
Median Salary
Past 6 Months
Median Salary
% Change
on Same Period
Last Year
Live
Jobs
South East +80 492 £58,000 -3.33% 110
London -50 341 £85,000 - 211
Midlands -3 161 £62,500 +21.95% 43
North of England -71 153 £55,000 -12.35% 37
East of England +8 141 £65,000 - 36
South West +11 139 £60,000 -7.69% 24
North West -38 131 £60,000 -7.69% 22
West Midlands -20 88 £57,500 -4.17% 37
East Midlands +11 73 £75,250 +58.42% 6
Yorkshire +6 20 £50,000 -11.11% 11
North East -4 2 £91,200 +40.31% 4
Algorithms
UK

Algorithms
Co-occurring Skills and Capabilities in England by Category

The follow tables expand on the table above by listing co-occurrences grouped by category. The same employment type, locality and period is covered with up to 20 co-occurrences shown in each of the following categories:

Application Platforms
1 34 (2.37%) Apache Spark
2 17 (1.18%) Apache
3 9 (0.63%) SAS
4 7 (0.49%) Apache Airflow
4 7 (0.49%) Confluence
5 4 (0.28%) ColdFusion
5 4 (0.28%) IIS
6 3 (0.21%) Jupyter
7 2 (0.14%) CMS
8 1 (0.070%) ArcGIS
8 1 (0.070%) Ethereum
8 1 (0.070%) Hyperledger
8 1 (0.070%) Luigi
8 1 (0.070%) SharePoint
8 1 (0.070%) WordPress
Applications
1 88 (6.12%) Simulink
2 42 (2.92%) Stateflow
3 24 (1.67%) Microsoft Office
4 17 (1.18%) Microsoft Excel
5 10 (0.70%) GNU Octave
6 9 (0.63%) Spreadsheet
7 7 (0.49%) CANalyzer
8 4 (0.28%) Adobe Illustrator
8 4 (0.28%) Photoshop
9 2 (0.14%) Microsoft PowerPoint
10 1 (0.070%) Blender
10 1 (0.070%) CapCut
10 1 (0.070%) InVision
10 1 (0.070%) Sketch
10 1 (0.070%) Zeplin
Business Applications
1 6 (0.42%) Distributed Ledger
2 3 (0.21%) ProductWriter
3 1 (0.070%) Data Workbench
3 1 (0.070%) Endur
3 1 (0.070%) SAP Business One
3 1 (0.070%) SAP S/4HANA
3 1 (0.070%) Yoast SEO
Cloud Services
1 362 (25.19%) Azure
2 238 (16.56%) IBM Cloud
3 152 (10.58%) AWS
3 152 (10.58%) Serverless
4 132 (9.19%) Azure DevOps
4 132 (9.19%) Azure Functions
5 125 (8.70%) Azure API Management
5 125 (8.70%) Azure Logic Apps
5 125 (8.70%) Azure Service Bus
6 61 (4.24%) GCP
7 37 (2.57%) Power Platform
8 33 (2.30%) SaaS
9 22 (1.53%) AWS Lambda
10 15 (1.04%) Azure Synapse Analytics
11 12 (0.84%) Google Analytics
12 11 (0.77%) Azure Data Factory
12 11 (0.77%) Snowflake
13 10 (0.70%) Azure Machine Learning
13 10 (0.70%) IaaS
13 10 (0.70%) PaaS
Communications & Networking
1 22 (1.53%) Wireless
2 18 (1.25%) J1939
3 12 (0.84%) Ethernet
4 11 (0.77%) OFDM
5 9 (0.63%) Internet
6 8 (0.56%) Firewall
7 7 (0.49%) HTTP
7 7 (0.49%) TCP/IP
8 5 (0.35%) BGP
8 5 (0.35%) Bluetooth
8 5 (0.35%) Intrusion Detection
8 5 (0.35%) IPsec
8 5 (0.35%) LAN
8 5 (0.35%) Network Security
8 5 (0.35%) NGFW
8 5 (0.35%) OSPF
8 5 (0.35%) SSL
8 5 (0.35%) VLAN
8 5 (0.35%) VPN
8 5 (0.35%) WAN
Database & Business Intelligence
1 265 (18.44%) PostgreSQL
2 263 (18.30%) NoSQL
3 244 (16.98%) MongoDB
4 238 (16.56%) DB2
5 171 (11.90%) Relational Database
6 69 (4.80%) Tableau
7 47 (3.27%) Big Data
8 45 (3.13%) SQL Server
9 39 (2.71%) Data Lake
10 37 (2.57%) MySQL
10 37 (2.57%) Power BI
11 34 (2.37%) Redis
12 33 (2.30%) Data Warehouse
13 25 (1.74%) Elasticsearch
14 20 (1.39%) Hadoop
15 19 (1.32%) Data Mining
16 14 (0.97%) Metadata
17 12 (0.84%) SQL Server Integration Services
18 11 (0.77%) SQL Server Analysis Services
19 10 (0.70%) BigQuery
Development Applications
1 117 (8.14%) Git
2 41 (2.85%) JIRA
3 19 (1.32%) ClearCase
4 18 (1.25%) Plastic SCM
5 16 (1.11%) CMake
5 16 (1.11%) Subversion
6 14 (0.97%) ClearQuest
7 12 (0.84%) Jenkins
8 7 (0.49%) JUnit
8 7 (0.49%) Maven
9 6 (0.42%) Oracle Forms
10 5 (0.35%) GitLab
10 5 (0.35%) LabVIEW
10 5 (0.35%) MLflow
11 4 (0.28%) Eclipse
11 4 (0.28%) GCC
12 3 (0.21%) Cypress.io
12 3 (0.21%) Gradle
12 3 (0.21%) Team Foundation Server
12 3 (0.21%) Visual Studio
General
1 340 (23.66%) Social Skills
2 256 (17.81%) Inclusion and Diversity
3 244 (16.98%) Public Sector
4 193 (13.43%) Analytical Skills
5 148 (10.30%) Finance
6 85 (5.92%) Electronics
7 74 (5.15%) Legal
8 65 (4.52%) Marketing
9 52 (3.62%) Automotive
10 49 (3.41%) Retail
11 46 (3.20%) Pharmaceutical
12 43 (2.99%) Military
13 41 (2.85%) Manufacturing
14 39 (2.71%) Games
15 33 (2.30%) Banking
16 27 (1.88%) Law
17 24 (1.67%) Organisational Skills
18 19 (1.32%) Aerospace
18 19 (1.32%) Investment Banking
19 13 (0.90%) Telecoms
Job Titles
1 320 (22.27%) Developer
2 287 (19.97%) Senior
3 277 (19.28%) Data Scientist
4 201 (13.99%) Software Engineer
5 136 (9.46%) Azure Developer
6 133 (9.26%) Full Stack Developer
7 126 (8.77%) Full Stack Engineer
8 122 (8.49%) Azure Engineer
9 107 (7.45%) Lead
10 95 (6.61%) Senior Data Scientist
11 60 (4.18%) Senior Software Engineer
12 58 (4.04%) Software Developer
13 53 (3.69%) Senior Developer
13 53 (3.69%) Systems Engineer
14 52 (3.62%) Embedded Engineer
15 42 (2.92%) Data Engineer
16 39 (2.71%) Embedded Software Engineer
17 38 (2.64%) Graduate
18 36 (2.51%) C++ Developer
19 34 (2.37%) Team Leader
Libraries, Frameworks & Software Standards
1 303 (21.09%) .NET
2 267 (18.58%) Web Services
3 264 (18.37%) React
4 263 (18.30%) AngularJS
5 261 (18.16%) HTML
6 259 (18.02%) CSS
7 249 (17.33%) Vue
8 248 (17.26%) REST
9 243 (16.91%) jQuery
10 242 (16.84%) ASP.NET
11 239 (16.63%) ASP.NET Core
12 238 (16.56%) Backbone.js
12 238 (16.56%) Ember.js
12 238 (16.56%) Twitter Bootstrap
13 153 (10.65%) Node.js
14 119 (8.28%) TensorFlow
15 64 (4.45%) PyTorch
16 60 (4.18%) Pandas
17 59 (4.11%) Kafka
18 58 (4.04%) scikit-learn
Miscellaneous
1 462 (32.15%) Data Structures
2 265 (18.44%) Blockchain
3 244 (16.98%) Hybrid Cloud
4 113 (7.86%) e-Learning
5 48 (3.34%) Embedded Systems
6 47 (3.27%) Client/Server
7 35 (2.44%) CUDA
7 35 (2.44%) Self-Motivation
8 33 (2.30%) FPGA
9 31 (2.16%) Analytical Mindset
9 31 (2.16%) VHDL
10 29 (2.02%) Distributed Systems
11 27 (1.88%) Product Ownership
12 24 (1.67%) Management Information System
13 21 (1.46%) Greenfield Project
14 20 (1.39%) Cloud Native
15 19 (1.32%) Life Science
16 17 (1.18%) Virtual Team
17 15 (1.04%) IoT
18 14 (0.97%) Analogue Electronics
Operating Systems
1 368 (25.61%) Linux
2 287 (19.97%) Windows
3 256 (17.81%) Android
4 250 (17.40%) Apple iOS
5 45 (3.13%) Unix
6 10 (0.70%) Embedded Linux
7 7 (0.49%) FreeRTOS
8 6 (0.42%) Mac OS
9 2 (0.14%) Windows Server 2019
10 1 (0.070%) Windows 10
10 1 (0.070%) Windows Server
10 1 (0.070%) Windows Server 2008
10 1 (0.070%) Windows Server 2012
10 1 (0.070%) Windows Server 2016
Processes & Methodologies
1 498 (34.66%) Artificial Intelligence
2 495 (34.45%) Computer Science
3 468 (32.57%) Mathematics
4 442 (30.76%) Problem-Solving
5 403 (28.04%) Data Science
6 375 (26.10%) Agile
7 374 (26.03%) Software Engineering
8 355 (24.70%) Machine Learning
9 317 (22.06%) Design Patterns
10 316 (21.99%) Mentoring
11 315 (21.92%) OOP
12 297 (20.67%) OO
13 292 (20.32%) User Experience
14 288 (20.04%) Coaching
15 280 (19.49%) Decision-Making
16 274 (19.07%) Full Stack Development
17 260 (18.09%) Data Analysis
18 257 (17.88%) SOLID
19 248 (17.26%) Web Development
20 245 (17.05%) Design Thinking
Programming Languages
1 664 (46.21%) Python
2 447 (31.11%) SQL
3 386 (26.86%) C#
4 298 (20.74%) JavaScript
5 283 (19.69%) Java
6 219 (15.24%) C
7 209 (14.54%) C++
8 140 (9.74%) MATLAB
9 78 (5.43%) Fortran
10 72 (5.01%) R
11 43 (2.99%) TypeScript
12 37 (2.57%) Embedded C
13 31 (2.16%) Go
14 25 (1.74%) Bash
15 24 (1.67%) Perl
16 21 (1.46%) Scala
17 18 (1.25%) Ruby
18 16 (1.11%) Haskell
19 15 (1.04%) PHP
20 9 (0.63%) T-SQL
Qualifications
1 715 (49.76%) Degree
2 257 (17.88%) Master's Degree
3 196 (13.64%) Security Cleared
4 188 (13.08%) PhD
5 105 (7.31%) Computer Science Degree
6 55 (3.83%) SC Cleared
7 52 (3.62%) DBS Check
8 47 (3.27%) BPSS Clearance
9 35 (2.44%) DV Cleared
10 14 (0.97%) Numerate Degree
11 13 (0.90%) PMI Certification
12 11 (0.77%) HND
12 11 (0.77%) MBA
13 5 (0.35%) CCIE
13 5 (0.35%) Chartered Engineer
13 5 (0.35%) Cisco Certification
13 5 (0.35%) JNCIE
14 4 (0.28%) CESG Certified Professional
14 4 (0.28%) Postgraduate
15 2 (0.14%) Microsoft Certification
Quality Assurance & Compliance
1 31 (2.16%) QA
2 30 (2.09%) Data Quality
3 19 (1.32%) MISRA
4 18 (1.25%) Automotive SPICE
4 18 (1.25%) ISO 26262
5 17 (1.18%) GDPR
6 13 (0.90%) Accessibility
7 12 (0.84%) AUTOSAR
8 7 (0.49%) HIPAA
8 7 (0.49%) ISO/IEC 12207
8 7 (0.49%) ISO/IEC 15288
9 5 (0.35%) IEC 61508
10 4 (0.28%) Actionable Recommendations
11 1 (0.070%) MISRA C
System Software
1 37 (2.57%) Firmware
2 33 (2.30%) Docker
3 8 (0.56%) Active Directory
4 7 (0.49%) Embedded Firmware
5 4 (0.28%) Virtual Desktop
6 2 (0.14%) Hyper-V
6 2 (0.14%) VMware ESXi
7 1 (0.070%) Microsoft Virtual Server
7 1 (0.070%) Virtual Servers
7 1 (0.070%) VMware Infrastructure
Systems Management
1 58 (4.04%) Kubernetes
2 15 (1.04%) Functional Safety
3 13 (0.90%) Terraform
4 7 (0.49%) Ansible
5 3 (0.21%) Istio
5 3 (0.21%) Kubeflow
6 2 (0.14%) SCCM
7 1 (0.070%) FTK
7 1 (0.070%) SCOM
Vendors
1 261 (18.16%) IBM
2 238 (16.56%) Red Hat
3 97 (6.75%) Microsoft
4 80 (5.57%) Databricks
5 33 (2.30%) Google
6 18 (1.25%) Lauterbach
6 18 (1.25%) OpenAI
7 13 (0.90%) NVIDIA
8 12 (0.84%) Facebook
9 10 (0.70%) Oracle
9 10 (0.70%) SAP
10 9 (0.63%) Instagram
11 8 (0.56%) Alteryx
11 8 (0.56%) Teradata
12 7 (0.49%) Ahrefs
12 7 (0.49%) Screaming Frog
12 7 (0.49%) Xilinx
13 6 (0.42%) Pega
13 6 (0.42%) Thales
13 6 (0.42%) UiPath