Business Continuity Jobs

Business Continuity
UK

The table below provides summary statistics for permanent job vacancies requiring Business Continuity skills. It includes a benchmarking guide to the annual salaries offered in vacancies that cited Business Continuity over the 6 months leading up to 8 December 2024, comparing them to the same period in the previous two years.

6 months to
8 Dec 2024
Same period 2023 Same period 2022
Rank 322 284 410
Rank change year-on-year -38 +126 +20
Permanent jobs citing Business Continuity 593 605 956
As % of all permanent jobs advertised in the UK 0.85% 1.14% 0.78%
As % of the Processes & Methodologies category 0.96% 1.21% 0.81%
Number of salaries quoted 306 335 670
10th Percentile £41,250 £36,250 £32,500
25th Percentile £48,750 £42,500 £45,000
Median annual salary (50th Percentile) £60,000 £55,000 £57,500
Median % change year-on-year +9.09% -4.35% +9.52%
75th Percentile £75,000 £73,750 £77,500
90th Percentile £91,250 £85,000 £95,000
UK excluding London median annual salary £55,000 £48,546 £52,500
% change year-on-year +13.29% -7.53% +10.53%

All Process and Methodology Skills
UK

Business Continuity falls under the Processes and Methodologies category. For comparison with the information above, the following table provides summary statistics for all permanent job vacancies requiring process or methodology skills.

Permanent vacancies with a requirement for process or methodology skills 61,487 49,863 117,613
As % of all permanent jobs advertised in the UK 88.65% 94.11% 95.75%
Number of salaries quoted 28,400 36,022 72,003
10th Percentile £35,000 £32,500 £34,700
25th Percentile £45,000 £43,750 £45,000
Median annual salary (50th Percentile) £60,000 £60,000 £61,000
Median % change year-on-year - -1.64% +1.67%
75th Percentile £78,750 £80,000 £82,500
90th Percentile £97,500 £99,680 £100,000
UK excluding London median annual salary £54,714 £52,500 £53,500
% change year-on-year +4.22% -1.87% +7.00%

Business Continuity
Job Vacancy Trend

Job postings citing Business Continuity as a proportion of all IT jobs advertised.
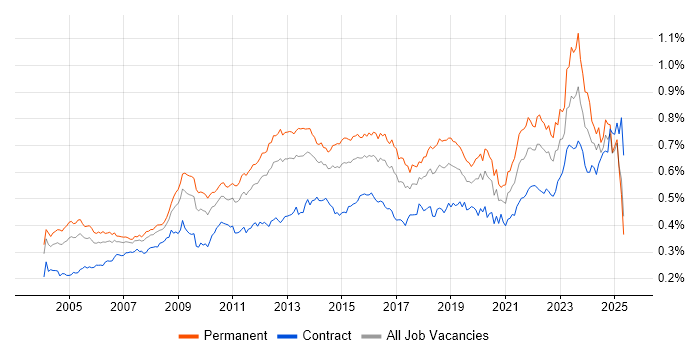
Job vacancy trend for Business Continuity in the UK

Business Continuity
Salary Trend

3-month moving average salary quoted in jobs citing Business Continuity.

Salary trend for Business Continuity in the UK

Business Continuity
Salary Histogram

Salary distribution for jobs citing Business Continuity over the 6 months to 8 December 2024.

Salary histogram for Business Continuity in the UK

Business Continuity
Top 17 Job Locations

The table below looks at the demand and provides a guide to the median salaries quoted in IT jobs citing Business Continuity within the UK over the 6 months to 8 December 2024. The 'Rank Change' column provides an indication of the change in demand within each location based on the same 6 month period last year.

Location Rank Change
on Same Period
Last Year
Matching
Permanent
IT Job Ads
Median Salary
Past 6 Months
Median Salary
% Change
on Same Period
Last Year
Live
Jobs
England -4 560 £60,000 +4.35% 186
UK excluding London -13 390 £55,000 +13.29% 118
London -46 188 £70,000 - 77
Work from Home -75 187 £62,500 +9.65% 83
North of England +24 129 £55,000 +15.79% 36
South East +5 91 £58,000 +20.83% 29
North West -3 80 £55,000 +8.59% 33
South West +28 71 £49,000 -18.33% 18
Midlands -54 59 £58,750 +11.90% 21
Yorkshire +31 39 £54,000 +30.96% 3
West Midlands -37 38 £55,000 - 7
East Midlands -38 21 £68,000 +32.68% 14
East of England -52 17 £60,000 -45.45% 9
Scotland -39 12 £68,750 +44.56% 5
North East -25 10 £60,000 +6.67%
Wales -8 7 £64,000 +42.22%
Isle of Man - 4 £43,000 -

Business Continuity
Co-occurring Skills and Capabilities by Category

The follow tables expand on the table above by listing co-occurrences grouped by category. The same employment type, locality and period is covered with up to 20 co-occurrences shown in each of the following categories:

Application Platforms
1 48 (8.09%) Microsoft Exchange
2 37 (6.24%) SharePoint
3 9 (1.52%) IIS
3 9 (1.52%) nginx
4 5 (0.84%) Apache
5 4 (0.67%) SAS
6 2 (0.34%) Oracle Workflow
7 1 (0.17%) Blackberry Enterprise Server
7 1 (0.17%) CMS
7 1 (0.17%) Oracle Application Server
7 1 (0.17%) WebLogic
7 1 (0.17%) WordPress
Applications
1 28 (4.72%) Microsoft Office
2 4 (0.67%) Microsoft Excel
3 3 (0.51%) Microsoft PowerPoint
4 2 (0.34%) 3ds Max
4 2 (0.34%) AutoCAD
4 2 (0.34%) MS Visio
Business Applications
1 9 (1.52%) Dynamics CRM
2 5 (0.84%) Sage 200
3 4 (0.67%) Maximo
4 1 (0.17%) Carpe Diem
4 1 (0.17%) Elite 3E
4 1 (0.17%) Oracle Financial Analyzer
4 1 (0.17%) Remedy ITSM
4 1 (0.17%) SAP S/4HANA
Cloud Services
1 198 (33.39%) Azure
2 144 (24.28%) Microsoft 365
3 68 (11.47%) AWS
4 37 (6.24%) IaaS
4 37 (6.24%) PaaS
5 29 (4.89%) Entra ID
6 26 (4.38%) SaaS
7 23 (3.88%) Cloud Computing
8 21 (3.54%) Power Platform
9 19 (3.20%) AWS CloudTrail
9 19 (3.20%) OCI
10 15 (2.53%) Amazon EC2
10 15 (2.53%) Amazon ELB
10 15 (2.53%) Amazon GuardDuty
10 15 (2.53%) Amazon S3
10 15 (2.53%) Virtual Private Cloud
11 11 (1.85%) GCP
11 11 (1.85%) Nutanix
12 10 (1.69%) PowerApps
13 9 (1.52%) Azure DevOps
Communications & Networking
1 136 (22.93%) Firewall
2 73 (12.31%) LAN
3 69 (11.64%) VPN
4 64 (10.79%) DNS
5 58 (9.78%) WAN
6 56 (9.44%) Network Security
7 47 (7.93%) DHCP
8 39 (6.58%) TCP/IP
9 31 (5.23%) VLAN
10 29 (4.89%) Intrusion Detection
11 28 (4.72%) Wi-Fi
12 26 (4.38%) 4G
13 24 (4.05%) Wireless
14 23 (3.88%) Internet
15 21 (3.54%) BGP
15 21 (3.54%) SAN
16 15 (2.53%) SD-WAN
17 14 (2.36%) OSPF
18 13 (2.19%) MPLS
19 11 (1.85%) NAS
Database & Business Intelligence
1 25 (4.22%) SQL Server
2 22 (3.71%) Amazon RDS
3 14 (2.36%) Data Warehouse
4 10 (1.69%) Power BI
5 8 (1.35%) MySQL
6 7 (1.18%) Data Lake
7 6 (1.01%) Oracle Database
8 4 (0.67%) MariaDB
9 2 (0.34%) DB2
9 2 (0.34%) Electronic Patient Records
9 2 (0.34%) GIS
10 1 (0.17%) Data Hub
10 1 (0.17%) Metadata
10 1 (0.17%) Relational Database
Development Applications
1 7 (1.18%) JIRA
2 3 (0.51%) Rational DOORS
2 3 (0.51%) Rational Rhapsody
2 3 (0.51%) Rational Statemate
3 2 (0.34%) Jenkins
4 1 (0.17%) CircleCI
4 1 (0.17%) GitLab
4 1 (0.17%) Jasmine
General
1 208 (35.08%) Social Skills
2 109 (18.38%) Analytical Skills
3 92 (15.51%) Finance
4 55 (9.27%) Legal
5 43 (7.25%) Telecoms
6 34 (5.73%) Law
7 32 (5.40%) Manufacturing
8 23 (3.88%) Presentation Skills
8 23 (3.88%) Public Sector
8 23 (3.88%) Retail
9 18 (3.04%) Banking
9 18 (3.04%) Organisational Skills
10 14 (2.36%) Influencing Skills
11 13 (2.19%) Military
12 10 (1.69%) Local Government
13 7 (1.18%) Automotive
14 5 (0.84%) Aerospace
14 5 (0.84%) Marketing
15 3 (0.51%) Avionics
15 3 (0.51%) Investment Banking
Job Titles
1 80 (13.49%) IT Manager
2 64 (10.79%) Senior
3 53 (8.94%) Infrastructure Engineer
4 40 (6.75%) Lead
5 37 (6.24%) Analyst
6 31 (5.23%) Administrator
7 29 (4.89%) Cloud Engineer
7 29 (4.89%) Service Manager
8 27 (4.55%) Architect
9 25 (4.22%) IT Engineer
10 23 (3.88%) Network Engineer
10 23 (3.88%) Systems Administrator
11 20 (3.37%) Consultant
11 20 (3.37%) Security Engineer
11 20 (3.37%) Security Manager
12 19 (3.20%) Head of IT
13 18 (3.04%) Security Consultant
14 17 (2.87%) Operations Manager
14 17 (2.87%) Senior Infrastructure Engineer
14 17 (2.87%) Senior Manager
Libraries, Frameworks & Software Standards
1 4 (0.67%) ADO
1 4 (0.67%) Node-RED
2 3 (0.51%) Alpine.js
2 3 (0.51%) Boost C++ Libraries
2 3 (0.51%) CSS
2 3 (0.51%) Laravel
2 3 (0.51%) Tailwind CSS
2 3 (0.51%) Web Services
2 3 (0.51%) YAML
3 2 (0.34%) FIX Protocol
3 2 (0.34%) LDAP
3 2 (0.34%) OAuth
3 2 (0.34%) OpenID
3 2 (0.34%) SailPoint
3 2 (0.34%) SAML
4 1 (0.17%) 802.1X
4 1 (0.17%) ARM Templates
4 1 (0.17%) ModSecurity
4 1 (0.17%) REST
4 1 (0.17%) SOAP
Miscellaneous
1 80 (13.49%) Management Information System
2 65 (10.96%) Data Centre
3 47 (7.93%) Cyber Threat
4 36 (6.07%) Self-Motivation
5 26 (4.38%) Data Protection Act
6 19 (3.20%) Security Operations Centre
7 15 (2.53%) Security Posture
8 13 (2.19%) Housing Association
8 13 (2.19%) Onboarding
9 12 (2.02%) Driving Licence
10 11 (1.85%) CCTV
11 10 (1.69%) Client/Server
12 9 (1.52%) CMDB
12 9 (1.52%) Cyberattack
13 8 (1.35%) Cyber Security Posture
13 8 (1.35%) Social Media
14 7 (1.18%) Lidar
15 6 (1.01%) Cloud Native
15 6 (1.01%) Hybrid Cloud
15 6 (1.01%) Public Cloud
Operating Systems
1 138 (23.27%) Windows
2 74 (12.48%) Linux
3 67 (11.30%) Windows Server
4 26 (4.38%) Unix
5 16 (2.70%) Windows Server 2019
6 13 (2.19%) Windows 10
7 12 (2.02%) Android
8 9 (1.52%) Apple iOS
8 9 (1.52%) Red Hat Enterprise Linux
8 9 (1.52%) VMS
9 8 (1.35%) Windows Vista
10 7 (1.18%) CentOS
10 7 (1.18%) Ubuntu
10 7 (1.18%) Windows Server 2008
11 4 (0.67%) Mac OS
12 3 (0.51%) AIX
12 3 (0.51%) Windows Server 2016
13 2 (0.34%) Windows Server 2012
14 1 (0.17%) Solaris
14 1 (0.17%) Windows Server 2003
Processes & Methodologies
1 318 (53.63%) Disaster Recovery
2 149 (25.13%) ITIL
3 145 (24.45%) Information Security
4 142 (23.95%) Problem-Solving
5 122 (20.57%) Project Management
6 120 (20.24%) Cybersecurity
7 106 (17.88%) Risk Management
8 86 (14.50%) Continuous Improvement
9 85 (14.33%) Business Strategy
10 82 (13.83%) Incident Response
11 78 (13.15%) Roadmaps
11 78 (13.15%) Service Delivery
11 78 (13.15%) Service Management
12 71 (11.97%) Incident Management
13 65 (10.96%) Business Continuity Planning
14 63 (10.62%) High Availability
15 62 (10.46%) Infrastructure Engineering
16 59 (9.95%) Data Protection
17 53 (8.94%) BCP
18 51 (8.60%) Change Management
Programming Languages
1 58 (9.78%) PowerShell
2 39 (6.58%) SQL
3 29 (4.89%) Python
4 17 (2.87%) Bash
5 3 (0.51%) C++
5 3 (0.51%) PHP
5 3 (0.51%) T-SQL
5 3 (0.51%) VBA
6 2 (0.34%) Java
6 2 (0.34%) PL/SQL
7 1 (0.17%) ActionScript
7 1 (0.17%) Go
7 1 (0.17%) Perl
7 1 (0.17%) Shell Script
Qualifications
1 120 (20.24%) Degree
2 44 (7.42%) Cisco Certification
3 38 (6.41%) CISSP
4 37 (6.24%) CISM
5 30 (5.06%) Security Cleared
6 28 (4.72%) Computer Science Degree
7 24 (4.05%) PMI Certification
7 24 (4.05%) PMP
8 22 (3.71%) Azure Certification
8 22 (3.71%) CCNA
8 22 (3.71%) CISA
9 21 (3.54%) Microsoft Certification
10 19 (3.20%) Master's Degree
11 14 (2.36%) CCNP
12 12 (2.02%) CRISC
13 11 (1.85%) DBS Check
13 11 (1.85%) MCP
13 11 (1.85%) SC Cleared
14 10 (1.69%) AWS Certification
14 10 (1.69%) DV Cleared
Quality Assurance & Compliance
1 128 (21.59%) ISO/IEC 27001
2 75 (12.65%) Cyber Essentials
3 66 (11.13%) GDPR
4 45 (7.59%) ISO 22301
5 43 (7.25%) SLA
6 41 (6.91%) PCI DSS
7 34 (5.73%) Cyber Essentials PLUS
8 33 (5.56%) NIST
9 23 (3.88%) GRC
10 15 (2.53%) QA
11 11 (1.85%) ISO/IEC 27002 (supersedes ISO/IEC 17799)
12 9 (1.52%) HIPAA
12 9 (1.52%) NCSC
13 8 (1.35%) COBIT
14 5 (0.84%) ISO 9001
14 5 (0.84%) NIST 800
15 3 (0.51%) SOC 2
16 1 (0.17%) Actionable Recommendations
16 1 (0.17%) ITGC
16 1 (0.17%) PMO
System Software
1 101 (17.03%) Active Directory
2 53 (8.94%) VMware Infrastructure
3 48 (8.09%) Hyper-V
4 23 (3.88%) vSphere
5 14 (2.36%) VMware ESXi
6 13 (2.19%) Virtual Desktop
6 13 (2.19%) Virtual Machines
7 5 (0.84%) Docker
8 3 (0.51%) pfSense
8 3 (0.51%) Terminal Server
8 3 (0.51%) Virtual Servers
9 2 (0.34%) Firmware
9 2 (0.34%) VMware Workstation
10 1 (0.17%) BitLocker
10 1 (0.17%) NFS
Systems Management
1 35 (5.90%) Terraform
2 28 (4.72%) FortiGate
3 27 (4.55%) Microsoft Intune
4 20 (3.37%) Single Sign-On
5 16 (2.70%) Ansible
6 12 (2.02%) SCCM
7 9 (1.52%) vCenter Server
8 8 (1.35%) Failover Clustering
9 7 (1.18%) Autotask
9 7 (1.18%) Microsoft Clustering
10 6 (1.01%) Grafana
10 6 (1.01%) Kubernetes
10 6 (1.01%) Puppet
11 3 (0.51%) Data Guard
12 2 (0.34%) Nessus
12 2 (0.34%) NetIQ Identity Manager
12 2 (0.34%) Prometheus
12 2 (0.34%) WSUS
13 1 (0.17%) cPanel
13 1 (0.17%) Iperf
Vendors
1 210 (35.41%) Microsoft
2 72 (12.14%) VMware
3 51 (8.60%) Cisco
4 35 (5.90%) Oracle
5 30 (5.06%) Palo Alto
6 26 (4.38%) Veeam
7 21 (3.54%) SolarWinds
8 18 (3.04%) ServiceNow
9 16 (2.70%) Fortinet
10 15 (2.53%) HP
10 15 (2.53%) SAP
11 13 (2.19%) Dell
11 13 (2.19%) Splunk
12 11 (1.85%) Intel
12 11 (1.85%) Juniper
12 11 (1.85%) Nimble Storage
13 10 (1.69%) Zscaler
14 9 (1.52%) Google
14 9 (1.52%) Meraki
15 8 (1.35%) Proofpoint