Software Testing Jobs in England

Software Testing
UK > England

The table below provides summary statistics for permanent job vacancies advertised in England requiring Software Testing skills. It includes a benchmarking guide to the annual salaries offered in vacancies that cited Software Testing over the 6 months leading up to 31 May 2025, comparing them to the same period in the previous two years.

6 months to
31 May 2025
Same period 2024 Same period 2023
Rank 167 175 87
Rank change year-on-year +8 -88 +20
Permanent jobs citing Software Testing 963 1,436 3,212
As % of all permanent jobs advertised in England 1.95% 1.60% 3.77%
As % of the Processes & Methodologies category 2.08% 1.90% 3.95%
Number of salaries quoted 513 1,049 1,117
10th Percentile £31,750 £31,250 £32,500
25th Percentile £45,000 £39,500 £41,250
Median annual salary (50th Percentile) £57,560 £51,020 £55,000
Median % change year-on-year +12.82% -7.24% -
75th Percentile £67,500 £66,250 £75,000
90th Percentile £84,500 £85,000 £90,000
UK median annual salary £57,560 £50,000 £55,000
% change year-on-year +15.12% -9.09% +1.38%

All Process and Methodology Skills
England

Software Testing falls under the Processes and Methodologies category. For comparison with the information above, the following table provides summary statistics for all permanent job vacancies requiring process or methodology skills in England.

Permanent vacancies with a requirement for process or methodology skills 46,342 75,409 81,364
As % of all permanent jobs advertised in England 93.97% 83.96% 95.53%
Number of salaries quoted 23,102 54,812 48,959
10th Percentile £29,250 £29,000 £34,452
25th Percentile £41,250 £40,000 £46,000
Median annual salary (50th Percentile) £57,500 £55,000 £62,500
Median % change year-on-year +4.55% -12.00% +4.17%
75th Percentile £75,000 £72,500 £82,500
90th Percentile £97,528 £93,750 £102,500
UK median annual salary £57,000 £55,000 £60,899
% change year-on-year +3.64% -9.69% +1.50%

Software Testing
Job Vacancy Trend in England

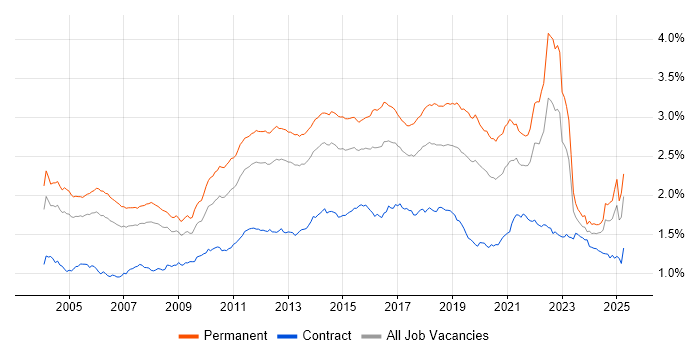
Job postings citing Software Testing as a proportion of all IT jobs advertised in England.

Job vacancy trend for Software Testing in England

Software Testing
Salary Trend in England

3-month moving average salary quoted in jobs citing Software Testing in England.

Salary trend for Software Testing in England

Software Testing
Salary Histogram in England

Salary distribution for jobs citing Software Testing in England over the 6 months to 31 May 2025.

Salary histogram for Software Testing in England

Software Testing
Job Locations in England

The table below looks at the demand and provides a guide to the median salaries quoted in IT jobs citing Software Testing within the England region over the 6 months to 31 May 2025. The 'Rank Change' column provides an indication of the change in demand within each location based on the same 6 month period last year.

Location Rank Change
on Same Period
Last Year
Matching
Permanent
IT Job Ads
Median Salary
Past 6 Months
Median Salary
% Change
on Same Period
Last Year
Live
Jobs
Midlands +92 354 £45,000 - 69
West Midlands +93 230 £19,202 -57.33% 36
South East -3 203 £60,000 +22.45% 119
London +16 170 £64,500 -6.18% 77
North of England -72 135 £57,560 +4.65% 65
East Midlands +64 124 £48,000 -2.69% 32
North West -71 88 £57,560 +4.65% 39
South West +51 68 £56,000 +12.00% 53
Yorkshire -7 41 £32,250 -41.36% 15
East of England -50 29 £53,000 -3.64% 26
North East +35 6 £40,000 -27.27% 11
Software Testing
UK

Software Testing
Co-occurring Skills and Capabilities in England by Category

The follow tables expand on the table above by listing co-occurrences grouped by category. The same employment type, locality and period is covered with up to 20 co-occurrences shown in each of the following categories:

Application Platforms
1 17 (1.77%) Confluence
2 14 (1.45%) Appian
3 9 (0.93%) SharePoint
4 7 (0.73%) WinCC
5 5 (0.52%) Apache
6 4 (0.42%) Microsoft Exchange
7 3 (0.31%) Cloud Foundry
8 2 (0.21%) Apache Spark
8 2 (0.21%) BizTalk Server
8 2 (0.21%) nginx
8 2 (0.21%) Traefik
9 1 (0.10%) FactoryTalk
9 1 (0.10%) JBoss
9 1 (0.10%) Oracle Workflow
Applications
1 209 (21.70%) Simulink
2 9 (0.93%) Microsoft Office
3 7 (0.73%) Chatbot
4 5 (0.52%) Microsoft Excel
4 5 (0.52%) Microsoft PowerPoint
5 2 (0.21%) MS Visio
Business Applications
1 2 (0.21%) Dynamics CRM
2 1 (0.10%) Elite 3E
2 1 (0.10%) Endur
2 1 (0.10%) LabWindows
2 1 (0.10%) NetSuite
2 1 (0.10%) Sage 200
2 1 (0.10%) SAP Business One
2 1 (0.10%) Shopify
Cloud Services
1 99 (10.28%) AWS
2 74 (7.68%) Azure
3 47 (4.88%) SaaS
4 35 (3.63%) Azure DevOps
5 25 (2.60%) Serverless
6 24 (2.49%) GCP
7 22 (2.28%) Cloud Computing
8 18 (1.87%) AWS Lambda
9 16 (1.66%) Amazon EC2
9 16 (1.66%) GitHub
10 13 (1.35%) Power Platform
11 10 (1.04%) Power Automate
12 8 (0.83%) Dynamics 365
12 8 (0.83%) GitHub Actions
12 8 (0.83%) Microsoft 365
13 5 (0.52%) Azure Logic Apps
14 4 (0.42%) Amazon EKS
14 4 (0.42%) Amazon SageMaker
14 4 (0.42%) Figma
14 4 (0.42%) Snowflake
Communications & Networking
1 12 (1.25%) LTE
2 11 (1.14%) 5G
2 11 (1.14%) Bluetooth
2 11 (1.14%) Wi-Fi
3 5 (0.52%) Ethernet
3 5 (0.52%) TCP/IP
4 4 (0.42%) HTTP
4 4 (0.42%) Profibus
4 4 (0.42%) Software-Defined Radio
4 4 (0.42%) VPN
5 3 (0.31%) DHCP
5 3 (0.31%) DNS
5 3 (0.31%) Firewall
5 3 (0.31%) Internet
6 2 (0.21%) ICMP
6 2 (0.21%) Network Security
6 2 (0.21%) Reverse Proxy
7 1 (0.10%) BGP
7 1 (0.10%) GSM
7 1 (0.10%) LAN
Database & Business Intelligence
1 53 (5.50%) SQL Server
2 30 (3.12%) PostgreSQL
3 19 (1.97%) Elasticsearch
4 16 (1.66%) NoSQL
5 15 (1.56%) DynamoDB
5 15 (1.56%) MongoDB
5 15 (1.56%) OLTP
6 13 (1.35%) Relational Database
7 10 (1.04%) MySQL
8 9 (0.93%) Redis
9 7 (0.73%) Power BI
10 6 (0.62%) SQL Server Reporting Services
11 5 (0.52%) SQL Server Integration Services
12 4 (0.42%) BigQuery
13 3 (0.31%) Big Data
13 3 (0.31%) Data Warehouse
13 3 (0.31%) Hazelcast
14 2 (0.21%) Hadoop
14 2 (0.21%) Microsoft Analysis Services
14 2 (0.21%) RDBMS
Development Applications
1 88 (9.14%) JIRA
2 68 (7.06%) Git
3 65 (6.75%) Selenium
4 29 (3.01%) Cypress.io
5 28 (2.91%) Jenkins
6 26 (2.70%) Postman
7 22 (2.28%) JMeter
8 21 (2.18%) eggPlant
9 17 (1.77%) SpecFlow
10 16 (1.66%) Appium
11 15 (1.56%) IntelliJ
11 15 (1.56%) JUnit
12 14 (1.45%) MagicDraw
13 11 (1.14%) NUnit
13 11 (1.14%) SoapUI
13 11 (1.14%) WebDriver
14 10 (1.04%) Cucumber
14 10 (1.04%) TestRail
15 9 (0.93%) LoadRunner
15 9 (0.93%) Maven
General
1 258 (26.79%) Aerospace
2 207 (21.50%) Automotive
3 190 (19.73%) Social Skills
4 94 (9.76%) Analytical Skills
5 77 (8.00%) Finance
6 44 (4.57%) Inclusion and Diversity
7 32 (3.32%) Banking
8 31 (3.22%) Law
9 29 (3.01%) Organisational Skills
10 17 (1.77%) Publishing
11 16 (1.66%) Health Technology
11 16 (1.66%) Tech for Good
12 15 (1.56%) Electronics
13 14 (1.45%) Legal
14 12 (1.25%) Public Sector
15 11 (1.14%) Games
15 11 (1.14%) Manufacturing
16 10 (1.04%) Retail
17 9 (0.93%) Marketing
18 8 (0.83%) Investment Banking
Job Titles
1 264 (27.41%) Senior
2 220 (22.85%) Software Engineer
3 137 (14.23%) Principal Engineer
4 122 (12.67%) Systems Engineer
5 119 (12.36%) Developer
6 110 (11.42%) Lead
7 103 (10.70%) Development Engineer
7 103 (10.70%) Software Development Engineer
8 99 (10.28%) Senior Software Engineer
9 87 (9.03%) Test Engineer
10 68 (7.06%) Analyst
11 66 (6.85%) Senior Developer
12 64 (6.65%) Principal Software Engineer
12 64 (6.65%) Software Test Engineer
13 63 (6.54%) Principal Systems Engineer
14 51 (5.30%) Senior Test Engineer
15 48 (4.98%) Senior Software Test Engineer
16 43 (4.47%) Software Developer
16 43 (4.47%) Test Analyst
17 38 (3.95%) Senior Systems Engineer
Libraries, Frameworks & Software Standards
1 73 (7.58%) React
2 67 (6.96%) .NET
3 43 (4.47%) HTML
4 40 (4.15%) REST
5 37 (3.84%) RESTful
6 35 (3.63%) XML
7 29 (3.01%) Playwright
8 28 (2.91%) .NET Core
8 28 (2.91%) ASP.NET
8 28 (2.91%) Kafka
8 28 (2.91%) Node.js
9 24 (2.49%) SOAP
10 23 (2.39%) Web Services
11 22 (2.28%) Swagger
12 20 (2.08%) CSS
13 19 (1.97%) AngularJS
14 15 (1.56%) .NET Framework
15 14 (1.45%) GraphQL
16 13 (1.35%) Qt
17 12 (1.25%) JSON
Miscellaneous
1 42 (4.36%) Mobile App
2 36 (3.74%) Product Ownership
3 31 (3.22%) Self-Motivation
4 23 (2.39%) Cloud Native
5 16 (1.66%) Acoustics
5 16 (1.66%) Distributed Systems
6 15 (1.56%) Embedded Systems
7 14 (1.45%) EPoS
7 14 (1.45%) SCADA
8 13 (1.35%) Robotics
9 11 (1.14%) Algorithms
9 11 (1.14%) IoT
9 11 (1.14%) NB-IoT
10 10 (1.04%) Onboarding
11 9 (0.93%) Virtual Team
12 7 (0.73%) FPGA
12 7 (0.73%) Public Cloud
13 5 (0.52%) Derivative
13 5 (0.52%) Driving Licence
13 5 (0.52%) Mobile Games
Operating Systems
1 62 (6.44%) Linux
2 58 (6.02%) Windows
3 27 (2.80%) Android
4 18 (1.87%) Apple iOS
5 15 (1.56%) Windows Server
6 12 (1.25%) Unix
7 3 (0.31%) Red Hat Enterprise Linux
8 2 (0.21%) Mac OS
8 2 (0.21%) Windows Server 2008
8 2 (0.21%) Windows Server 2012
9 1 (0.10%) Embedded Linux
9 1 (0.10%) Ubuntu
9 1 (0.10%) Windows Server 2019
Processes & Methodologies
1 593 (61.58%) Agile
2 373 (38.73%) Software Engineering
3 303 (31.46%) Test Automation
4 291 (30.22%) Validation
5 238 (24.71%) SDLC
6 217 (22.53%) Systems Engineering
7 177 (18.38%) Problem-Solving
8 176 (18.28%) Waterfall
9 150 (15.58%) Computer Science
10 116 (12.05%) CI/CD
11 97 (10.07%) Mathematics
12 88 (9.14%) Continuous Improvement
13 85 (8.83%) Scrum
14 79 (8.20%) UML
15 78 (8.10%) DevOps
16 76 (7.89%) Code Quality
17 73 (7.58%) Manual Testing
18 69 (7.17%) Regression Testing
19 60 (6.23%) Verification and Validation
20 58 (6.02%) Test Scripting
Programming Languages
1 208 (21.60%) MATLAB
2 165 (17.13%) Python
3 154 (15.99%) Java
4 152 (15.78%) SQL
5 114 (11.84%) C#
6 99 (10.28%) JavaScript
7 64 (6.65%) C++
7 64 (6.65%) TypeScript
8 37 (3.84%) C
9 35 (3.63%) Rust
10 28 (2.91%) Ada
11 27 (2.80%) Bash
12 25 (2.60%) PL/SQL
13 15 (1.56%) PowerShell
14 11 (1.14%) Fortran
15 7 (0.73%) VB.NET
16 6 (0.62%) Go
16 6 (0.62%) Scala
16 6 (0.62%) Swift
17 5 (0.52%) Embedded C
Qualifications
1 400 (41.54%) BPSS Clearance
2 346 (35.93%) Degree
3 64 (6.65%) ISTQB
4 54 (5.61%) Security Cleared
5 42 (4.36%) SC Cleared
6 40 (4.15%) Master's Degree
7 27 (2.80%) Computer Science Degree
7 27 (2.80%) PhD
8 20 (2.08%) ISTQB Foundation Certification
9 15 (1.56%) DV Cleared
10 12 (1.25%) Chartered Engineer
11 11 (1.14%) CompTIA Security+
11 11 (1.14%) Network+ Certification
12 7 (0.73%) AWS Certification
13 6 (0.62%) AWS Certified Solutions Architect
13 6 (0.62%) Azure Certification
14 5 (0.52%) ISEB
15 4 (0.42%) CISSP
16 3 (0.31%) Cisco Certification
16 3 (0.31%) Numerate Degree
Quality Assurance & Compliance
1 144 (14.95%) QA
2 42 (4.36%) ISO/IEC 12207
3 11 (1.14%) Accessibility
4 6 (0.62%) Def Stans
4 6 (0.62%) Software Quality Assurance
5 4 (0.42%) Data Quality
6 3 (0.31%) GDPR
6 3 (0.31%) NIST
6 3 (0.31%) PMBOK
6 3 (0.31%) WCAG
7 2 (0.21%) GxP
7 2 (0.21%) ISO 9001
7 2 (0.21%) ISO/IEC 27001
7 2 (0.21%) SLA
8 1 (0.10%) AUTOSAR
8 1 (0.10%) COBIT
8 1 (0.10%) IEC 61131
8 1 (0.10%) IEC 61508
8 1 (0.10%) NIST 800
System Software
1 43 (4.47%) Docker
2 11 (1.14%) VMware Infrastructure
2 11 (1.14%) vSphere
3 5 (0.52%) Firmware
4 1 (0.10%) Active Directory
4 1 (0.10%) Embedded Firmware
4 1 (0.10%) HDFS
Systems Management
1 46 (4.78%) Kubernetes
2 19 (1.97%) Terraform
3 14 (1.45%) Ansible
4 11 (1.14%) Puppet
5 9 (0.93%) Argo
6 7 (0.73%) Prometheus
7 5 (0.52%) HP Quality Center
8 4 (0.42%) Functional Safety
9 3 (0.31%) Grafana
10 2 (0.21%) HAProxy
11 1 (0.10%) FortiGate
11 1 (0.10%) Rundeck
11 1 (0.10%) SCCM
11 1 (0.10%) SCOM
Vendors
1 98 (10.18%) Siemens
2 70 (7.27%) Microsoft
3 67 (6.96%) Oracle
4 21 (2.18%) Keysight
4 21 (2.18%) VMware
5 18 (1.87%) Zoho
6 15 (1.56%) Google
7 9 (0.93%) UiPath
8 6 (0.62%) Red Hat
8 6 (0.62%) Rockwell
9 5 (0.52%) New Relic
9 5 (0.52%) Salesforce
9 5 (0.52%) Xilinx
10 4 (0.42%) Allen-Bradley
10 4 (0.42%) Databricks
10 4 (0.42%) IBM
10 4 (0.42%) Splunk
11 3 (0.31%) AVEVA
11 3 (0.31%) ServiceNow
12 2 (0.21%) Dynatrace