Strategic Planning Jobs in England

Strategic Planning
UK > England

The table below provides summary statistics for permanent job vacancies advertised in England requiring Strategic Planning skills. It includes a benchmarking guide to the annual salaries offered in vacancies that cited Strategic Planning over the 6 months leading up to 15 May 2025, comparing them to the same period in the previous two years.

6 months to
15 May 2025
Same period 2024 Same period 2023
Rank 342 432 578
Rank change year-on-year +90 +146 +185
Permanent jobs citing Strategic Planning 410 465 364
As % of all permanent jobs advertised in England 0.84% 0.54% 0.41%
As % of the Processes & Methodologies category 0.89% 0.64% 0.43%
Number of salaries quoted 245 308 219
10th Percentile £49,750 £35,139 £23,750
25th Percentile £62,500 £46,125 £35,500
Median annual salary (50th Percentile) £75,000 £57,500 £50,500
Median % change year-on-year +30.43% +13.86% -15.83%
75th Percentile £83,750 £75,625 £75,000
90th Percentile £102,500 £97,500 £100,000
UK median annual salary £76,000 £56,000 £48,500
% change year-on-year +35.71% +15.46% -19.17%

All Process and Methodology Skills
England

Strategic Planning falls under the Processes and Methodologies category. For comparison with the information above, the following table provides summary statistics for all permanent job vacancies requiring process or methodology skills in England.

Permanent vacancies with a requirement for process or methodology skills 46,063 73,227 85,387
As % of all permanent jobs advertised in England 94.14% 85.42% 95.62%
Number of salaries quoted 23,601 53,820 50,635
10th Percentile £30,000 £29,000 £34,324
25th Percentile £42,250 £40,000 £46,000
Median annual salary (50th Percentile) £57,500 £55,000 £62,500
Median % change year-on-year +4.55% -12.00% +4.17%
75th Percentile £76,000 £73,410 £82,500
90th Percentile £98,750 £93,750 £102,500
UK median annual salary £57,500 £55,000 £61,180
% change year-on-year +4.55% -10.10% +1.97%

Strategic Planning
Job Vacancy Trend in England

Job postings citing Strategic Planning as a proportion of all IT jobs advertised in England.
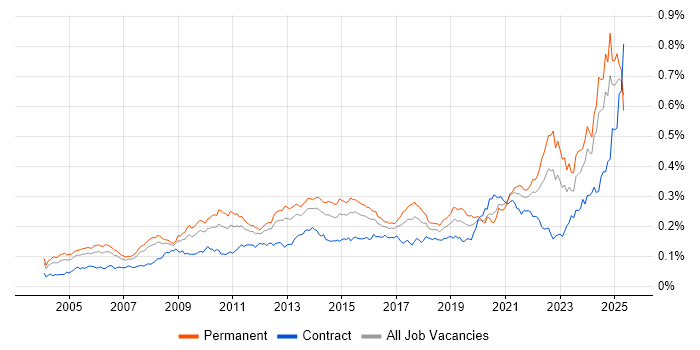
Job vacancy trend for Strategic Planning in England

Strategic Planning
Salary Trend in England

3-month moving average salary quoted in jobs citing Strategic Planning in England.

Salary trend for Strategic Planning in England

Strategic Planning
Salary Histogram in England

Salary distribution for jobs citing Strategic Planning in England over the 6 months to 15 May 2025.

Salary histogram for Strategic Planning in England

Strategic Planning
Job Locations in England

The table below looks at the demand and provides a guide to the median salaries quoted in IT jobs citing Strategic Planning within the England region over the 6 months to 15 May 2025. The 'Rank Change' column provides an indication of the change in demand within each location based on the same 6 month period last year.

Location Rank Change
on Same Period
Last Year
Matching
Permanent
IT Job Ads
Median Salary
Past 6 Months
Median Salary
% Change
on Same Period
Last Year
Live
Jobs
London +47 131 £77,500 +29.17% 347
South East +119 104 £70,000 +33.33% 120
East of England +79 71 £76,000 +38.18% 35
North of England +71 55 £62,500 +8.70% 88
Yorkshire +87 30 £67,500 +12.50% 30
Midlands +15 28 £62,500 - 56
West Midlands +27 23 £62,500 -7.41% 31
North West -4 21 £53,000 -18.46% 47
South West +108 16 £83,738 +27.84% 29
East Midlands +16 5 £60,000 +9.09% 21
North East +38 4 - - 13
Strategic Planning
UK

Strategic Planning
Co-occurring Skills and Capabilities in England by Category

The follow tables expand on the table above by listing co-occurrences grouped by category. The same employment type, locality and period is covered with up to 20 co-occurrences shown in each of the following categories:

Application Platforms
1 20 (4.88%) SharePoint
2 13 (3.17%) CMS
3 6 (1.46%) Microsoft Exchange
4 5 (1.22%) Moodle
5 2 (0.49%) ArcGIS
5 2 (0.49%) WordPress
6 1 (0.24%) CICS
6 1 (0.24%) Confluence
6 1 (0.24%) SharePoint Server
Applications
1 10 (2.44%) Microsoft Excel
2 7 (1.71%) Microsoft Office
2 7 (1.71%) Microsoft Project
3 5 (1.22%) Microsoft PowerPoint
4 2 (0.49%) Adobe Creative Suite
4 2 (0.49%) Adobe Illustrator
4 2 (0.49%) MS Visio
4 2 (0.49%) SOLIDWORKS
Business Applications
1 2 (0.49%) Workday HCM
2 1 (0.24%) Dynamics CRM
2 1 (0.24%) NetSuite
2 1 (0.24%) Oracle ERP
2 1 (0.24%) Primavera
2 1 (0.24%) Salesforce CRM
Cloud Services
1 129 (31.46%) Power Platform
2 65 (15.85%) Azure
3 39 (9.51%) Microsoft 365
4 21 (5.12%) AWS
4 21 (5.12%) Entra ID
4 21 (5.12%) SaaS
5 14 (3.41%) Google Analytics
6 11 (2.68%) Microsoft Purview
7 8 (1.95%) Azure Synapse Analytics
8 5 (1.22%) Power Automate
8 5 (1.22%) PowerApps
9 4 (0.98%) Cloud Computing
9 4 (0.98%) GCP
9 4 (0.98%) GitHub
10 3 (0.73%) Azure DevOps
11 2 (0.49%) Amazon EKS
11 2 (0.49%) Azure Sentinel
11 2 (0.49%) Dynamics 365
11 2 (0.49%) Mimecast
11 2 (0.49%) Nutanix
Communications & Networking
1 15 (3.66%) WAN
2 14 (3.41%) Firewall
3 11 (2.68%) LAN
4 10 (2.44%) Wi-Fi
5 9 (2.20%) Internet
6 7 (1.71%) DNS
7 6 (1.46%) Network Security
7 6 (1.46%) SD-WAN
8 4 (0.98%) DHCP
9 3 (0.73%) VLAN
10 2 (0.49%) DKIM
10 2 (0.49%) DMARC
10 2 (0.49%) NAS
10 2 (0.49%) SAN
10 2 (0.49%) Unified Communications
10 2 (0.49%) VoIP
11 1 (0.24%) HSRP
11 1 (0.24%) Intranet
11 1 (0.24%) VPN
11 1 (0.24%) WebEx
Database & Business Intelligence
1 123 (30.00%) Power BI
2 100 (24.39%) GIS
3 96 (23.41%) Power Query
4 94 (22.93%) Geospatial Data
5 13 (3.17%) Tableau
6 8 (1.95%) SQL Server
7 7 (1.71%) Data Warehouse
8 5 (1.22%) Electronic Patient Records
9 4 (0.98%) Metadata
10 3 (0.73%) Metadata Repository
10 3 (0.73%) Spark SQL
11 2 (0.49%) DTS
11 2 (0.49%) Enterprise Data Warehouse
11 2 (0.49%) PostgreSQL
12 1 (0.24%) DB2
12 1 (0.24%) KDB
12 1 (0.24%) SQL Server Integration Services
Development Applications
1 4 (0.98%) JIRA
2 3 (0.73%) GitLab
3 2 (0.49%) ERwin
4 1 (0.24%) Git
4 1 (0.24%) Jenkins
4 1 (0.24%) SQL Server Management Studio (SSMS)
4 1 (0.24%) Visual Studio
General
1 143 (34.88%) Social Skills
2 104 (25.37%) Finance
3 78 (19.02%) Analytical Skills
4 66 (16.10%) Marketing
5 39 (9.51%) Inclusion and Diversity
6 26 (6.34%) Influencing Skills
6 26 (6.34%) Public Sector
7 24 (5.85%) Manufacturing
8 19 (4.63%) Law
9 15 (3.66%) Electronics
10 14 (3.41%) Organisational Skills
10 14 (3.41%) Telecoms
11 8 (1.95%) Pharmaceutical
11 8 (1.95%) Retail
12 7 (1.71%) Humanities
13 6 (1.46%) Local Government
13 6 (1.46%) Publishing
14 5 (1.22%) Automotive
14 5 (1.22%) Legal
15 3 (0.73%) Banking
Job Titles
1 58 (14.15%) Lead
2 49 (11.95%) IT Manager
3 24 (5.85%) Project Manager
4 23 (5.61%) Senior
5 21 (5.12%) Architect
6 17 (4.15%) Operations Manager
7 16 (3.90%) Analyst
7 16 (3.90%) Data Analytics Director
8 15 (3.66%) IT Operations Manager
9 13 (3.17%) IT Support
10 12 (2.93%) IT Support Manager
10 12 (2.93%) Support Manager
11 11 (2.68%) Infrastructure Manager
12 9 (2.20%) Developer
12 9 (2.20%) Head of IT
12 9 (2.20%) Lead Architect
13 8 (1.95%) Consultant
13 8 (1.95%) Head of Digital
14 7 (1.71%) Financial Analyst
14 7 (1.71%) Product Manager
Libraries, Frameworks & Software Standards
1 13 (3.17%) CSS
1 13 (3.17%) HTML
2 9 (2.20%) Middleware
3 8 (1.95%) ADO
3 8 (1.95%) MERN Stack
3 8 (1.95%) REST
3 8 (1.95%) SOAP
3 8 (1.95%) WebSockets
4 6 (1.46%) PySpark
5 5 (1.22%) Lightning Web Components
6 4 (0.98%) React
7 3 (0.73%) YAML
8 2 (0.49%) .NET
8 2 (0.49%) SAML
8 2 (0.49%) Spring Boot
9 1 (0.24%) EDI
9 1 (0.24%) FIX Protocol
Miscellaneous
1 94 (22.93%) Algorithms
2 20 (4.88%) Data Centre
2 20 (4.88%) FMCG
3 15 (3.66%) Management Information System
3 15 (3.66%) Product Ownership
4 10 (2.44%) Hybrid Cloud
4 10 (2.44%) NHS
4 10 (2.44%) Podcast
5 9 (2.20%) Self-Motivation
6 8 (1.95%) Animation
6 8 (1.95%) Data Structures
6 8 (1.95%) Photography
6 8 (1.95%) Renewable Energy
7 7 (1.71%) Operational Technology
8 6 (1.46%) Marketing Technology
8 6 (1.46%) SCADA
9 5 (1.22%) Enterprise Software
9 5 (1.22%) Learning Management System
9 5 (1.22%) PACS
9 5 (1.22%) Virtual Team
Operating Systems
1 14 (3.41%) Windows
2 7 (1.71%) Linux
3 6 (1.46%) Android
3 6 (1.46%) Apple iOS
3 6 (1.46%) Windows Server
4 2 (0.49%) Mac OS X
4 2 (0.49%) Unix
5 1 (0.24%) Ubuntu
5 1 (0.24%) zOS
Processes & Methodologies
1 191 (46.59%) Problem-Solving
2 138 (33.66%) Business Intelligence
3 129 (31.46%) Service Delivery
4 106 (25.85%) Data Management
5 102 (24.88%) Asset Management
6 101 (24.63%) Actionable Insight
7 94 (22.93%) Project Management
8 74 (18.05%) Decision-Making
8 74 (18.05%) Roadmaps
9 71 (17.32%) Analytics
10 54 (13.17%) Business Strategy
10 54 (13.17%) ITIL
11 51 (12.44%) Continuous Improvement
12 45 (10.98%) Agile
13 43 (10.49%) Cybersecurity
14 40 (9.76%) Stakeholder Engagement
15 38 (9.27%) Mentoring
16 37 (9.02%) Project Delivery
17 34 (8.29%) Artificial Intelligence
18 33 (8.05%) Stakeholder Management
Programming Languages
1 121 (29.51%) SQL
2 23 (5.61%) Python
3 8 (1.95%) JavaScript
3 8 (1.95%) PowerShell
4 5 (1.22%) Java
5 4 (0.98%) TypeScript
6 3 (0.73%) C#
6 3 (0.73%) RPG
7 2 (0.49%) Bash
8 1 (0.24%) Assembly Language
8 1 (0.24%) COBOL
8 1 (0.24%) Data Analysis Expressions
8 1 (0.24%) REXX
8 1 (0.24%) T-SQL
Qualifications
1 101 (24.63%) Degree
2 37 (9.02%) PMI Certification
3 35 (8.54%) PMP
4 25 (6.10%) CISSP
5 21 (5.12%) BPSS Clearance
6 18 (4.39%) Computer Science Degree
7 10 (2.44%) Azure Certification
8 9 (2.20%) Microsoft Certification
9 7 (1.71%) AWS Certification
9 7 (1.71%) AWS Certified Solutions Architect
9 7 (1.71%) Postgraduate
9 7 (1.71%) SC Cleared
9 7 (1.71%) Security Cleared
10 6 (1.46%) Master's Degree
11 4 (0.98%) CCNP
11 4 (0.98%) Cisco Certification
12 3 (0.73%) ACCA
12 3 (0.73%) CIMA
12 3 (0.73%) MBA
13 2 (0.49%) VMware Certified Professional (VCP)
Quality Assurance & Compliance
1 28 (6.83%) GDPR
2 25 (6.10%) Accessibility
3 19 (4.63%) QA
4 16 (3.90%) Cyber Essentials
5 14 (3.41%) Cyber Essentials PLUS
6 9 (2.20%) Data Quality
7 6 (1.46%) ISO/IEC 27001
7 6 (1.46%) WCAG
8 5 (1.22%) Actionable Recommendations
9 4 (0.98%) SLA
10 3 (0.73%) Good Clinical Practice
10 3 (0.73%) PMO
11 2 (0.49%) NIST
11 2 (0.49%) PCI DSS
12 1 (0.24%) ISO 9001
12 1 (0.24%) ISO/IEC 19770
System Software
1 12 (2.93%) Active Directory
2 6 (1.46%) Hyper-V
3 4 (0.98%) Docker
4 3 (0.73%) VMware Infrastructure
5 2 (0.49%) Virtual Servers
5 2 (0.49%) vSphere
6 1 (0.24%) KVM
6 1 (0.24%) Virtual Machines
Systems Management
1 14 (3.41%) Terraform
2 12 (2.93%) Kubernetes
3 10 (2.44%) Ansible
4 2 (0.49%) Grafana
4 2 (0.49%) Single Sign-On
5 1 (0.24%) FortiGate
Vendors
1 80 (19.51%) Microsoft
2 27 (6.59%) Salesforce
3 18 (4.39%) Google
4 17 (4.15%) Cisco
5 15 (3.66%) SAP
6 9 (2.20%) YouTube
7 8 (1.95%) Aruba
7 8 (1.95%) Databricks
7 8 (1.95%) Fortinet
7 8 (1.95%) Mellanox
7 8 (1.95%) NVIDIA
7 8 (1.95%) Palo Alto
8 7 (1.71%) HubSpot
9 6 (1.46%) Facebook
10 5 (1.22%) Oracle
11 4 (0.98%) Adaptive Insights
11 4 (0.98%) Meraki
11 4 (0.98%) Veeam
11 4 (0.98%) Workday
12 3 (0.73%) ServiceNow