Architectural Design Jobs

Architectural Design
UK

The table below provides summary statistics for permanent job vacancies requiring Architectural Design skills. It includes a benchmarking guide to the annual salaries offered in vacancies that cited Architectural Design over the 6 months leading up to 3 November 2024, comparing them to the same period in the previous two years.

6 months to
3 Nov 2024
Same period 2023 Same period 2022
Rank 438 321 308
Rank change year-on-year -117 -13 +69
Permanent jobs citing Architectural Design 387 573 1,688
As % of all permanent jobs advertised in the UK 0.51% 1.01% 1.23%
As % of the Processes & Methodologies category 0.61% 1.07% 1.28%
Number of salaries quoted 205 284 701
10th Percentile £51,750 £52,500 £38,386
25th Percentile £63,250 £61,457 £53,750
Median annual salary (50th Percentile) £85,000 £80,000 £75,000
Median % change year-on-year +6.25% +6.67% -3.23%
75th Percentile £96,250 £90,000 £95,000
90th Percentile £108,250 £97,500 £110,000
UK excluding London median annual salary £82,500 £67,500 £63,184
% change year-on-year +22.22% +6.83% -2.79%

All Process and Methodology Skills
UK

Architectural Design falls under the Processes and Methodologies category. For comparison with the information above, the following table provides summary statistics for all permanent job vacancies requiring process or methodology skills.

Permanent vacancies with a requirement for process or methodology skills 63,646 53,449 132,120
As % of all permanent jobs advertised in the UK 84.12% 94.25% 96.10%
Number of salaries quoted 30,220 38,523 75,706
10th Percentile £34,080 £32,500 £34,000
25th Percentile £45,000 £44,000 £45,000
Median annual salary (50th Percentile) £60,000 £60,000 £60,000
Median % change year-on-year - - +4.35%
75th Percentile £78,000 £80,000 £81,250
90th Percentile £96,750 £98,200 £99,232
UK excluding London median annual salary £54,439 £52,500 £52,500
% change year-on-year +3.69% - +5.00%

Architectural Design
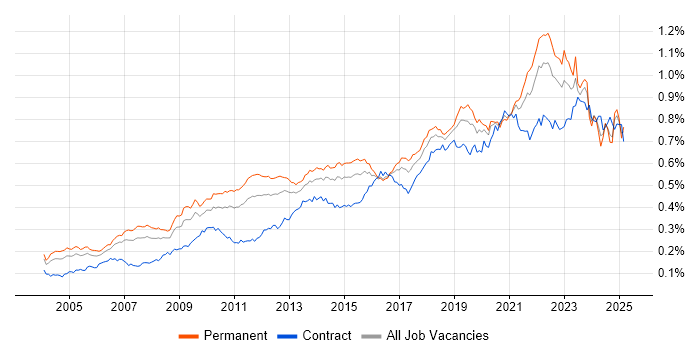
Job Vacancy Trend

Job postings citing Architectural Design as a proportion of all IT jobs advertised.

Job vacancy trend for Architectural Design in the UK

Architectural Design
Salary Trend

3-month moving average salary quoted in jobs citing Architectural Design.

Salary trend for Architectural Design in the UK

Architectural Design
Salary Histogram

Salary distribution for jobs citing Architectural Design over the 6 months to 3 November 2024.

Salary histogram for Architectural Design in the UK

Architectural Design
Top 17 Job Locations

The table below looks at the demand and provides a guide to the median salaries quoted in IT jobs citing Architectural Design within the UK over the 6 months to 3 November 2024. The 'Rank Change' column provides an indication of the change in demand within each location based on the same 6 month period last year.

Location Rank Change
on Same Period
Last Year
Matching
Permanent
IT Job Ads
Median Salary
Past 6 Months
Median Salary
% Change
on Same Period
Last Year
Live
Jobs
England -121 345 £85,000 +6.25% 106
UK excluding London -157 203 £82,500 +22.22% 93
London +8 163 £92,500 +10.12% 23
Work from Home +3 131 £80,000 - 109
North of England -51 65 £64,500 -3.38% 32
East of England -32 46 £85,000 +21.43% 7
North West -31 44 £77,750 +16.47% 28
South East -74 37 £70,000 -13.85% 15
Scotland -7 17 £90,000 +12.50% 5
Midlands -70 17 £84,350 +53.36% 17
West Midlands -41 15 £84,350 +53.36% 11
Yorkshire -12 12 £58,750 -12.96% 4
Wales +25 9 £42,500 -12.45% 2
North East -38 9 £56,000 +25.84%
South West -52 9 £55,000 -21.43% 13
Northern Ireland - 4 £96,250 - 4
East Midlands -61 2 - - 6

Architectural Design
Co-occurring Skills and Capabilities by Category

The follow tables expand on the table above by listing co-occurrences grouped by category. The same employment type, locality and period is covered with up to 20 co-occurrences shown in each of the following categories:

Application Platforms
1 17 (4.39%) IIS
2 8 (2.07%) Oracle SOA Suite
3 6 (1.55%) CMS
3 6 (1.55%) Microsoft Exchange
4 5 (1.29%) Apache
5 4 (1.03%) Apache Airflow
6 2 (0.52%) Apache Spark
6 2 (0.52%) OpenStack
6 2 (0.52%) SharePoint
7 1 (0.26%) Confluence
Applications
1 20 (5.17%) Microsoft Office
2 5 (1.29%) Photoshop
3 4 (1.03%) MS Visio
4 1 (0.26%) 3ds Max
4 1 (0.26%) AutoCAD
4 1 (0.26%) Blender
4 1 (0.26%) Maya
4 1 (0.26%) OrCAD
Business Applications
1 9 (2.33%) Oracle EBS
2 8 (2.07%) SAP S/4HANA
3 5 (1.29%) SDL Web 8
3 5 (1.29%) Sparx Enterprise Architect
4 3 (0.78%) Dynamics AX
5 1 (0.26%) SimCorp Dimension
Cloud Services
1 137 (35.40%) Azure
2 95 (24.55%) AWS
3 52 (13.44%) Serverless
4 43 (11.11%) GCP
5 34 (8.79%) SaaS
6 31 (8.01%) AWS Lambda
7 28 (7.24%) Azure Functions
8 26 (6.72%) Cloud Computing
9 18 (4.65%) Microsoft 365
10 15 (3.88%) PaaS
11 13 (3.36%) IaaS
12 10 (2.58%) OCI
13 9 (2.33%) Amazon ECS
13 9 (2.33%) Dynamics 365
14 7 (1.81%) Amazon CloudWatch
15 6 (1.55%) AWS Step Functions
15 6 (1.55%) Azure DevOps
15 6 (1.55%) Azure ExpressRoute
15 6 (1.55%) Azure Logic Apps
15 6 (1.55%) Azure Machine Learning
Communications & Networking
1 21 (5.43%) Internet
2 18 (4.65%) SSL
3 17 (4.39%) Intrusion Detection
4 11 (2.84%) Network Security
5 7 (1.81%) Wireless
6 6 (1.55%) LAN
6 6 (1.55%) MPLS
6 6 (1.55%) SD-WAN
6 6 (1.55%) WAN
6 6 (1.55%) WLAN
7 5 (1.29%) Cisco ISE
7 5 (1.29%) Firewall
7 5 (1.29%) Software-Defined Networking
8 4 (1.03%) Cisco Nexus
9 3 (0.78%) Unified Communications
10 2 (0.52%) HTTP
10 2 (0.52%) NGFW
10 2 (0.52%) VoIP
11 1 (0.26%) Cisco Firepower
11 1 (0.26%) Cisco Wireless
Database & Business Intelligence
1 34 (8.79%) NoSQL
2 18 (4.65%) SQL Server
3 14 (3.62%) PostgreSQL
4 12 (3.10%) Relational Database
5 9 (2.33%) Data Warehouse
5 9 (2.33%) Oracle ODI
6 8 (2.07%) RDBMS
7 7 (1.81%) Big Data
7 7 (1.81%) MongoDB
7 7 (1.81%) MySQL
8 6 (1.55%) Apache Cassandra
8 6 (1.55%) Data Lake
8 6 (1.55%) Metadata
9 5 (1.29%) Amazon Redshift
10 4 (1.03%) Apache Hive
10 4 (1.03%) Azure SQL Database
10 4 (1.03%) Enterprise Data Warehouse
10 4 (1.03%) HBase
10 4 (1.03%) Impala
10 4 (1.03%) Power BI
Development Applications
1 50 (12.92%) Git
2 39 (10.08%) Jenkins
3 29 (7.49%) Mockito
4 25 (6.46%) Gradle
4 25 (6.46%) Maven
4 25 (6.46%) Sonatype Nexus
5 8 (2.07%) JIRA
6 6 (1.55%) Visual Studio
7 5 (1.29%) git-flow
7 5 (1.29%) Moq
7 5 (1.29%) NUnit
7 5 (1.29%) Octopus Deploy
7 5 (1.29%) Sourcetree
7 5 (1.29%) SpecFlow
7 5 (1.29%) TeamCity
8 4 (1.03%) IntelliJ
8 4 (1.03%) JMeter
8 4 (1.03%) JUnit
9 2 (0.52%) ERwin
9 2 (0.52%) MagicDraw
General
1 126 (32.56%) Social Skills
2 65 (16.80%) Analytical Skills
3 60 (15.50%) Finance
4 34 (8.79%) Law
5 23 (5.94%) Inclusion and Diversity
6 22 (5.68%) Public Sector
7 20 (5.17%) Presentation Skills
8 17 (4.39%) Electronics
9 14 (3.62%) Automotive
9 14 (3.62%) Telecoms
10 11 (2.84%) Banking
11 9 (2.33%) Marketing
12 8 (2.07%) Financial Institution
12 8 (2.07%) Legal
13 6 (1.55%) Advertising
13 6 (1.55%) Games
14 4 (1.03%) Pharmaceutical
15 3 (0.78%) Aerospace
15 3 (0.78%) Retail
16 2 (0.52%) Investment Banking
Job Titles
1 180 (46.51%) Architect
2 59 (15.25%) Developer
2 59 (15.25%) Lead
2 59 (15.25%) Senior
3 39 (10.08%) Security Architect
4 34 (8.79%) Enterprise Architect
4 34 (8.79%) Software Architect
5 30 (7.75%) Java Developer
6 29 (7.49%) Solutions Architect
7 27 (6.98%) Senior Developer
8 24 (6.20%) Cloud Architect
9 19 (4.91%) Software Engineer
10 18 (4.65%) Data Architect
10 18 (4.65%) Systems Engineer
11 17 (4.39%) Lead Systems Engineer
12 15 (3.88%) Technical Architect
13 13 (3.36%) Principal Engineer
14 12 (3.10%) Azure Architect
14 12 (3.10%) Principal Systems Engineer
15 11 (2.84%) Senior Java Developer
Libraries, Frameworks & Software Standards
1 48 (12.40%) .NET
2 37 (9.56%) Kafka
2 37 (9.56%) Spring Boot
3 35 (9.04%) RESTful
4 32 (8.27%) Spring
5 29 (7.49%) SAML
6 28 (7.24%) OAuth
7 26 (6.72%) ASP.NET
8 25 (6.46%) OAuth2
8 25 (6.46%) RabbitMQ
9 15 (3.88%) HTML
10 14 (3.62%) Web Services
11 11 (2.84%) Middleware
12 10 (2.58%) jQuery
12 10 (2.58%) REST
13 9 (2.33%) CSS
13 9 (2.33%) SOAP
14 8 (2.07%) .NET Framework
14 8 (2.07%) Hibernate
14 8 (2.07%) React
Miscellaneous
1 30 (7.75%) Distributed Systems
1 30 (7.75%) Management Information System
2 28 (7.24%) Virtual Team
3 27 (6.98%) Cloud Native
4 25 (6.46%) Onboarding
5 19 (4.91%) Public Cloud
6 17 (4.39%) Cyber Threat
7 15 (3.88%) CSOC
8 11 (2.84%) Analogue Electronics
8 11 (2.84%) FPGA
8 11 (2.84%) Life Science
8 11 (2.84%) VHDL
9 8 (2.07%) Data Centre
9 8 (2.07%) Self-Motivation
10 7 (1.81%) Algorithms
10 7 (1.81%) Product Ownership
11 5 (1.29%) Greenfield Project
11 5 (1.29%) Hybrid Cloud
11 5 (1.29%) Legacy Code
11 5 (1.29%) Operational Technology
Operating Systems
1 52 (13.44%) Linux
2 36 (9.30%) Embedded Linux
3 35 (9.04%) Windows
4 34 (8.79%) Android
5 27 (6.98%) Windows Server
6 5 (1.29%) Unix
6 5 (1.29%) Windows 10
7 1 (0.26%) Apple iOS
7 1 (0.26%) zOS
Processes & Methodologies
1 96 (24.81%) Agile
2 84 (21.71%) DevOps
3 81 (20.93%) Mentoring
4 76 (19.64%) Problem-Solving
5 67 (17.31%) Roadmaps
6 58 (14.99%) Microservices
7 56 (14.47%) Architectural Patterns
8 52 (13.44%) Enterprise Architecture
9 50 (12.92%) Design Patterns
10 41 (10.59%) CI/CD
11 39 (10.08%) Stakeholder Management
12 34 (8.79%) Continuous Integration
13 33 (8.53%) TDD
13 33 (8.53%) Unit Testing
14 32 (8.27%) BDD
14 32 (8.27%) Software Engineering
15 31 (8.01%) Analytics
15 31 (8.01%) Artificial Intelligence
15 31 (8.01%) TOGAF
16 30 (7.75%) Scrum
Programming Languages
1 99 (25.58%) Java
2 50 (12.92%) C++
3 47 (12.14%) C
3 47 (12.14%) Python
4 31 (8.01%) SQL
5 29 (7.49%) Go
5 29 (7.49%) JavaScript
6 28 (7.24%) C#
7 8 (2.07%) PowerShell
8 7 (1.81%) Kotlin
9 5 (1.29%) PHP
9 5 (1.29%) Ruby
9 5 (1.29%) Scala
9 5 (1.29%) T-SQL
9 5 (1.29%) XPath
10 4 (1.03%) Kusto Query Language
10 4 (1.03%) Shell Script
11 3 (0.78%) Bicep
12 2 (0.52%) Embedded C++
12 2 (0.52%) PL/SQL
Qualifications
1 56 (14.47%) Security Cleared
2 42 (10.85%) Degree
2 42 (10.85%) SC Cleared
3 24 (6.20%) Azure Certification
4 16 (4.13%) BPSS Clearance
5 12 (3.10%) TOGAF Certification
6 9 (2.33%) Cisco Certification
6 9 (2.33%) CISSP
7 7 (1.81%) AWS Certification
7 7 (1.81%) AWS Certified Solutions Architect
7 7 (1.81%) Computer Science Degree
8 6 (1.55%) Master's Degree
9 5 (1.29%) (ISC)2 CCSP
9 5 (1.29%) CCSK
9 5 (1.29%) CCSP
9 5 (1.29%) CESG Certified Professional
9 5 (1.29%) CISM
9 5 (1.29%) SAP Certification
10 4 (1.03%) CISMP
10 4 (1.03%) Network+ Certification
Quality Assurance & Compliance
1 10 (2.58%) SOC 2
2 9 (2.33%) Data Quality
3 6 (1.55%) QA
4 5 (1.29%) Def Stans
4 5 (1.29%) NIST
4 5 (1.29%) NIST 800
5 3 (0.78%) SLA
6 2 (0.52%) Accessibility
6 2 (0.52%) ISO/IEC 27001
6 2 (0.52%) MISRA
6 2 (0.52%) MISRA C
7 1 (0.26%) ISO/IEC 15288
System Software
1 49 (12.66%) Docker
2 13 (3.36%) Firmware
3 8 (2.07%) Active Directory
4 6 (1.55%) Virtual Desktop
5 2 (0.52%) Embedded Firmware
6 1 (0.26%) GlusterFS
6 1 (0.26%) Virtual Machines
6 1 (0.26%) Virtual Servers
6 1 (0.26%) VMware Infrastructure
Systems Management
1 61 (15.76%) Kubernetes
2 46 (11.89%) Terraform
3 8 (2.07%) Ansible
3 8 (2.07%) Grafana
3 8 (2.07%) QRadar
4 6 (1.55%) Kibana
5 5 (1.29%) Prometheus
5 5 (1.29%) Puppet
6 2 (0.52%) Microsoft Intune
7 1 (0.26%) Active Directory Federation Services
7 1 (0.26%) AirWatch
7 1 (0.26%) Cisco Prime
7 1 (0.26%) SCCM
Vendors
1 109 (28.17%) Microsoft
2 21 (5.43%) Oracle
3 18 (4.65%) SAP
4 12 (3.10%) EMC
5 10 (2.58%) Google
5 10 (2.58%) MuleSoft
6 9 (2.33%) Salesforce
6 9 (2.33%) Splunk
7 8 (2.07%) Cisco
8 6 (1.55%) ServiceNow
9 5 (1.29%) Adobe
9 5 (1.29%) Cognizant
9 5 (1.29%) Palo Alto
9 5 (1.29%) Sparx
10 4 (1.03%) Cloudera
10 4 (1.03%) Dynatrace
10 4 (1.03%) IBM
10 4 (1.03%) LogRhythm
10 4 (1.03%) Meraki
11 3 (0.78%) Zend