Data Governance Jobs in England

Data Governance
UK > England

The table below provides summary statistics for permanent job vacancies advertised in England requiring Data Governance skills. It includes a benchmarking guide to the annual salaries offered in vacancies that cited Data Governance over the 6 months leading up to 23 May 2025, comparing them to the same period in the previous two years.

6 months to
23 May 2025
Same period 2024 Same period 2023
Rank 202 219 216
Rank change year-on-year +17 -3 +116
Permanent jobs citing Data Governance 773 1,165 1,495
As % of all permanent jobs advertised in England 1.60% 1.34% 1.70%
As % of the Processes & Methodologies category 1.70% 1.58% 1.78%
Number of salaries quoted 489 676 801
10th Percentile £48,750 £39,000 £46,250
25th Percentile £59,216 £52,500 £50,000
Median annual salary (50th Percentile) £85,000 £70,500 £67,500
Median % change year-on-year +20.57% +4.44% +3.85%
75th Percentile £110,000 £89,063 £87,500
90th Percentile £137,500 £107,500 £105,000
UK median annual salary £82,500 £70,000 £65,351
% change year-on-year +17.86% +7.11% +3.73%

All Process and Methodology Skills
England

Data Governance falls under the Processes and Methodologies category. For comparison with the information above, the following table provides summary statistics for all permanent job vacancies requiring process or methodology skills in England.

Permanent vacancies with a requirement for process or methodology skills 45,518 73,613 83,897
As % of all permanent jobs advertised in England 94.19% 84.97% 95.60%
Number of salaries quoted 22,437 53,908 49,787
10th Percentile £29,750 £29,000 £34,324
25th Percentile £41,750 £40,000 £46,067
Median annual salary (50th Percentile) £57,500 £55,000 £62,500
Median % change year-on-year +4.55% -12.00% +4.17%
75th Percentile £75,000 £73,000 £82,500
90th Percentile £98,750 £93,750 £102,500
UK median annual salary £57,500 £55,000 £61,000
% change year-on-year +4.55% -9.84% +1.67%

Data Governance
Job Vacancy Trend in England

Job postings citing Data Governance as a proportion of all IT jobs advertised in England.
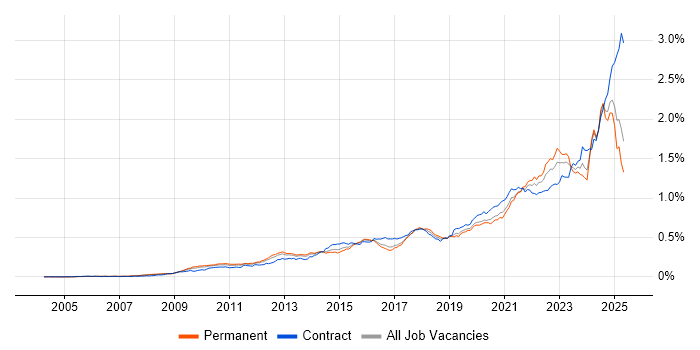
Job vacancy trend for Data Governance in England

Data Governance
Salary Trend in England

3-month moving average salary quoted in jobs citing Data Governance in England.

Salary trend for Data Governance in England

Data Governance
Salary Histogram in England

Salary distribution for jobs citing Data Governance in England over the 6 months to 23 May 2025.

Salary histogram for Data Governance in England

Data Governance
Job Locations in England

The table below looks at the demand and provides a guide to the median salaries quoted in IT jobs citing Data Governance within the England region over the 6 months to 23 May 2025. The 'Rank Change' column provides an indication of the change in demand within each location based on the same 6 month period last year.

Location Rank Change
on Same Period
Last Year
Matching
Permanent
IT Job Ads
Median Salary
Past 6 Months
Median Salary
% Change
on Same Period
Last Year
Live
Jobs
London +75 396 £100,000 +33.33% 613
South East +133 187 £64,500 -4.44% 645
Midlands -23 68 £60,000 +9.09% 377
North of England -127 64 £60,743 -21.59% 479
West Midlands +8 56 £60,000 +9.09% 203
North West -92 33 £57,500 -23.33% 229
South West +51 30 £60,000 -7.69% 227
Yorkshire -22 28 £60,743 -24.01% 191
East of England +31 15 £57,000 +8.57% 248
East Midlands -5 11 £47,500 -20.83% 150
North East +4 3 £62,500 -21.81% 59
Data Governance
UK

Data Governance
Co-occurring Skills and Capabilities in England by Category

The follow tables expand on the table above by listing co-occurrences grouped by category. The same employment type, locality and period is covered with up to 20 co-occurrences shown in each of the following categories:

Application Platforms
1 56 (7.24%) Apache Spark
2 37 (4.79%) SharePoint
3 24 (3.10%) Apache
3 24 (3.10%) CMS
4 17 (2.20%) Apache Airflow
5 5 (0.65%) Confluence
6 4 (0.52%) SAS
7 3 (0.39%) SugarCRM
8 2 (0.26%) ArcGIS
9 1 (0.13%) NetWeaver
Applications
1 31 (4.01%) Microsoft Excel
2 12 (1.55%) Microsoft Office
3 6 (0.78%) Microsoft PowerPoint
4 3 (0.39%) Maya
4 3 (0.39%) MS Visio
5 1 (0.13%) Microsoft Project
5 1 (0.13%) Oracle Smart View
5 1 (0.13%) Spreadsheet
Business Applications
1 7 (0.91%) Dynamics CRM
2 5 (0.65%) Oracle ERP
2 5 (0.65%) Remedy ITSM
3 4 (0.52%) SAP S/4HANA
4 3 (0.39%) Oracle EBS
5 2 (0.26%) Oracle Applications
5 2 (0.26%) SAP ERP
5 2 (0.26%) Shopify
6 1 (0.13%) Dynamics GP
6 1 (0.13%) Infor M3
6 1 (0.13%) Lorenzo
6 1 (0.13%) Payment Gateway
6 1 (0.13%) SAP FI
6 1 (0.13%) SAP MDG
6 1 (0.13%) Sparx Enterprise Architect
6 1 (0.13%) SystmOne
Cloud Services
1 269 (34.80%) Azure
2 190 (24.58%) Power Platform
3 128 (16.56%) AWS
4 91 (11.77%) GCP
5 64 (8.28%) Snowflake
6 56 (7.24%) Microsoft Purview
7 42 (5.43%) Power Automate
8 40 (5.17%) PowerApps
9 38 (4.92%) Azure Synapse Analytics
10 34 (4.40%) SaaS
11 31 (4.01%) Collibra
12 30 (3.88%) PaaS
13 29 (3.75%) Azure Data Factory
14 25 (3.23%) Serverless
15 22 (2.85%) Cloud Computing
16 19 (2.46%) iPaaS
16 19 (2.46%) Microsoft 365
17 18 (2.33%) Amazon S3
18 12 (1.55%) Azure DevOps
19 10 (1.29%) dbt
Communications & Networking
1 11 (1.42%) HTTP
2 3 (0.39%) SMS
3 1 (0.13%) DHCP
3 1 (0.13%) DNS
3 1 (0.13%) Firewall
3 1 (0.13%) Network Security
3 1 (0.13%) TCP/IP
Database & Business Intelligence
1 197 (25.49%) Data Lake
2 182 (23.54%) Power BI
3 129 (16.69%) Data Warehouse
4 102 (13.20%) Metadata
5 85 (11.00%) Tableau
6 72 (9.31%) Big Data
7 42 (5.43%) NoSQL
8 36 (4.66%) SQL Server
9 33 (4.27%) Hadoop
10 23 (2.98%) Amazon Redshift
11 22 (2.85%) BigQuery
12 18 (2.33%) Relational Database
13 17 (2.20%) SQL Server Integration Services
13 17 (2.20%) SQL Server Reporting Services
14 14 (1.81%) Metadata Repository
15 13 (1.68%) Delta Lake
16 9 (1.16%) Azure SQL Database
16 9 (1.16%) IBM InfoSphere
17 8 (1.03%) Looker
18 7 (0.91%) MongoDB
Development Applications
1 18 (2.33%) JIRA
2 13 (1.68%) Git
3 11 (1.42%) PowerBuilder
4 8 (1.03%) ERwin
5 6 (0.78%) Bitbucket
6 5 (0.65%) Jenkins
7 3 (0.39%) CircleCI
7 3 (0.39%) ER Studio
8 2 (0.26%) MLflow
8 2 (0.26%) PowerDesigner
9 1 (0.13%) GitLab
General
1 325 (42.04%) Finance
2 208 (26.91%) Social Skills
3 150 (19.40%) Analytical Skills
4 138 (17.85%) Law
5 101 (13.07%) Front Office
6 70 (9.06%) Marketing
7 64 (8.28%) Legal
8 52 (6.73%) Banking
9 39 (5.05%) Public Sector
10 37 (4.79%) Presentation Skills
11 32 (4.14%) Organisational Skills
12 25 (3.23%) Inclusion and Diversity
13 20 (2.59%) Manufacturing
13 20 (2.59%) Retail
14 17 (2.20%) Influencing Skills
15 12 (1.55%) Advertising
16 11 (1.42%) Local Government
17 9 (1.16%) Investment Banking
18 7 (0.91%) Financial Institution
19 5 (0.65%) Documentation Skills
Job Titles
1 234 (30.27%) Lead
2 129 (16.69%) Architect
3 101 (13.07%) Senior
4 77 (9.96%) Data Engineer
5 71 (9.18%) Data Architect
6 64 (8.28%) Analyst
7 60 (7.76%) Data Manager
8 41 (5.30%) Governance Manager
9 40 (5.17%) Data Governance Analyst
9 40 (5.17%) Data Governance Manager
10 34 (4.40%) Data Analyst
11 30 (3.88%) Head of Finance
12 27 (3.49%) Senior Data Engineer
13 24 (3.10%) Solutions Architect
14 23 (2.98%) IT Architect
15 22 (2.85%) Consultant
15 22 (2.85%) Data Analytics Director
15 22 (2.85%) Lead Architect
16 21 (2.72%) Finance Manager
16 21 (2.72%) Programme Manager
Libraries, Frameworks & Software Standards
1 35 (4.53%) Kafka
2 32 (4.14%) REST
3 27 (3.49%) PySpark
4 22 (2.85%) SOAP
5 17 (2.20%) React
6 16 (2.07%) GraphQL
7 15 (1.94%) .NET
7 15 (1.94%) Middleware
8 10 (1.29%) ADO
9 9 (1.16%) XML
10 8 (1.03%) MERN Stack
10 8 (1.03%) WebSockets
11 6 (0.78%) JSON
11 6 (0.78%) PyArrow
12 5 (0.65%) Dask
13 4 (0.52%) Great Expectations
13 4 (0.52%) Oracle Fusion
13 4 (0.52%) Polars
13 4 (0.52%) pytest
14 3 (0.39%) YAML
Miscellaneous
1 96 (12.42%) Hedge funds
2 94 (12.16%) Derivative
2 94 (12.16%) Equities
2 94 (12.16%) Fixed Income
2 94 (12.16%) Foreign Exchange (FX)
3 51 (6.60%) Product Ownership
4 36 (4.66%) Management Information System
5 29 (3.75%) Data Structures
5 29 (3.75%) FMCG
6 26 (3.36%) Cloud Native
7 19 (2.46%) Greenfield Project
8 16 (2.07%) Self-Motivation
9 13 (1.68%) Analytical Mindset
10 11 (1.42%) Legacy Systems
10 11 (1.42%) Reference Data
10 11 (1.42%) Reinsurance
11 9 (1.16%) Taxonomies
12 7 (0.91%) Data Centre
13 6 (0.78%) Marketing Technology
14 5 (0.65%) Algorithms
Operating Systems
1 15 (1.94%) Windows
2 7 (0.91%) Unix
3 6 (0.78%) Linux
3 6 (0.78%) Windows Server
4 5 (0.65%) Windows 10
5 1 (0.13%) Windows Server 2008
5 1 (0.13%) Windows Server 2019
Processes & Methodologies
1 309 (39.97%) Data Management
2 297 (38.42%) Analytics
3 246 (31.82%) Agile
4 216 (27.94%) Business Intelligence
5 201 (26.00%) Roadmaps
6 190 (24.58%) Data Modelling
7 181 (23.42%) Decision-Making
8 174 (22.51%) Data Engineering
9 172 (22.25%) Migration
10 170 (21.99%) Data Strategy
11 169 (21.86%) Data Architecture
12 149 (19.28%) Regulatory Compliance
13 139 (17.98%) ETL
14 126 (16.30%) Data Pipeline
15 124 (16.04%) Problem-Solving
16 121 (15.65%) Data Science
17 120 (15.52%) Artificial Intelligence
18 118 (15.27%) Stakeholder Management
19 110 (14.23%) Mentoring
20 109 (14.10%) Machine Learning
Programming Languages
1 232 (30.01%) SQL
2 144 (18.63%) Python
3 22 (2.85%) Java
4 20 (2.59%) JavaScript
5 19 (2.46%) C#
6 18 (2.33%) Scala
7 15 (1.94%) Data Analysis Expressions
8 12 (1.55%) T-SQL
9 11 (1.42%) PowerShell
10 10 (1.29%) R
11 6 (0.78%) PL/SQL
12 5 (0.65%) Shell Script
12 5 (0.65%) SPARQL
13 4 (0.52%) Bash
14 2 (0.26%) Bicep
14 2 (0.26%) Ruby
14 2 (0.26%) VB
15 1 (0.13%) C
15 1 (0.13%) VBA
Qualifications
1 209 (27.04%) Degree
2 36 (4.66%) Computer Science Degree
2 36 (4.66%) Master's Degree
3 24 (3.10%) Azure Certification
4 22 (2.85%) Security Cleared
5 18 (2.33%) SC Cleared
6 17 (2.20%) DBS Check
7 13 (1.68%) Microsoft Certification
8 11 (1.42%) AWS Certification
9 7 (0.91%) BPSS Clearance
10 6 (0.78%) MBA
10 6 (0.78%) Numerate Degree
11 5 (0.65%) PhD
12 4 (0.52%) PMI Certification
12 4 (0.52%) PMP
12 4 (0.52%) Tableau Certification
13 3 (0.39%) DV Cleared
14 2 (0.26%) AWS Certified Solutions Architect
14 2 (0.26%) HNC
14 2 (0.26%) SnowPro
Quality Assurance & Compliance
1 291 (37.65%) Data Quality
2 80 (10.35%) Accessibility
2 80 (10.35%) GDPR
3 57 (7.37%) QA
4 48 (6.21%) MiFID
5 17 (2.20%) California Consumer Privacy Act
6 11 (1.42%) ISO/IEC 27001
7 7 (0.91%) Actionable Recommendations
8 6 (0.78%) Cyber Essentials
9 3 (0.39%) 21 CFR Part 11
9 3 (0.39%) Good Clinical Practice
9 3 (0.39%) PCI DSS
9 3 (0.39%) Sarbanes-Oxley
10 2 (0.26%) COBIT
10 2 (0.26%) Cyber Essentials PLUS
10 2 (0.26%) Dublin Core
10 2 (0.26%) HIPAA
10 2 (0.26%) NIST
10 2 (0.26%) Solvency II
11 1 (0.13%) GRC
System Software
1 25 (3.23%) Docker
2 9 (1.16%) HDFS
3 4 (0.52%) Virtual Machines
4 2 (0.26%) Active Directory
Systems Management
1 31 (4.01%) Kubernetes
2 24 (3.10%) Terraform
3 5 (0.65%) SCCM
4 2 (0.26%) Ansible
4 2 (0.26%) Hadoop YARN
5 1 (0.13%) Oracle RMAN
Vendors
1 145 (18.76%) Microsoft
2 79 (10.22%) Databricks
3 51 (6.60%) Informatica
4 44 (5.69%) Google
5 31 (4.01%) ServiceNow
6 18 (2.33%) Oracle
7 16 (2.07%) SAP
8 12 (1.55%) IBM
8 12 (1.55%) Talend
9 7 (0.91%) Salesforce
10 6 (0.78%) iManage
10 6 (0.78%) Red Hat
11 5 (0.65%) Alteryx
11 5 (0.65%) Remedy
12 4 (0.52%) Duck Creek
12 4 (0.52%) Intapp
12 4 (0.52%) Sage
13 3 (0.39%) Cloudera
13 3 (0.39%) Facebook
13 3 (0.39%) YouTube