Azure Job Trends in London

Microsoft Azure
England > London

The table below provides summary statistics and salary benchmarking for jobs advertised in London requiring Azure skills. It covers permanent job vacancies from the 6 months leading up to 24 November 2025, with comparisons to the same periods in the previous two years.

6 months to
24 Nov 2025
Same period 2024 Same period 2023
Rank 4 4 4
Rank change year-on-year 0 0 +1
Permanent jobs citing Azure 2,337 3,484 4,279
As % of all permanent jobs in London 18.20% 19.83% 22.78%
As % of the Cloud Services category 41.30% 44.06% 48.05%
Number of salaries quoted 1,683 2,475 3,733
10th Percentile £41,250 £46,250 £47,250
25th Percentile £56,250 £57,500 £58,000
Median annual salary (50th Percentile) £75,000 £75,000 £75,000
75th Percentile £93,750 £95,000 £95,000
90th Percentile £112,500 £113,750 £115,000
England median annual salary £60,000 £65,000 £62,500
% change year-on-year -7.69% +4.00% -3.85%

All Cloud Skills
London

Azure falls under the Cloud Services category. For comparison with the information above, the following table provides summary statistics for all permanent job vacancies requiring cloud computing skills in London.

Permanent vacancies with a requirement for cloud computing skills 5,658 7,908 8,906
As % of all permanent jobs advertised in London 44.07% 45.01% 47.42%
Number of salaries quoted 3,680 5,258 7,592
10th Percentile £36,250 £45,000 £42,500
25th Percentile £52,500 £57,500 £56,661
Median annual salary (50th Percentile) £75,000 £77,500 £75,000
Median % change year-on-year -3.23% +3.33% -
75th Percentile £95,000 £98,750 £95,000
90th Percentile £120,000 £121,625 £115,000
England median annual salary £58,000 £65,000 £62,500
% change year-on-year -10.77% +4.00% -3.85%

Azure
Job Vacancy Trend in London

Historical trend showing the proportion of permanent IT job postings citing Azure relative to all permanent IT jobs advertised in London.
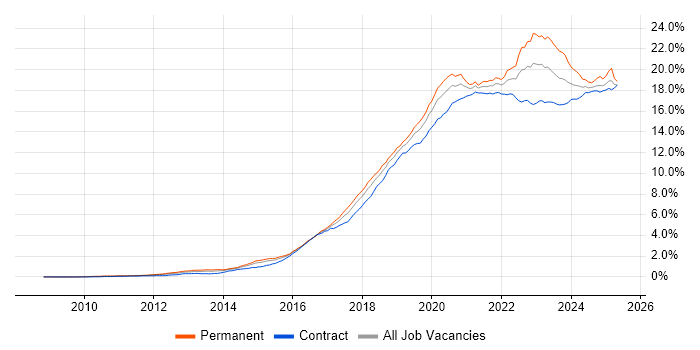
Azure job vacancy trend in London

Azure
Salary Trend in London

Salary distribution trend for jobs in London citing Azure.

Salary distribution trend for jobs in London citing Azure

Azure
Salary Histogram in London

Salary distribution for jobs citing Azure in London over the 6 months to 24 November 2025.

Salary histogram for Azure in London

Azure
Job Locations in London

The table below looks at the demand and provides a guide to the median salaries quoted in IT jobs citing Azure within the London region over the 6 months to 24 November 2025. The 'Rank Change' column provides an indication of the change in demand within each location based on the same 6 month period last year.

Location Rank Change
on Same Period
Last Year
Matching
Permanent
IT Job Ads
Median Salary
Past 6 Months
Median Salary
% Change
on Same Period
Last Year
Live
Jobs
Central London 0 443 £77,000 +6.21% 218
West London +2 56 £73,250 +1.03% 75
North London +17 24 £75,000 +27.66% 18
South London +12 24 £65,000 +5.44% 36
East London -14 21 £34,000 -31.66% 70
Azure
England

Azure
Co-Occurring Skills & Capabilities in London by Category

The following tables expand on the one above by listing co-occurrences grouped by category. They cover the same employment type, locality and period, with up to 20 co-occurrences shown in each category:

Application Platforms
1 168 (7.19%) SharePoint
2 148 (6.33%) Microsoft Exchange
3 81 (3.47%) Apache Spark
4 42 (1.80%) Apache Airflow
5 33 (1.41%) Confluence
6 20 (0.86%) CMS
7 19 (0.81%) Apache
8 14 (0.60%) IIS
9 6 (0.26%) Moodle
9 6 (0.26%) Oracle Workflow
10 5 (0.21%) Apache Solr
10 5 (0.21%) Appian
10 5 (0.21%) BizTalk Server
10 5 (0.21%) nginx
10 5 (0.21%) WordPress
11 4 (0.17%) Anypoint
11 4 (0.17%) Apache Pulsar
11 4 (0.17%) Apache Synapse
11 4 (0.17%) Jupyter
11 4 (0.17%) Oracle SOA Suite
Applications
1 36 (1.54%) Microsoft Excel
2 31 (1.33%) Microsoft Office
3 11 (0.47%) MS Visio
4 8 (0.34%) Maya
5 6 (0.26%) Microsoft Project
6 5 (0.21%) Chatbot
6 5 (0.21%) PlantUML
7 4 (0.17%) Microsoft PowerPoint
8 3 (0.13%) Adobe Creative Suite
8 3 (0.13%) CINEMA 4D
9 2 (0.086%) Trello
10 1 (0.043%) Adobe XD
Business Applications
1 58 (2.48%) Dynamics CRM
2 31 (1.33%) SAP S/4HANA
3 14 (0.60%) Endur
4 11 (0.47%) SAP IBP
5 7 (0.30%) Payment Gateway
6 6 (0.26%) Shopify
7 5 (0.21%) NetSuite
8 4 (0.17%) Fidessa
9 3 (0.13%) Elite 3E
9 3 (0.13%) SAP CX
10 2 (0.086%) Aladdin
10 2 (0.086%) Oracle EBS
10 2 (0.086%) Unit4 Business World
11 1 (0.043%) Carpe Diem
11 1 (0.043%) Dynamics AX
11 1 (0.043%) Markit EDM
11 1 (0.043%) Oracle BPM
11 1 (0.043%) SimCorp Dimension
11 1 (0.043%) Temenos T24
Cloud Services
1 843 (36.07%) AWS
2 471 (20.15%) GCP
3 401 (17.16%) Microsoft 365
4 392 (16.77%) Power Platform
5 334 (14.29%) Azure DevOps
6 243 (10.40%) Entra ID
7 162 (6.93%) SaaS
8 154 (6.59%) GitHub
9 141 (6.03%) Azure Data Factory
10 134 (5.73%) Dynamics 365
10 134 (5.73%) Power Automate
11 117 (5.01%) Serverless
12 116 (4.96%) Azure Logic Apps
13 114 (4.88%) PowerApps
14 106 (4.54%) PaaS
15 102 (4.36%) Azure Synapse Analytics
16 74 (3.17%) Azure Sentinel
17 68 (2.91%) Snowflake
18 61 (2.61%) Azure Functions
19 60 (2.57%) Azure AI
Communications & Networking
1 226 (9.67%) Firewall
2 121 (5.18%) WAN
3 119 (5.09%) VPN
4 113 (4.84%) DNS
5 105 (4.49%) LAN
6 76 (3.25%) DHCP
7 75 (3.21%) TCP/IP
8 72 (3.08%) Network Security
9 58 (2.48%) Wi-Fi
10 47 (2.01%) Wireless
11 44 (1.88%) SD-WAN
12 37 (1.58%) VLAN
13 36 (1.54%) Internet
14 35 (1.50%) VoIP
15 24 (1.03%) BGP
15 24 (1.03%) OSPF
16 20 (0.86%) SAN
17 14 (0.60%) Cisco ASA
18 13 (0.56%) EIGRP
18 13 (0.56%) Wireshark
Database & Business Intelligence
1 268 (11.47%) Power BI
2 234 (10.01%) SQL Server
3 175 (7.49%) Data Warehouse
4 135 (5.78%) Data Lake
5 122 (5.22%) NoSQL
6 108 (4.62%) Azure SQL Database
7 96 (4.11%) Relational Database
8 90 (3.85%) MongoDB
9 83 (3.55%) Metadata
10 77 (3.29%) PostgreSQL
11 55 (2.35%) Big Data
12 43 (1.84%) Elasticsearch
13 41 (1.75%) SQL Server Integration Services
14 40 (1.71%) MySQL
15 39 (1.67%) Hadoop
16 31 (1.33%) Amazon Redshift
17 28 (1.20%) Tableau
18 25 (1.07%) SQL Server Reporting Services
19 22 (0.94%) BigQuery
19 22 (0.94%) SQL Server Analysis Services
Development Applications
1 196 (8.39%) Git
2 108 (4.62%) JIRA
3 72 (3.08%) Jenkins
4 48 (2.05%) GitLab
5 39 (1.67%) Visual Studio
6 23 (0.98%) Postman
7 21 (0.90%) MLflow
7 21 (0.90%) Selenium
8 16 (0.68%) Cypress.io
8 16 (0.68%) Octopus Deploy
9 15 (0.64%) JMeter
10 14 (0.60%) TeamCity
10 14 (0.60%) Visual Studio Code
11 11 (0.47%) SonarQube
12 10 (0.43%) Artifactory
12 10 (0.43%) CircleCI
13 7 (0.30%) Bitbucket
13 7 (0.30%) Cucumber
13 7 (0.30%) Sonatype Nexus
14 6 (0.26%) SpecFlow
General
1 754 (32.26%) Social Skills
2 727 (31.11%) Finance
3 289 (12.37%) Analytical Skills
4 236 (10.10%) Law
5 189 (8.09%) Banking
6 188 (8.04%) Inclusion and Diversity
7 139 (5.95%) Retail
8 121 (5.18%) Marketing
9 117 (5.01%) Legal
10 76 (3.25%) Public Sector
11 62 (2.65%) Financial Institution
12 61 (2.61%) Telecoms
13 58 (2.48%) Presentation Skills
14 44 (1.88%) Documentation Skills
15 42 (1.80%) Influencing Skills
16 34 (1.45%) Manufacturing
17 32 (1.37%) Pharmaceutical
18 30 (1.28%) Retail Banking
19 29 (1.24%) Games
20 27 (1.16%) Billing
Job Titles
1 434 (18.57%) Senior
2 355 (15.19%) Developer
3 321 (13.74%) Lead
4 293 (12.54%) Architect
5 189 (8.09%) Analyst
6 184 (7.87%) Data Engineer
7 135 (5.78%) Azure Engineer
8 115 (4.92%) Support Engineer
9 107 (4.58%) Infrastructure Engineer
10 100 (4.28%) Software Engineer
11 97 (4.15%) Solutions Architect
12 93 (3.98%) Senior Developer
13 85 (3.64%) Data Architect
14 75 (3.21%) .NET Developer
14 75 (3.21%) IT Support
15 74 (3.17%) Support Analyst
16 68 (2.91%) DevOps Engineer
17 67 (2.87%) Cloud Engineer
18 61 (2.61%) Security Engineer
19 55 (2.35%) Consultant
Libraries, Frameworks & Software Standards
1 278 (11.90%) .NET
2 184 (7.87%) React
3 132 (5.65%) REST
4 109 (4.66%) .NET Core
5 108 (4.62%) AngularJS
5 108 (4.62%) HTML
6 100 (4.28%) RESTful
7 98 (4.19%) Kafka
8 93 (3.98%) CSS
9 86 (3.68%) Node.js
10 72 (3.08%) ASP.NET
11 71 (3.04%) Vue
12 62 (2.65%) .NET Framework
13 58 (2.48%) PySpark
14 56 (2.40%) Web Services
15 49 (2.10%) OAuth
16 46 (1.97%) ASP.NET MVC
16 46 (1.97%) Middleware
16 46 (1.97%) YAML
17 45 (1.93%) PyTorch
Miscellaneous
1 216 (9.24%) Cloud Native
2 108 (4.62%) Product Ownership
3 103 (4.41%) Hybrid Cloud
4 93 (3.98%) Management Information System
5 76 (3.25%) Enterprise Software
6 70 (3.00%) Distributed Systems
7 69 (2.95%) Security Posture
8 67 (2.87%) Data Centre
9 58 (2.48%) Public Cloud
10 53 (2.27%) Legacy Systems
11 51 (2.18%) Low-Code
11 51 (2.18%) Onboarding
12 50 (2.14%) AI Agents
13 48 (2.05%) Self-Motivation
14 39 (1.67%) Greenfield Project
15 38 (1.63%) Data Structures
16 37 (1.58%) Private Cloud
16 37 (1.58%) Reinsurance
17 35 (1.50%) Algorithms
18 33 (1.41%) Virtual Team
Operating Systems
1 391 (16.73%) Windows
2 181 (7.74%) Windows Server
3 170 (7.27%) Linux
4 62 (2.65%) Windows 10
5 43 (1.84%) Mac OS
6 40 (1.71%) Unix
7 30 (1.28%) Apple iOS
8 28 (1.20%) Android
8 28 (1.20%) Windows Server 2019
9 19 (0.81%) VMS
10 16 (0.68%) Red Hat Enterprise Linux
11 14 (0.60%) Windows Server 2016
12 8 (0.34%) Mac OS X
13 7 (0.30%) CentOS
14 6 (0.26%) Solaris
14 6 (0.26%) Ubuntu
14 6 (0.26%) Windows Server 2012
15 3 (0.13%) HPUX
15 3 (0.13%) Oracle Linux
16 2 (0.086%) SUSE
Processes & Methodologies
1 715 (30.59%) DevOps
2 655 (28.03%) Agile
3 612 (26.19%) CI/CD
4 501 (21.44%) Problem-Solving
5 459 (19.64%) AI
6 404 (17.29%) Analytics
7 312 (13.35%) Mentoring
8 289 (12.37%) Continuous Improvement
9 284 (12.15%) Data Modelling
10 282 (12.07%) Computer Science
11 279 (11.94%) Business Intelligence
12 277 (11.85%) Microservices
13 274 (11.72%) Roadmaps
14 264 (11.30%) Infrastructure as Code
15 261 (11.17%) Software Engineering
16 250 (10.70%) Machine Learning
17 241 (10.31%) ETL
18 238 (10.18%) Cybersecurity
19 233 (9.97%) Migration
20 222 (9.50%) ITIL
Programming Languages
1 649 (27.77%) Python
2 613 (26.23%) SQL
3 306 (13.09%) C#
4 276 (11.81%) PowerShell
5 251 (10.74%) JavaScript
6 142 (6.08%) Java
7 137 (5.86%) TypeScript
8 68 (2.91%) Bash
9 52 (2.23%) T-SQL
10 43 (1.84%) Bicep
11 35 (1.50%) Scala
12 33 (1.41%) Data Analysis Expressions
13 32 (1.37%) Go
14 28 (1.20%) R
15 24 (1.03%) Shell Script
16 21 (0.90%) Kotlin
17 18 (0.77%) Kusto Query Language
18 16 (0.68%) Rust
19 14 (0.60%) C++
20 12 (0.51%) PHP
Qualifications
1 416 (17.80%) Degree
2 207 (8.86%) Azure Certification
3 195 (8.34%) Computer Science Degree
4 136 (5.82%) Microsoft Certification
5 124 (5.31%) Security Cleared
6 112 (4.79%) AWS Certification
7 108 (4.62%) Master's Degree
8 88 (3.77%) SC Cleared
9 72 (3.08%) CISSP
10 66 (2.82%) Cisco Certification
11 42 (1.80%) CCNP
12 31 (1.33%) CISM
13 30 (1.28%) CCNA
13 30 (1.28%) TOGAF Certification
14 29 (1.24%) DV Cleared
15 25 (1.07%) MCSE
15 25 (1.07%) PMI Certification
16 24 (1.03%) AWS Certified Cloud Practitioner
17 23 (0.98%) CCIE
17 23 (0.98%) PhD
Quality Assurance & Compliance
1 182 (7.79%) GDPR
2 158 (6.76%) ISO/IEC 27001
3 125 (5.35%) QA
4 119 (5.09%) NIST
5 106 (4.54%) Data Quality
6 36 (1.54%) SLA
7 33 (1.41%) Cyber Essentials
8 28 (1.20%) EU AI Act
8 28 (1.20%) NCSC
9 25 (1.07%) HIPAA
10 23 (0.98%) PSD2
10 23 (0.98%) Solvency II
11 22 (0.94%) Accessibility
12 17 (0.73%) PCI DSS
13 13 (0.56%) Cyber Essentials PLUS
13 13 (0.56%) PMO
14 11 (0.47%) SOC 2
15 7 (0.30%) EMIR
15 7 (0.30%) GRC
15 7 (0.30%) ISO 22301
System Software
1 328 (14.04%) Active Directory
2 231 (9.88%) Docker
3 95 (4.07%) VMware Infrastructure
4 61 (2.61%) Hyper-V
5 23 (0.98%) Virtual Machines
6 18 (0.77%) Virtual Desktop
7 14 (0.60%) VMware ESXi
8 13 (0.56%) Firmware
9 12 (0.51%) vSphere
10 11 (0.47%) BitLocker
11 8 (0.34%) NFS
12 6 (0.26%) XenDesktop
13 5 (0.21%) VMware NSX
13 5 (0.21%) XenApp
14 4 (0.17%) ISA Server
14 4 (0.17%) KVM
14 4 (0.17%) Postfix
14 4 (0.17%) ProxySG
14 4 (0.17%) zsh
15 2 (0.086%) Terminal Server
Systems Management
1 289 (12.37%) Kubernetes
2 282 (12.07%) Terraform
3 202 (8.64%) Microsoft Intune
4 128 (5.48%) Ansible
5 51 (2.18%) SCCM
6 48 (2.05%) Single Sign-On
7 42 (1.80%) Grafana
7 42 (1.80%) Prometheus
8 19 (0.81%) Argo
9 16 (0.68%) FortiGate
10 15 (0.64%) Jamf Pro
11 11 (0.47%) Autotask
11 11 (0.47%) Kubeflow
11 11 (0.47%) SCOM
12 10 (0.43%) CASB
13 9 (0.39%) Puppet
14 6 (0.26%) Rancher
15 5 (0.21%) Active Directory Federation Services
15 5 (0.21%) vCenter Server
15 5 (0.21%) vRealize
Vendors
1 994 (42.53%) Microsoft
2 222 (9.50%) Databricks
3 163 (6.97%) VMware
4 128 (5.48%) Cisco
5 105 (4.49%) Google
6 92 (3.94%) Oracle
7 66 (2.82%) Palo Alto
7 66 (2.82%) ServiceNow
8 58 (2.48%) SAP
9 44 (1.88%) Salesforce
10 40 (1.71%) Fortinet
10 40 (1.71%) SolarWinds
11 39 (1.67%) Meraki
12 31 (1.33%) OpenAI
13 30 (1.28%) Citrix
14 29 (1.24%) Informatica
15 27 (1.16%) Splunk
16 24 (1.03%) Dell
17 23 (0.98%) CheckPoint
17 23 (0.98%) CrowdStrike